Article
Combining Decision Support Approaches for
Optimizing the Selection of Bundles of Ecosystem
Services
Marco Marto1,*, Keith M. Reynolds2, José G. Borges1, Vladimir Bushenkov3 and Susete Marques1 1 Forest Research Centre, School of Agriculture, University of Lisbon
Tapada da Ajuda, 1349-017 Lisboa, Portugal
2 US Department of Agriculture, Forest Service, Pacific Northwest Research Station, Corvallis Forestry Sciences Laboratory
3200 SW Jefferson Way, Corvallis, OR 97331, USA
3 School of Sciences and Technology, Mathematics Department, University of Evora Colégio Luís António Verney, Rua Romão Ramalho, 59, 7000-671 Évora, Portugal * Correspondence: [email protected]; Tel.: +351 21 365 3344
Abstract: This study examines the potential of combining decision support approaches to identify optimal bundles of ecosystem services. A forested landscape, Zona de Intervenção Florestal of Paiva and Entre-Douro and Sousa (Portugal), is used to test and demonstrate this potential. The landscape extends over 14,000 ha, representing 1,976 stands. The property is fragmented into 376 holdings. The overall analysis was performed in three steps. First, we selected six alternative solutions (A to F) in a Pareto frontier generated by a multiple criteria method within a decision support system (SADfLOR) for subsequent analysis. Next, an aspatial strategic multi-criteria decision analysis (MCDA) analysis was performed with the Criterium DecisionPlus (CDP) component of another decision support system (EMDS) to assess the aggregate performance of solutions A to F for the entire forested landscape with respect to their utility for delivery of ecosystem services. For the CDP analysis, SADfLOR data inputs were grouped into two sets of primary criteria: Wood Harvested and Other Ecosystem Services. Finally, a spatial logic-based assessment of solutions A to F for individual stands of the study area was performed with the NetWeaver component of EMDS. The NetWeaver model was structurally and computationally equivalent to the CDP model, but the key NetWeaver metric is a measure of the strength of evidence that solutions for specific land stands were optimal for the unit. Solutions D and B performed best in the aspatial strategic MCDA analysis, and a composite of the maps generated by NetWeaver demonstrated the spatial basis for the performance of solutions D and B in individual land stands. We conclude with a discussion of how the combination of decision support approaches encapsulated in the two systems could be further automated.
Keywords: Decision support; multi-criteria decision analysis; multiple criteria Pareto frontier methods; Criterium Decision Plus; Net Weaver Developer; SADfLOR; Ecosystem Management Decision Support system.
1. Introduction
Decision support systems (DSS) originated as important tools to aid decision makers in business administration and industrial management in the 1960s ([1]). DSS technologies were subsequently widely adopted in many other disciplinary areas, including natural resource management, in which DSS had become widespread by the mid-1980s ([2]). Spatial DSS in particular began evolving in the late 1990s, coinciding with significant advances in geographic information systems (GIS) and computing power in this timeframe ([3]). The Ecosystem Management Decision Support (EMDS) system was one of the earliest examples of a spatial DSS for environmental analysis and planning ([4-5]), but the system has steadily evolved since that time, and remains in wide use up to the present time ([6]). The EMDS system is an application framework for constructing DSS for integrated, multi-scale analysis and planning ([7]). It supports landscape-level analyses through logic and decision engines integrated with the ArcGIS® geographic information system (GIS, Environmental Systems Research Institute, Redlands, CA, USA), and the open source GIS systems QGIS, MapWindow, and DotSpatial.
The logic engine evaluates landscape data against a logic model designed in the NetWeaver Developer® system ([8]) to derive logic-based interpretations of complex ecosystem conditions such as watershed condition, wildfire potential, and landscape integrity. Logic modeling can be defined as a form of knowledge-based reasoning in which expert or tacit knowledge is used to construct a representation of how to think about and solve a problem ([9]). In the EMDS context, in particular, logic is used to reason about the meaning of environmental states (e.g., given the data from the prescriptions on a management area, what can we infer about the score of each stand with respect to the criteria values for each non-dominated solution?). EMDS decision models are built with Criterium DecisionPlus® (CDP, InfoHarvest, Seattle, WA, USA), which implements the Analytical Hierarchy Process (AHP; [10]), the Simple Multi-Attribute Rating Technique (SMART; [11]), or their combination. The AHP belongs to the general class of multi-criteria decision models (MCDMs; [12]), while SMART derives from the closely related field of multi-attribute utility theory (MAUT; [13]). Engines that implement Multi-Criteria Decision Methods (MCDM) solutions in particular have become increasingly common in contemporary DSS architectures for environmental decision support, beginning about 1995, either as stand-alone MCDM solutions or as MCDM components of larger systems such as EMDS. In contrast, the use of logic engines in environmental decision support is far less common in contemporary systems. However, logic processing has remained at the core of EMDS functionality since 1995 because of its capability to model the relatively large, complex, and often abstract problems associated with decision support for ecosystem management and adaptive management ([6]).
suggest the potential of combining the multiple criteria functionality of both the web based SADfLOR and CDP and NetWeaver to enhance further the negotiation of solutions.
A multi-criteria decision problem involves choosing one among various non-dominated alternatives on how well those alternatives rate against a chosen set of structured criteria (Reynolds, 2005). Thus, CDP and NetWeaver as multi-criteria DSS can be used to compare the performance of multiple alternative solutions following a pre-defined model with criteria values resulting from the optimization process of SADfLOR. Both knowledge-based DSS are useful to solve this problem. NetWeaver is based on fuzzy logic networks which are well suited as logic frameworks for integrating model results from various analytical systems such as simulators, linear programs, Bayesian belief networks, and production-rule systems ([18]). On the other hand, CDP provides extensive support for implementing this decision process, including setting priorities, explaining the derivation of conclusions, checking model robustness, and providing trade-off analyses. The criteria are weighted in terms of importance to the decision maker and in the end, after the evaluation by the model, the alternatives are ordered by their decision scores as a prioritized ranking of alternatives by preference ([19]).
In the present study, we describe the use of a combination of decision support approaches encapsulated in the EMDS and the web-based SADfLOR systems to recommend optimal selections of alternative management combinations in the study area. Firstly, we use a spatially explicit multiple criteria method within SADfLOR to generate both the decision space and the criteria space of the management planning problem. This decision approach presents ecosystem services trade-off information in the form of Pareto frontiers. In the first aspatial phase of the analysis, we use the CDP component of EMDS to perform a multi-criteria decision analysis that assesses the aggregate performance of selected points on the Pareto frontier for the study area as a whole. In the second spatial phase of the analysis, the NetWeaver component of EMDS is used to recommend selection of specific points on the Pareto frontier in specific landscape units of the study area. In the discussion, we conclude by considering the advantages and complexities of employing a hybrid DSS such as EMDS/SADfLOR to realize the potential of the combination of the decision support approaches
2. Materials and Methods
Study Area
Figure 1. Zona de Intervenção Florestal (ZIF) Paiva and Entre-Douro e Sousa. Source: Project ALTERFOR 2018.
Overview of decision tools and analytical steps
In this work, we focus on the integrated application of three decision support approaches encapsulated in two DSS. The decision support approaches are: a multiple criteria Pareto frontier method available in the web-based SADfLOR DSS, an aspatial strategic multi-criteria decision analysis (MCDA) method available in the Criterium DecisionPlus (CDP) component of the EMDS DSS and a spatial logic-based approach available in the NetWeaver component of EMDS
The web-based tool encapsulates a multi-criteria mathematical programming model and displays the trade-offs between ecosystem services in the form of Pareto frontiers. This analysis supports the selection of packages of ecosystem services according to the preferences of decision makers. For that purpose, the ecosystem services are classified by the tool into two sets of criteria. The first includes wood products (e.g. total wood), while the second includes non-wood products as well as non-market services (e.g. biodiversity). The interface of the web-based tool asks the decision maker whether the provision of each ecosystem service (criteria) is to be maximized or minimized. After the selection by decision makers of the list of ecosystem services to maximize or minimize in the bundle, the tool launches the process for generating the Pareto frontiers (e.g. [21, 22]). This information provides a basis for the negotiation of the packages of ecosystem services to be supplied by the decision-makers ([17]). These packages correspond to non-dominated points in the Pareto frontier. After its selection, the web based tool triggers the solution of the multi-criteria mathematical programming problem associated to each point, i.e. it retrieves the management plan that may convey the corresponding package of services.
analysis (MCDA) DSS that is useful for ranking alternatives based on how well each rates against a set of decision criteria ([23]). CDP implements both the analytic hierarchy process (AHP; [10,24]) and SMART ([11]) techniques. We use the AHP method to derive weights on criteria and sub-criteria by the pair-wise comparison technique, but we use SMART to score the performance of the attributes of alternatives. The combined use of AHP and SMART offers the advantage of eliminating, or at least greatly reducing, the well-known problem of rank reversal of alternatives in the classic AHP approach in which scores on attributes of alternatives are derived by pair-wise comparisons ([23]). NetWeaver provides a logic-based framework which is useful to evaluate the conflicting alternative solutions chosen by different (groups of) decision makers. It has two features with respect to the learning process: NetWeaver models provide detailed, permanent documentation about how we conceive that a system should be evaluated, and the modular architecture of logic models is well suited to the incremental, evolutionary adaptation of the models as knowledge changes ([23])
The overall analysis is performed in three steps:
1. Generation of the criteria space and selection of six alternative points on the Pareto frontier for subsequent analysis.
2. Aspatial multiple criteria decision analysis of the aggregate performance of points on the Pareto frontier for the entire study region.
3. Spatial logic-based assessment of points on the Pareto frontier for individual stands of the study area.
Details of these three analytical steps are presented in the next three sub sections.
The criteria space and the Pareto frontier
A multi-criteria mathematical programming method within the web-based SADfLOR is used to define the forest management planning decision space. This is translated into the corresponding criteria space and Pareto frontiers by the interactive decision map technique. In this application, it is assumed that, following a negotiation process, decision-makers select six bundles of ecosystem services (six points in Pareto frontiers) for further analysis. The tool reads this information and triggers the solution by the multi-criteria mathematical programming method to find the corresponding six management plans.
Aspatial multiple criteria decision analysis
makers, in which the primary criteria are equally weighted. The key analysis metric for CDP is a measure of utility that expresses the preference among Pareto points, given the weight assigned to the primary criteria in the CDP model. Note that this a classical strategic MCDA analysis in which the alternatives are the aggregate results summarized by alternative solution points on the Pareto frontier.
Spatial logic-based assessment of points on the Pareto frontier for individual stands
In the final step of the analysis, we use the weights developed in the second analytical step in a logic model that is executed by the NetWeaver component of EMDS to assess performance of the delivery of ecosystem services at the scale of individual stands. Each of the six non-dominated points from the Pareto solution is associated with a map that is evaluated in EMDS, because the input data vary with the Pareto point selected. The NetWeaver model is structurally and computationally equivalent to the CDP model, but the key NetWeaver metric is a measure of strength of evidence. In this application, the topmost logic topic in the model is evaluating evidence that a particular Pareto solution delivers ecosystem services in a stand. One map of NetWeaver outcomes is generated in EMDS for each Pareto point. Maps are symbolized in terms of degree of evidence that the solution delivers ecosystem services. This analysis disaggregates the strategic MCDA analysis to individual stands.
The data inputs to NetWeaver include the ecosystem services target values (per ha) in the six bundles selected by stakeholders and the corresponding management plans (e.g. one prescription per stand). Each data input to NetWeaver is evaluated by a fuzzy membership function that returns the strength of evidence that the observed value contributes to delivery of ecosystem services. Fuzzy membership functions in NetWeaver are scaled to the interval [-1, 1], in which -1 indicates no evidence, and 1 indicates full evidence. For each data input, the function was normalized to the observed data by setting the x-value corresponding to an evidence value of -1 as the minimum of the data distribution, considering the data range in the variable across all six Pareto solutions and all land stands. In general, data values were significantly right skewed, so the x-value corresponding to an evidence value of 1 was set to the 90th percentile of the distribution for each input in order to provide a more
useful distribution of outcomes on each input variable.
3. Results
The criteria space and the Pareto frontier
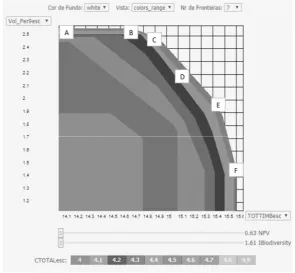
Decision makers interact with the Pareto frontier tool and can get several non-dominated solutions according to their preferences and compare them to different levels of ecosystem services achieved, taking into account the tradeoffs between data inputs. When we have various (groups of) decision makers, there is no single point on the Pareto frontier for the management area that provides a solution simultaneously optimal for the differing preferences of this diverse group (Figure 2). The solutions corresponding to the six points in the Pareto frontier (Table 1) resulted from the multi-criteria maximization of the five data inputs (Total Wood, Volume of Ending Inventory, Average Carbon Sequestration, Net Present Value and Biodiversity Indicator).
Figure 2. Image of the Pareto Frontier tool.
important effects for the NPV is due to the profit of harvested volume or thinned volume which are sold, in this case, as standing wood.
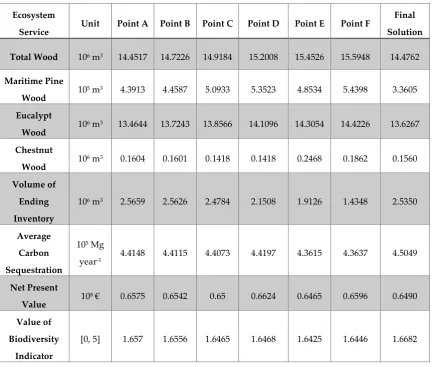
Table 1 - Selected results for ecosystem services for the planning horizon of 90 yearsa.
Ecosystem
Service Unit Point A Point B Point C Point D Point E Point F
Final Solution Total Wood 106 m3 14.4517 14.7226 14.9184 15.2008 15.4526 15.5948 14.4762 Maritime Pine
Wood 105 m3 4.3913 4.4587 5.0933 5.3523 4.8534 5.4398 3.3605 Eucalypt
Wood 106 m3 13.4644 13.7243 13.8566 14.1096 14.3054 14.4226 13.6267 Chestnut
Wood 106 m3 0.1604 0.1601 0.1418 0.1418 0.2468 0.1862 0.1560 Volume of
Ending Inventory
106 m3 2.5659 2.5626 2.4784 2.1508 1.9126 1.4348 2.5350
Average Carbon Sequestration
105 Mg
year-1 4.4148 4.4115 4.4073 4.4197 4.3615 4.3637 4.5049
Net Present
Value 108 € 0.6575 0.6542 0.65 0.6624 0.6465 0.6596 0.6490 Value of
Biodiversity Indicator
[0, 5] 1.657 1.6556 1.6465 1.6468 1.6425 1.6446 1.6682
a The positions of the solution points, A to F, are shown in Figure 1.
Aspatial multiple criteria decision analysis of the Pareto frontier
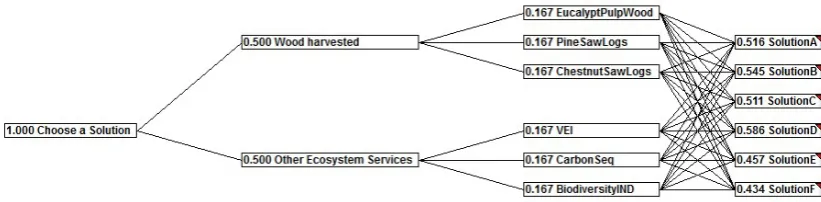
weighting can be thought of as a default specification for a potentially diverse set of owner perspectives. In this context, the model ranked first solution D (0.586) (Figure 3), partly as a consequence of its higher contribution to the average carbon stock.
The analysis of model sensitivity in CDP demonstrated that the resulting model was somewhat sensitive with respect to identifying solution D as the top-rated alternative, given that the most sensitive criterion/attribute combination had a critical cross-over value of 6.4%. In other words, the absolute value of the weight on the most sensitive combination would have to increase by only 6.4% before solution B would outrank solution D. The convention, recommended by [10, 24] is that the most sensitive combination in the sensitivity analysis should have a cross-over value of at least ±10% to robustly conclude that the top-ranked alternative is indeed the best. Considering the contributions of the primary criteria to the overall decision score, it can be seen that solutions A to D are more or less comparable in terms of the overall decision score for each alternative, but there are significant differences among these four alternatives in terms of their contributions to other ecosystem services, and solutions A to D clearly perform better than either solution E or F with respect to other ecosystem services (Figure 4).
Figure 4. Contributions of primary decision criteria (Figure 3) to the overall CDP utility score for the six solutions (A to F) from the Pareto frontier analysis (Figure 2).
Spatial analysis of Pareto points for individual stands
Results from the previous section showed that solution D performed best with respect to delivery of ecosystem services when we consider the aggregate performance of each solution for the entire study area over the 90-year planning horizon. In the spatial phase of the analysis, we next look at how the six non-dominated solutions performed at the scale of individual stands. For the spatial analysis, we used a NetWeaver model (Figure 5), executed in EMDS, that was structurally and computationally equivalent to the aspatial CDP model (Figure 3) to evaluate performance for each stand (Figure 6). Due to the combination of the map scale and the five-class map symbology (Figure 6), the performance of the six solutions appears very similar, although a close examination of outcomes reveals small differences in the optimal solution choice for individual stands (see the set of map enlargements in the Supplementary materials). To better discriminate among the
0.00 0.10 0.20 0.30 0.40 0.50 0.60
SolutionD SolutionB SolutionA SolutionC SolutionE SolutionF
0.32
0.46 0.49
0.33
0.07
0.03 0.26
0.09 0.03
0.18
0.39
0.40
Primary Criteria:
Figure 5. NetWeaver model to assess delivery of ecosystem services for individual stands. Data inputs at the stand level vary by Pareto solution (A-F), so this model is evaluated in EMDS with a separate assessment for each Pareto solution (Figure 6). Each oval represents a logic topic. Gray topics shown at the bottom of the diagram are elementary topics that
evaluate data inputs with fuzzy membership functions.
Figure 6. Evaluation of individual stands for solutions A to F from the Pareto frontier (Figure 2) with the values of variables per ha using the same NetWeaver model used for evaluating the best point (Figure 5). The percentile 90 was
performance of solutions at the scale of stands, scores for all solutions were compiled into a single map layer and stands were coded according to the best solution (Figure 7). Pareto solutions D (1229 polygons) and B (623 polygons) clearly dominate the map (Figure 7), with a few scattered occurrences of solution A (64 polygons), F (16 polygons), C (3 polygons) and E (2 polygons). The corresponding solution in the criteria space is characterized by the highest values of average carbon stock and biodiversity and the lowest net present value (Table 1).
Figure 7. Best solution (A to F from Pareto frontier) for each stand, based on NetWeaver scores for each solution from the NetWeaver model (Figure 6).
4. Discussion
Pareto frontier applications have been used to study various forestry and natural resources phenomena related to several ecosystem services and forest management and planning in the Forest Research Centre of School of Agriculture, University of Lisbon. In fact, this decision support tool has been integrated into several DSS developed in the Forest Research Centre. Some examples of DSS-related studies developed in the Forest Research Centre are [14, 15, 22, 25]. The Pareto frontier module in Web-based SADfLOR encapsulates the Feasible Goals Method/Interactive Decision Maps technique for interactive visualization of the web-based Pareto frontier ([26]). The set of criteria considered in this research included three wood products and a sub set of other ecosystem services (e.g., biodiversity, average carbon stored). The multiple criteria method may be used to generate ecosystem resource capability models that may expand the range of ecosystem services in that set.
When there is only one decision maker, or a group of decision makers with similar preferences, the choice of only a single point on the Pareto frontier may be sufficient for strategic planning. However, whereas SADfLOR identified optimal (non-dominated) solutions in the criteria space (Figure 2), the follow-on application of the classical aspatial strategic decision model in CDP (Figure 3) was used to extend the analysis to compare the performance of six alternative Pareto solutions with respect to provisioning ecosystem services (Figure 4). Although the CDP model in our study was relatively small and simple, being limited to consideration of a few provisioning services, the approach is readily extendible to more complex models that also consider supporting, cultural, and regulating services.
In this study, for demonstration purposes, the CDP and NetWeaver analyses were each conducted with a single model. More realistically, the present work could be extended to account for different weighting preferences among stakeholder groups. For example, Delphi methods could be used in conjunction with the CDP model structure to distinguish weighting preferences among a few to several stakeholder groups. With the groups being identified, the landscape of the whole study area could be partitioned according to the stakeholder groups and customized analyses run for each stakeholder group. It might also be of interest to the full group of all landowners in the association to reassemble the separate maps of outcomes from NetWeaver into a single composite map. This is easy to do in EMDS.
Finally, this study demonstrated the collaborative application of the SADfLOR and EMDS systems, but this collaboration required a modest amount of human intervention in terms of moving data between the systems, so an interesting question to pose is, “Is it feasible to automate the interoperability of the two systems?” The answer is a qualified yes. The EMDS system was re-architected between 2012 and 2015, and is now built on the Microsoft Windows Workflow Foundation (Chappell, 2009). As a result, it is now relatively easy to integrate new analytical components into EMDS, albeit with a moderate amount of coding still required. For example, two new analytical engines were added into the EMDS architecture in the past year to support Bayesian network processing and Prolog-based decision trees. However, in the next year or two, EMDS will also integrate an open source workflow editor such as Trident ([28]) that will greatly simplify the task of integrating third party analytical components into its architecture ([29]). It is probably fair to say that open architecture DSS supported by workflow engines that simplify extensibility of DSS are the way of the future in continuing DSS development for environmental analysis and planning.
Supplementary Materials: Large-format images of Figures 6A to 6F.
Conceptualization, Marco Marto and Keith Reynolds; Methodology, Marco Marto, Keith Reynolds and José Borges; Software, Marco Marto, Keith Reynolds and Vladimir Bushenkov; Validation, Marco Marto, Keith Reynolds and Susete Marques; Investigation, Marco Marto; Resources, Marco Marto, Vladimir Bushenkov and Susete Marques.; Writing-Review & Editing, Marco Marto, Keith Reynolds and José Borges.
Funding: This research has received funding from the European Union’s Horizon 2020 research and innovation programme (grant agreement No. 676754) (ALTERFOR), from the Marie Skodowska-Curie Research and Innovation Staff Exchange (RISE) within the H2020 work programme (H2020-MSCA-RISE-2015), project Models and decision Support tools for integrated Forest policy development under global change and associated Risk and Uncertainty (SUFORUN)), which specifically funded the collaboration of the authors, and by project LISBOA-01-0145-FEDER-030391 with the title ‘Forest ecosystem management decision-making methods - an integrated bio-economic approach to sustainability' (BIOECOSYS). The authors would like to thank the Portuguese Science Foundation for funding through the Forest Research Center Project UID/AGR/00239/2013 as well as the Post Doc grant of Susete Marques SFRH/BPD/96806/2013 and the Ph.D grant of Marco Marto SFRH/BD/108225/2015.
This project has received funding from the European Union’s Horizon 2020 research and innovation programme under grant agreement No 676754.
Disclaimer: Responsibility for the information and views set out in this article/publication lies entirely with the authors. The use of trade or firm names in this publication is for reader information and does not imply endorsement by the U.S. Department of Agriculture of any product or service.
Conflicts of Interest: The authors declare no conflict of interest. References
1. Marques, A. F., Borges, J. G., Sousa, P., & Pinho, A. M. (2011). An enterprise architecture approach to forest management support systems design: an application to pulpwood supply management in Portugal. European Journal of Forest Research, 130(6), 935–948. DOI: http://dx.doi.org/10.1007/s10342-011-0482-8
2. Reynolds, K. M. (Ed.). (2007). Sustainable forestry: from monitoring and modelling to knowledge management and policy science. CABI.
3. Fedra, K., & Reitsma, R. F. (1990). Decision support and geographical information systems. In Geographical information systems for urban and regional planning (pp. 177-188). Springer, Dordrecht. 4. Reynolds, K. M. (1999). EMDS users guide (version 2.0): knowledge-based decision support for ecological assessment (Vol. 470). US Department of Agriculture, Forest Service, Pacific Northwest Research Station.
5. Reynolds, K. M., Johnson, K. N., & Gordon, S. N. (2003). The science/policy interface in logic-based evaluation of forest ecosystem sustainability. Forest Policy and Economics, 5(4), 433-446. DOI: https://doi.org/10.1016/S1389-9341(03)00041-8
6. Reynolds, K. M., Hessburg, P. F., & Bourgeron, P. S. (2014). Making transparent environmental management decisions. Berlin and Heidelberg: Springer. DOI: https://doi.org/10.1007/978-3-642-32000-2
7. Reynolds, K. M., Paplanus, S., Miller, B., & Murphy., P. (2015). Design features behind success of the Ecosystem Management Decision Support System and future development. Forests. 6:27-46 DOI: https://doi.org/10.3390/f6010027
8. Miller, B. J., & Saunders, M. C. (2002). The NetWeaver reference manual. Pennsylvania State University, College Park, PA.
9. Chen, C. (2010). Information visualization. Wiley Interdisciplinary Reviews: Computational Statistics, 2(4), 387-403. DOI: https://doi.org/10.1002/wics.89
10. Saaty, T. L. (1994). How to make a decision: the analytic hierarchy process. Interfaces, 24(6), 19-43. 11. Kamenetzky, R. D. (1982). The relationship between the analytic hierarchy process and the additive
12. Martins, H. and Borges, J. G. (2007). Addressing collaborative planning methods and tools in forest management. Forest Ecology and Management 248: 107-118. DOI: https://doi.org/10.1016/j.foreco.2007.02.039
13. Keeney, R. L., & Raiffa, H. (1976). Decision analysis with multiple conflicting objectives. Wiley& Sons, New York.
14. Borges, J. G., Falcao, A. O., Miragaia, C., Marques, P., & Marques, M. (2003). A decision support system for forest ecosystem management in Portugal. In Systems Analysis in Forest Resources (pp. 155-163). Springer, Dordrecht. DOI: https://doi.org/10.1007/978-94-017-0307-9_17
15. Falcão, A. and Borges, J. G. (2005). Designing decision support tools for Mediterranean forest ecosystems management: a case study in Portugal. Annals of Forest Science 62: 751-760. DOI: https://doi.org/10.1051/forest:2005061
16. Garcia-Gonzalo, J., Borges, J. G., Palma, J. H. N., & Zubizarreta-Gerendiain, A. (2014). A decision support system for management planning of Eucalyptus plantations facing climate change. Annals of forest science, 71(2), 187-199. DOI: https://doi.org/10.1007/s13595-013-0337-1
17. Borges, J. G., Marques, S., Garcia-Gonzalo, J., Rahman, A. U., Bushenkov, V., Sottomayor, M., Carvalho, P. O., Nordström, E. M. (2017). A multiple criteria approach for negotiating ecosystem services supply targets and forest owners' programs. Forest Science, 63(1), 49-61. DOI: http://dx.doi.org/10.5849/FS.2016-035
18. Reynolds, K.M. (2001). Using a logic framework to assess forest ecosystem sustainability. Journal of Forestry 99:26-30
19. Reynolds, K.M. (2005). Integrated decision support for sustainable forest management in the United States: fact or fiction? Computers and Electronics in Agriculture 49:6-23
20. Reynolds, K.M., Twery, M., Lexer, M. J., Vacik, H., Ray, D., Shao, G. & Borges, J. G. (2008). Decision support systems in forest management. In: F. Burstein and C. Holsapple (Ed.) Handbook on Decision Support Systems. Springer, International Handbooks on Information Systems Series. Handbook on Decision Support System 2: 499-534. DOI: https://doi.org/10.1007/978-3-540-48716-6_24
21. Borges, J. G., Garcia-Gonzalo, J., Bushenkov, V., McDill, M. E., Marques, S., & Oliveira, M. M. (2014). Addressing multicriteria forest management with Pareto frontier methods: an application in Portugal. Forest Science, 60(1), 63-72. DOI: https://doi.org/10.5849/forsci.12-100
22. Garcia-Gonzalo, J., Bushenkov, V. A., McDill, M. E. and Borges, J. G. (2015) A decision support system for assessing trade-offs between ecosystem management goals. An application in Portugal. Forests 6: 65-87. DOI: https://doi.org/10.3390/f6010065
23. Reynolds, K.M. (2002). Landscape evaluation and planning with EMDS 3.0. 2002 ESRI User Conference. San Diego, CA. July 9–12, 2002. Redlands, CA: Environmental Systems Research Institute. 24. Saaty, T. L. (1992). The decision maker for leaders.
25. Marques, S., Marto, M., Bushenkov, V., McDill, M., & Borges, J. (2017). Addressing wildfire risk in forest management planning with multiple criteria decision making methods. Sustainability, 9(2), 298. DOI: https://doi.org/10.3390/su9020298
26. Lotov, A., Bushenkov, V. A., & Kamenev, G. K. (2013). Interactive decision maps: Approximation and visualization of Pareto frontier (Vol. 89). Springer Science & Business Media.
27. Chappell, D. (2009). The workflow way: understanding windows workflow foundation. http://msdn.microsoft.com/en-us/library/dd851337.aspx. Last accessed on 13 April 2018.
28. Trident Team (2011). Project trident: a scientific workflow workbench. http://tridentworkflow. codeplex.com/. Last accessed on 13 April 2018.