For Peer Review
Jet Flow over ForedunesJournal: Earth Surface Processes and Landforms
Manuscript ID ESP-15-0316.R2
Wiley - Manuscript type: Paper
Date Submitted by the Author: 04-Feb-2016
Complete List of Authors: Hesp, Patrick; Flinders University, Environment
Smyth, Thomas; Flinders University, School of the Environment
Keywords: jet, foredune, computational fluid dynamic model, flow dynamics
For Peer Review
Jet Flow over Foredunes
Patrick A. Hesp and Thomas A.G. Smyth
Beach and Dune Systems (BEADS) Laboratory, School of the Environment,
Faculty of Science and Engineering, Flinders University, Bedford Park, South Australia 5042 [email protected]; [email protected]
Key Points
• Jet flow over a foredune is examined for a range of wind speeds/directions. • Jets develop regardless of wind speed, best developed for perpendicular winds. • Surface roughness affects jet development
Abstract
Jet flows, which are localized flows exhibiting a high speed maxima, are relatively common
in nature, and in many devices. They have only been occasionally observed on dunes, and
their dynamics are poorly known. This paper examines computational fluid dynamic (CFD)
2D modelling of jet flow over a foredune topography. Flow was simulated in 10° increments from onshore (0°) to highly oblique alongshore (70°) incident wind approach angles. CFD modelling reveals that the formation of a jet is not dependent on a critical wind speed, and an
increase in incident wind velocity does not affect the magnitude of jet flow. A jet is first
formed at ~1.0m seawards of the foredune crest on the Prince Edward Island foredune
morphology example examined here. A jet is not developed when the incident wind is from
an oblique approach angle greater than ~50° because there is significantly less flow acceleration across a much lower slope at this incident angle. The presence of a scarp does
influence the structure of the crest jet, in that the jet is more pronounced where a scarp is
present. Surface roughness affects the magnitude of jet expansion and jets are better
developed on bare surfaces compared to vegetated ones.
Keywords: Foredune, jet, jet flow, computational fluid dynamics (CFD), flow dynamics; .
1. Introduction
Jet flows are relatively common in nature, and in many devices. A jet is a localized flow 3
For Peer Review
that a jet has a well-defined ‘nose’ in the velocity profile (Wei et al., 2013; see e.g.
http://www.eng.fsu.edu/~shih/succeed/jet/jet.htm). Jets may be formed where fluids are
compressed and ejected from nozzles, pipes, taps, engines, exhausts (often as buoyant
plumes) and similar objects or devices (Schlichting, 1955; Birkhoff and Zarontonello, 1957;
Cala et al., 2006). One classic commonly cited example is the flow from a household tap. Jets
are found, or occur in the atmosphere, for example, as low level jets during certain wind
conditions (e.g. Kraus et al., 1985; Brook, 1985), as coastal phenomena associated with
temperature gradients (e.g. Parish, 2000), in wakes behind bluff bodies (Bickley, 1939;
Mattingly and Criminale, 1972), in various marine animals such as sponges and mollusks
(Vogel, 1996), in tidal flows (e.g. Joshi, 1982), in river mouths and streams (e.g.
Abramovich, 1963; Wright, 1977, Allen, 1982; Rowland et al., 2009), over stones in streams
(Moth Iversen et al., 1989), in rip currents (e.g. Sonu, 1972, fig 9; Haller and Dalrymple,
2001), over steep slopes, scarps and cliff tops (Bowen and Lindley, 1977; Liu et al., 1999),
and collimated jets are an important ingredient in the formation of stars (Bacciotti et al.,
2003). Brook (1985) stated that “there are many types, their only common factor being a
well-marked maximum in the boundary-layer wind speed profile” (Brook, 1985, p. 133).
In the near-surface terrestrial coastal zone, there have been only a few observations or studies
of jets within incident flows in blowouts (Hesp and Hyde, 1996) and over dunes and ridges.
Hsu (1977) measured the existence of a jet just above the surface over the crest of an ice
ridge, and produced a general model indicating jet flow over similarly shaped dunes and ice
ridges. Arens (1996), Arens et al. (1995), Petersen et al., (2011), and Hesp et al. (2013) have
shown that under certain conditions jets occur on, or near the crests of scarps and foredunes.
These studies demonstrate that sand may be transported across scarps and dune crests due to
these locally accelerated flows (termed ‘jettation’ by Arens, (1996) for the suspended sand
transport component; cf. Petersen et al., (2011)). The occurrence of jets may be related to
incident wind speed, and/or incident wind direction, since in both the Arens (1996) and Hesp
et al. (2013) studies, jets only appeared once the incident wind speeds had increased above a
certain velocity, or approached from a certain wind direction.
In the aeolian/desert literature, jets have been shown to occur near or at the crests of various
dune types, particularly transverse and barchan dunes, (although in some cases jets are
observable in the velocity profiles but not discussed). Both Lancaster et al. (1996) and
Omidyeganeh et al. (2013) have jets in some of their velocity profiles over terrestrial and
subaqueous barchans respectively. Burkinshaw et al. (1993) encountered marked jets on
http://mc.manuscriptcentral.com/esp 3
For Peer Review
occasions at 20-50cm high above the surface at the crest of a 7m high transverse dune.
Walker and Shugar (2013, their figure 5a) appear to have a jet present in their dune crest
velocity profile for a crest transverse flow. Jets have also been observed over small to large
subaqueous dunes (e.g. Bridge and Best, 1988; van der Knaap et al., 1990; Bennett and Best,
1995; Kostaschuk and Villard, 1996).
Since jets are a specific, defined component of the flow field or regime, and may be critical to
understanding the general flow behaviour over dunes and other topographies, it is important
to recognise these phenomena as a distinct flow region, separate from other components of
the flow (e.g. a speed-up region). It is critical to understand jet generation and behaviour
over dunes since they may be prevalent more commonly than indicated by the few studies
which encountered jets occurring over dunes, and they may be essential in assisting sediment
transport up stoss slopes and/or generating onshore or offshore sediment transport downwind
of the dune crest (Petersen et al., 2011; Hesp et al., 2013; Bauer et al., 2015). The same jets
may be responsible for lifting and/or transporting sediment across vegetation canopies (Hesp
et al., 2013), and perhaps in accelerating disturbance events (Hesp and Martinez, 2007). In
addition, some models of wind flow over dunes do not consider or generate jets in their
development (e.g. Van Boxel et al., 1999).
In the following, we model the development of jets over a foredune topographic profile from
Prince Edward Island, Canada, (where jets have been recorded; see Hesp et al., 2009, 2013)
via computational fluid dynamic (CFD) modelling, and then examine five principal questions
regarding jets over foredunes:
1. Where and when does a jet form?
2. How does it change with incident flow speed?
3. How does it change with incident wind direction/slope?
4. How does it change over a scarped versus a non-scarped dune?
5. How is it affected by a change in surface roughness?
2. Methods
2.1Dune Topography
For Peer Review
al, 2009, 2013, Chapman et al, 2013; Walker et al., 2006, 2009; Bauer et al., 2012, 2015;
Delgado-Fernandez and Davidson-Arnott, 2011).
The foredune crest is ~8 to 9 m above mean water level with a steep stoss slope (20°-25°) and an ENE-WSW crestline orientation. A low-gradient, microtidal (~1 m tidal range), moderate to high energy intermediate beach with a low-tide width of about 35 m is present on the seaward side of the dune. At the time of survey the foredune displayed a non-vegetated, 0.7 m high scarp, which later filled in with sand following a significant wind storm (see figure 6 in Hesp et al., 2009). The dune was vegetated by Ammophila breviligulata, with plant heights averaging 0.3 m and spatial density ranging from 2 – 45% based on visual assessments of percent cover on contiguous transects. The digital elevation model used to produce the dune surface within the computational domain was generated from 3666 RTK-DGPS points collected in a 100 m x 150 m area on the foredune at PEI.
Fig 1 here
2.2 Computational Fluid Dynamics (CFD) Methodology
Wind flow over the dune surface was simulated using computational fluid dynamics (CFD) CFD is a numerical method of solving fluid flow using the Navier-Stokes equations and has been successfully used to simulate flow over a number of coastal dune landforms (Wakes, 2013; Wakes et al., 2010; Smyth et al., 2012; 2013; Hesp et al., 2014; Jackson et al., 2011). The Navier-Stokes equations can also be solved linearly over dunes (Walmsley and Howard, 1985), with less computational cost than CFD, however this method is only appropriate where the windward slope is small and the wind flow not affected by near surface jets or flow separation. Wippermann and Gross (1985), also numerically modelled over a barchan dune using the mesoscale meteorological model, FITNAH (Flow over Irregular Terrain with Natural and Anthropogenic Heat Sources). FITNAH is however limited by its finest cell resolution of 2 m.). Simulations in this study were performed using the open source software OpenFOAM, which is capable of solving a range of complex fluid flows and also includes tools for meshing the surface topography and visualising the results. In this case, wind over the dune was calculated as an incompressible flow using a steady state solver, simpleFoam. Turbulence was modelled using the Renormalised group (RNG) κ-epsilon method (Yakhot et al., 1992). This is a turbulence model based on the Reynolds-averaged Navier-Stokes
(RANS) equations, which focuses on the effects of turbulence on the average flow rather than resolving turbulence at every scale, as with direct numerical simulation (DNS) or at the larger scale such as a large eddy simulation (LES). The RNG model has been used to accurately simulate near surface flows over a transverse dune in a wind tunnel (Parsons et al., 2004), coastal dune complex (Wakes et al., 2010), a complex foredune blowout (Smyth et al., 2012; 2013), and flow over a foredune (Hesp et al., 2015). Joubert et al., (2012) also found that the original κ-epsilon turbulence model reproduced three-dimensional near surface patterns around a linear desert dune.
http://mc.manuscriptcentral.com/esp 3
For Peer Review
All simulations in this study were performed in two-dimensions. This approach was used
because in three-dimensions, accurate representation of the change in the slope at the crest of
the foredune in the mesh proved problematic as it became overly smoothed. In the
two-dimensional simulations any change in slope was accurately recreated in the mesh using a
polyline. Ideally flow modelling over the foredune would occur in three dimensions as wind
is elliptic in nature as demonstrated by Hesp et al. (2015) who confirmed that incident winds
which approach obliquely to the dune toe are deflected toward a more crest-normal
orientation across the stoss slope of the foredune.
A mesh independence test was performed by calculating wind flow over 3 meshes of 0.5 m,
0.375 m and 0.25 m resolution. Between each case, wind flow at 30 points between 0.1 m
and 3 m above the crest of the foredune changed by <1%. Due to the increased resolution of
data points, the 0.25 m horizontal resolution mesh was employed for this study. The
horizontal extent of each mesh ranged from 156 m for the 0° transect to 199 m for the 70°
transect. In all cases the horizontal resolution of the mesh was 0.25 m and the vertical
resolution progressed from 0.1 m at the surface to 1.63 m at the upper boundary located 64 m
above the beach surface. Vertical cell size resolution of the mesh was restricted by the
maximum dune surface roughness height () of 0.05 m. Each simulation was deemed
complete when the residuals for each variable being solved (velocity, pressure, turbulent
kinetic energy and energy dissipation) decreased by 4 orders of magnitude.
2.2.1 Computational Boundary conditions
In each simulation vertical profiles of wind speed (), turbulent kinetic energy () and energy dissipation () at the inlet boundary were defined assuming a constant shear velocity (∗) value with height using equations 1, 2 and 3 (Richards and Hoxey, 1993 and Blocken et al., 2006):
= ∗ ln
(1)
= ∗
(2)
= ∗
(3)
For Peer Review
To examine how flow dynamics changed with wind speed, simulations were conducted using 4 values of ∗ ranging from a minimum of 0.24 m s-1 to 0.60 m s-1 (Table 1). For each
simulation a surface surrounding the dune was prescribed a surface roughness constant () of 0.0005 m, the equivalent of a sand surface (Bagnold, 1960). To test how jet dynamics change with roughness height, the foredune was prescribed roughness heights equivalent to that of bare sand ( 0.0005 m (Bagnold, 1954)), Ammophila breviligulata ( 0.01 m (Olson, 1958)), and thin grass 0.5 m high ( 0.05 m (Sutton, 1953)).
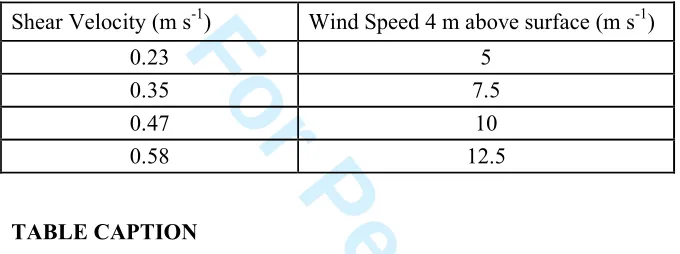
Table 1 here. Shear velocities (m s-1) and equivalent wind speeds (m s-1) at 1 m above the surface at the inlet of the computational domain for each simulation assuming a of 0.0005
m..
TABLE 1 HERE
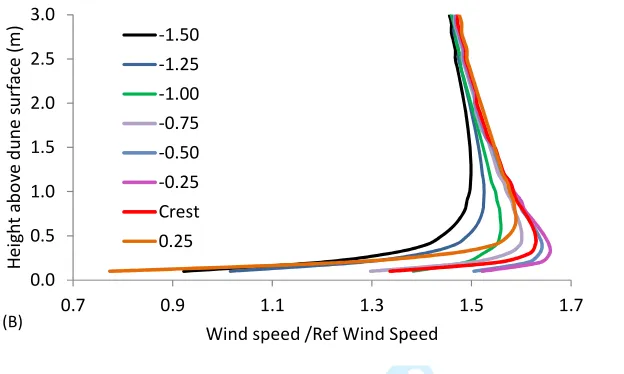
3. Location of the Jet Formation
Because it is often the case that there are not enough instrumented masts in the field to
adequately cover a foredune, it cannot be determined exactly where on the stoss face or
near-crest region the jet flow is first formed. Thus, the CFD model was utilized to examine where
the jet first forms on the foredune. Figure 2 illustrates seven locations across the upper stoss,
crest and lee slope where velocity profiles were modelled in order to examine the first point
of jet formation, and its downwind extension past the crest (if it occurs).
fig 2 here
In order to assess this, the wind velocity profiles were modelled at intervals of 0.25m across
the P.E.I. foredune from upper stoss position over the crest, and down the lee slope to
determine where the jet flow structure was initiated (Figure 2a). The transect utilized was the
scarped profile, and a roughness height equivalent to Ammophila breviligulata (z0 0.01 m)
was applied to the foredune slope. Figure 2b demonstrates that the flow progressively
accelerates up the stoss slope as observed in many similar dune and ridge studies (e.g. Arens
et al., 1995; Finnigan, 2007; Walker et al., 2006, 2009; Bauer et al., 2013; Hesp et al., 2009,
2015). While there is some slight indication of jet formation at -1.5m, a clear jet is formed at
1.0m seawards of the crest. The flow becomes better defined as a more pronounced speed
bulge (or nose) develops at around 50cm above the bed at -0.75 to -0.5mupslope, and is most
pronounced at -0.25m seawards or downslope of the crest (Figure 2b). Note that the crest is
itself quite convex and rounded (Figure 2a). The jet shifts upwards ( to around 0.75m above
the surface) and becomes more bulbous in the profile at 0.25m past the crest. It is likely that
http://mc.manuscriptcentral.com/esp 3
For Peer Review
the very top of the crest is the point at which lee flow separation begins, and as this develops,
the higher speed jet component of the flow is forced upwards over the separation envelope as
observed in other studies (cf. Hsu, 1977). In addition, the flow tends to sweep upwards across
the crest directed by the steep angle of the stoss slope, so the jet will tend to move upwards in
the profile as it crosses the dune crest. Flow velocities are low near the surface in the lee of
the dune crest due to flow separation development in this region.
The wind velocity profile with embedded jet at the dune crest displays a similar structure to
that encountered in the field at P.E.I. (Hesp et al., 2009, 2013), and provides partial validation
of the modelling. The vertical height above the bed at which the jet is most pronounced (the
apex of the nose) in the modelling is lower by approximately 50cm (at the crest) to 25cm
(just downwind of the crest) than that encountered in the field. This is likely due to the
presence of vegetation in the field, whereas there is no vegetation present on the modelled
surface.
4. Jet Structure and Incident Wind Speed
As noted in the introduction, observations of jets formed during different incident wind
speeds have been made (e.g. Hsu, 1977; Arens et al., 1995; Hesp et al., 2009, 2013), but it is
unclear if variations in incident wind speed actually produce changes in the jet formation or
shape. Figure 3 shows wind velocity profiles simulated via CFD for four quite different
incident wind velocities (5 m s-1 to 12.5m s-1 at 4m above the surface on the beach) for a
directly onshore flow.
Fig 3 here
Jet flow was produced at the foredune crest for all four wind speeds tested (Figure 3) thereby
indicating that once the flow velocity is above the threshold for sand transport, wind speed is
not a factor determining whether a jet is present or not. Whilst it superficially appears as if
the jet becomes more pronounced as wind speed increases (as in Hesp et al., 2013, their
Figure 6)), when the results are made relative to the incident wind speed on the beach (at 4m
height), all the four percent velocity profiles in Figure 3 virtually overlap, and there is only a
very slight difference apparent indicating that incident wind speed has minimal effect on jet
development. 3
For Peer Review
Field observations of jets (e.g. Hesp et al., 2013) indicates that the jets vary according to
incident wind direction. In order to test the influence of incident wind direction on jet
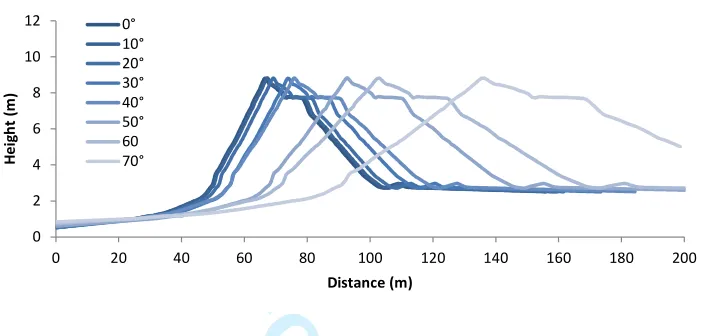
development, a range of incident wind approach angles from 10° to 70° (almost perpendicular to almost dune crest parallel) were examined via the CFD model (Figure 4). Figure 1
illustrates the 2-D topographic profiles for the range of incident winds modelled. These show
the relative slopes that the incident wind would encounter or “see” as it crosses the dune.
Note how the slopes flatten considerably and elongate as the incident wind flow becomes
increasingly oblique to the dune crest.
Fig 4 here
The incident wind angle/stoss slope has a significant impact on the production of a jet at the
crest. As the incident angle becomes more oblique, making the slope less steep, the jet
becomes slower and less defined until it is not discernable past 50° incident wind approach angle (Figure 4). In the field Hesp et al. (2013) found that a jet did not develop when the
incident wind was from an angle >55°.
In three dimensions, the flow is topographically steered before reaching the dune crest
(Walker et al., 2006; Hesp et al., 2015).This may cause the jet to form at more oblique
incident angles than has been found here.
The jet is also more pronounced (i.e. more defined nose) in the vertical profile during winds
that are perpendicular to the crest, likely because the stoss slope is steepest for these incident
winds, and perhaps because of the presence of a more defined separation zone, which starts to
limit the near surface wind speed near or at the crest.
Wind speed at the crest also decreases as incident wind direction becomes more oblique (cf.
Walker et al., 2009; Hesp et al., 2015). The degree and magnitude of jet development for
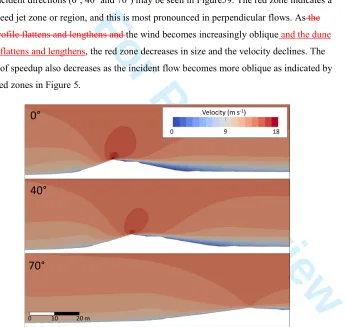
three incident directions (0°, 40° and 70°) may be seen in Figure59. The red zone indicates a high speed jet zone or region, and this is most pronounced in perpendicular flows. As the
wind becomes increasingly oblique and the dune profile flattens and lengthens, the red zone
decreases in size and the velocity declines. The degree of speedup also decreases as the
incident flow becomes more oblique as indicated by the speed zones in Figure 5.
Fig 5 here
http://mc.manuscriptcentral.com/esp 3
For Peer Review
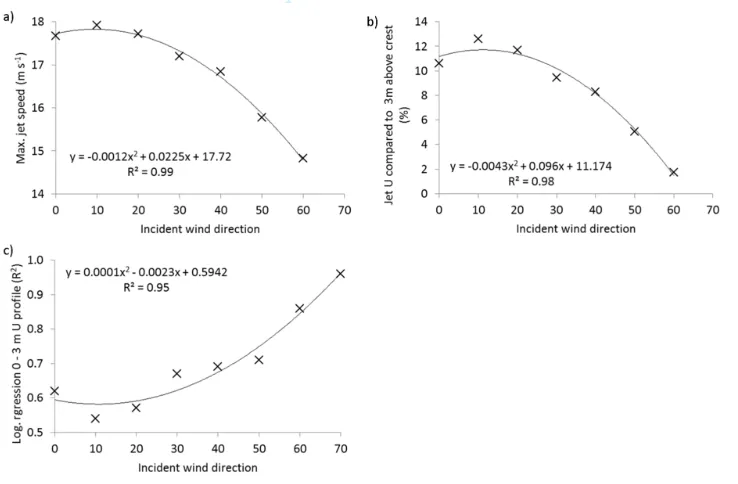
Figure 6 displays the maximum jet velocity developed at the foredune crest for each incident
wind direction (Figure 6a), and the percent jet velocity relative to winds at 3m above the dune
crest (Figure 6b). Figure 6c illustrates the log regressions of the vertical profiles of wind
velocity up to 3 m height, and shows that as the incident wind becomes more oblique, the
profile becomes more logarithmic. There are clear relationships between these such that the
maximum jet speed declines as the incident wind direction becomes more oblique to highly
oblique, relative jet velocities are highest compared to flow at 3 m above the foredune crest
for directly onshore flow, and the velocity profiles progressively deviate from logarithmic as
the incident flow becomes less oblique. The latter has clear implications for those wishing to
determine shear stress at the bed from velocity profiles where jets are present. All plots have
very high R2 values.
Fig 6 here
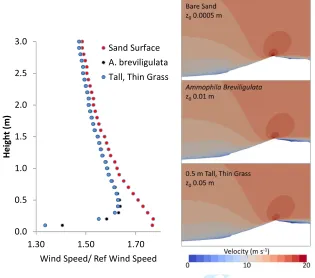
6. Jet development for varying surface roughness
Figure 7 displays jet development for three surface roughness lengths based on data provided
by Maun (2009) and for the same incident onshore wind velocity. It is apparent that the
greatest jet development occurs for a bare sand surface with a very low roughness, and
decreases with the presence of vegetation. There is less near surface turbulence and less drag
where the surface is smooth (z0 is close to zero in Figure 7), and therefore a greater degree of
near surface flow acceleration upslope. However, there is little difference between a cover of
Ammophilabreviligulata and tall thin grass (as defined by Maun, 2009).
Fig 7 here
7. Scarped versus non-scarped foredune topography and jet development
Scarps are very commonly formed on foredunes since they occupy the seaward most position
on the backshore (Carter et al., 1990; Hesp, 2002; Christiansen and Davidson-Arnott, 2004).
In the discussion above, the CFD modelling (and previous field work) was conducted over
the P.E.I. foredune which exhibited a small 0.7m high scarp. Since it is also common for jets
to be formed over the crest of such scarps (Bowen and Lindley, 1977; Hesp et al., 2013), the 3
For Peer Review
and the same profile minus the scarp in order to determine if the scarp has a downwind effect
on flow near the crest. Figure 8 demonstrates that the presence of the 0.7m high scarp does
indeed influence the structure of the crest jet, in that the jet is more pronounced where the
scarp is present. The highest velocities are also slightly closer to the bed. This may occur due
to the scarp jet shedding higher velocity and more turbulent eddies downwind up the
foredune stoss face compared to the situation where the scarp is not present.
Fig 8 here
The presence of the scarp at the dune toe leads to slightly greater development of the jet on
the foredune ridge crest. The pressure fields were also examined for this comparison and
show that (i) the high pressure zone which develops over the scarp region does not extend as
far downwind across the foredune lower stoss slope compared to the non-scarped foredune,
and, (ii) the low pressure zone over the dune crest is much higher (25%) for the scarped dune
compared to the non-scarped dune.
8. Conclusions
The following conclusions can be derived from this study:
1. CFD modelling has successfully replicated jet flow development at a foredune crest region;
2. an increase in incident wind velocity does not affect the magnitude of jet flow;
3. a jet is first formed at ~1.0 m seawards of the foredune crest on the Prince Edward Island
foredune morphology example examined here. The flow becomes better defined as a
more pronounced nose develops at around 50 cm above the bed seawards of the crest,
and is best developed at 0.25 m seawards of the dune crest. The jet shifts upwards and
becomes slightly more bulbous in the profile just landwards or past the foredune crest
and then disappears;
4. the jet is most pronounced and has the greatest aerial extent when winds are perpendicular
to the foredune crest;
http://mc.manuscriptcentral.com/esp 3
For Peer Review
5. in the CFD modelling a jet did not develop a few degrees after an incident wind approach
angle of 50°because there is significantly less flow acceleration across a much lower slope at an incident wind greater than ~55°;
6. the jet is higher in the vertical profile during winds that are more perpendicular to the dune
crest in the 0° to 30° range of incident winds;
7. the degree of surface roughness influences the degree of jet development such that jets
are better developed when the surface is bare compared to when vegetation is present;
8. the presence of a scarp at the dune toe does slightly influence the structure of the crest jet,
in that the jet is more pronounced where a scarp is present.
9. jets are probably more common over dunes and similar topographies than believed or
found due to (i) post data collection smoothing of velocity profiles (cf. Frank and
Kocurek, 1996), or (ii) the fact that many field based wind profiling experiments do not
have enough instruments stacked at closely spaced heights above the surface to be able
to detect their presence.
Future research aims to examine the relationships between foredune morphology (particularly
height and stoss slope gradient) and jet development, the nature of jet breakdown or
dispersion, the nature of secondary circulation and instabilities in jets (see e.g. Ruith et al
2003; Cala et al 2006), and the dynamics and relationships between jet flow and reversing
vortices within flow separation envelopes at, and past the foredune crest.
Acknowledgements
The authors thank the School of the Environment and Faculty of Science and Engineering,
Flinders University for equipment grants to P. H. and post-doctoral funding to T.S., and
support, the Flinders University supercomputer facility, the P.E.I. crew Robin, Ian, Bernie
and Jeff, a grant (1024125) from NSF to P. Hesp, and Ӕolus for his continued ministry. The
data in this paper are available by contacting the corresponding author.
References
Abramovich, G. N. (1963), Theory of Turbulent Jets, MIT Press, Cambridge.
Allen, J. R. L. (1982), Sedimentation from jets and separated flows, in Sedimentary 3
For Peer Review
Arens, S. M. (1996), Patterns of sand transport on vegetated foredunes, Geomorphology, 17, 339–350.
Arens, S. M., H. M. E. Van Kaam-Peters, and J. H. Van Boxel (1995), Air flow over
foredunes and implications for sand transport, Earth Surface Processes and Landforms, 20(4), 315–332, doi:10.1002/esp.3290200403.
Bacciotti, F., T. P. Ray, J. Eisloffel, J. Woitas, J. Solf, R. Mundt, and C. . Davis (2003), Observations of Jet Diameter, Density and Dynamics, Astrophysics and Space Science, 287, 3–13.
Bauer, B. O., Davidson-Arnott, R.G.D., Walker, I.J., Hesp, P.A., Ollerhead, J., 2012. Wind direction and complex sediment transport response across a beach-dune system, Earth Surface Processes and Landforms, 37(15), 1661–1677, doi:10.1002/esp.3306.
Bauer, B. O., Davidson-Arnott, R.G.D., Hesp, P.A., Namikas, S.L., . Ollerhead, J., Walker, I.J., 2009. Aeolian sediment transport on a beach: Surface moisture, wind fetch, and mean transport, Geomorphology, 105(1-2), 106–116,
doi:10.1016/j.geomorph.2008.02.016.
Bauer, B.O.,Hesp, P.A., Walker, I.J., Davidson-Arnott, R.G.D., 2015. Sediment (dis)continuity across a beach-dune profile during an offshore wind event. Geomorphology 245: 135-148.
Bauer, B. O., I. J. Walker, A. C. W. Baas, D. W. T. Jackson, C. M. Neuman, G. F. S. Wiggs, and P. A. Hesp (2013), Critical Reflections on the Coherent Flow Structures Paradigm in Aeolian Geomorphology, in Coherent Flow Structures at Earth’s Surface, pp. 111–134, John Wiley & Sons, Ltd.
Bennett, S.J., Best, J.L., 1995. Mean flow and turbulence structure over fixed, two-dimensional dunes: implications for sediment transport and bedform stability. Sedimentology 42: 491-513.
Bickley, W. (1939), The Plane Jet, Phil. Mag. Ser., 7, 727–731.
Birkhoff, G., and E. Zarantonello (1957), Jets, Wakes and Cavities, Academic Press, New York.
Blocken, B., T. Stathopoulos, and J. Carmeliet (2007), CFD simulation of the atmospheric boundary layer : wall function problems, Atmospheric Environment, 41(2), 238–252.
Bowen, A. J., and D. Lindley (1977), A wind-tunnel investigation of the wind speed and turbulence characteristics close to the ground over various enscarpment shapes, Boundary-Layer Meteorology, 12(1977), 259–271.
Bridge, J.S., Best, J.L., 1988. Flow, sediment transport and bedform dynamics over the transition from dunes to upper-stage plane beds: implications for the formation of planar lamination. Sedimentology 35, 753-763.
http://mc.manuscriptcentral.com/esp 3
For Peer Review
Brook, R. A. (1985), The Koorin nocturnal low-level jet, Boundary-Layer Meteorology, 32, 133–154.
Burkinshaw, J.R., Illenberger, W.K., Rust, I.C., 1993. Wind speed profiles over a reversing transverse dune. In: Pye, K. (ed.), The Dynamics and Environmental Context of Aeolian Sedimentary Systems. Geol. Soc. Spec. Publication No. 72: 25-36.
Cala, C. E., E. C. Fernandes, M. V Heitor, and S. I. Shtork (2006), Coherent structures in unsteady swirling jet flow, Experiments in Fluids, 40(2), 267–276, doi:10.1007/s00348-005-0066-9.
Carter, R. W. G. (1988), Coastal Environments. An Introduction to the Physical, Ecological and Cultural Systems of Coastlines, Academic Press, London.
Carter, R. W. G., P. A. Hesp, and K. F. Nordstrom (1990), Geomorphology of erosional dune landscapes, in Coastal Dunes: Processes and Morphology, edited by K. F. Nordstrom, N. Psuty, and R. W. G. Carter, pp. 217–250, John Wiley & Sons, Ltd.
Chapman, C. A., I. J. Walker, P. A. Hesp, B. O. Bauer, and R. G. D. Davidson-Arnott (2011), Turbulent Reynolds stress and quadrant event activity in wind flow over a coastal foredune, Geomorphology, 151-152, 1–12, doi:10.1016/j.geomorph.2011.11.015.
Chapman, C., I. J. Walker, P. a. Hesp, B. O. Bauer, R. G. D. Davidson-Arnott, and J. Ollerhead (2013), Reynolds stress and sand transport over a vegetated foredune, Earth Surface Processes and Landforms, 38(14), 1735–1747, doi:10.1002/esp.3428.
Christiansen, M. B., and R. Davidson-arnott (2004), Rates of Landward Sand Transport over the Foredune at Skallingen , Denmark and the Role of, Danish Journal of Geography, 104(1), 31–43.
Davidson-Arnott, R. G. D., B. O. Bauer, I. J. Walker, P. A. Hesp, and J. Ollerhead (2009), Instantaneous and Mean Aeolian Sediment Transport Rate on Beaches : an
Intercomparison of Measurements from Two Sensor Types, Journal Of Coastal Research Special Issue, (56), 297–301.
Davidson-Arnott, R. G. D., B. O. Bauer, I. J. Walker, P. a. Hesp, J. Ollerhead, and C.
Chapman (2012), High-frequency sediment transport responses on a vegetated foredune, Earth Surface Processes and Landforms, 37(11), 1227–1241, doi:10.1002/esp.3275.
Davidson-arnott, R. G. D., Y. Yang, J. Ollerhead, P. A. Hesp, and I. J. Walker (2008), The effects of surface moisture on aeolian sediment transport threshold and mass flux on a beach, Earth Surface Processes an, 33, 55–74, doi:10.1002/esp.
Delgado-Fernandez, I., and R. Davidson-Arnott (2011), Meso-scale aeolian sediment input to coastal dunes: The nature of aeolian transport events, Geomorphology, 126(1-2), 217– 232, doi:10.1016/j.geomorph.2010.11.005.
For Peer Review
Delgado-Fernandez, I., R. G. D. Davidson-Arnott, B. O. Bauer, I. J. Walker, and J. Ollerhead (2013), Evaluation of the optimal resolution for characterizing the effect of beach surface moisture derived from remote sensing on Aeolian transport and deposition, Journal Of Coastal Research Special Issue, (65), 1277–1282.
Finnigan, J. J. (2007), The turbulent wind in plant and forest canopies, in Plant Disturbance Ecology: The Process and Response, edited by E. A. Johnson and K. Miyanishi, pp. 15– 58, Elsevier, Amsterdam.
Finnigan, J. J., and S. E. Belcher (2004), Flow over a hill covered with a plant canopy, Quarterly Journal of the Royal Meteorological Society, 130(596), 1–29,
doi:10.1256/qj.02.177.
Finnigan, J. J., and Y. Brunet (1995), Turbulent airflow in forests on flat and hilly terrain, in Wind and Trees, edited by M. P. Coutts and J. Grace, pp. 3–40, Cambridge University Press, Cambridge UK.
Frank A.J., Kocurek G. 1996. Airflow up the stoss slope of sand dunes: limitations of current understanding. Geomorphology 17: 47-54.
Haller, M. C., and R. A. Dalrymple (2001), Rip current instabilities, J. Fluid Mech., 433, 161–192.
Hesp, P.A. (2002), Foredunes and blowouts: initiation, geomorphology and dynamics, Geomorphology, 48(1-3), 245–268, doi:10.1016/S0169-555X(02)00184-8.
Hesp, P. A., and I. J. Walker (2011), Three-dimensional æolian dynamics within a bowl blowout during offshore winds: Greenwich Dunes, Prince Edward Island, Canada, Aeolian Research, 3, 389–399, doi:10.1016/j.aeolia.2011.09.002.
Hesp, P. A., and M. Martinez (2007), Disturbance in coastal dune ecosystems, in Plant Disturbance Ecology: The Process and Response, edited by E. A. Johnson and K. Miyanishi, pp. 215–247, Elsevier, Amsterdam.
Hesp, P. A., and R. Hyde (1996), Flow dynamics and geomorphology of a trough blowout, Sedimentology, 43, 505–525.
Hesp, P. A., I. J. Walker, C. Chapman, R. Davidson-Arnott, and B. O. Bauer (2013), Aeolian dynamics over a coastal foredune, Prince Edward Island, Canada, Earth Surface
Processes and Landforms, 38(1), 1566–1575, doi:10.1002/esp.3444.
Hesp, P. A., I. J. Walker, S. L. Namikas, B. O. Bauer, J. Ollerhead, and M. Allison (2009), Storm Wind Flow over a Foredune , Prince Edward Island , Canada, Journal of Coastal Research, (SI 56), 312–316.
Hesp, P. A., R. Davidson-Arnott, I. J. Walker, and J. Ollerhead (2005), Flow dynamics over a foredune at Prince Edward Island, Canada, Geomorphology, 65(1-2), 71–84,
doi:10.1016/j.geomorph.2004.08.001.
http://mc.manuscriptcentral.com/esp 3
For Peer Review
Hesp, P. A., T. A. G. Smyth, P. Nielsen, I. J. Walker, B. O. Bauer, and R. Davidson-Arnott (2015), Flow deflection over a foredune, Geomorphology, 230(0), 64–74,
doi:http://dx.doi.org/10.1016/j.geomorph.2014.11.005.
Hsu, S. A. (1977), Boundary-layer Meteorological research in the coastal zone, Geoscience and Man, XVIII, 99–111.
Jackson, D. W. T., Beyers, J.H.M., Lynch, K., Cooper, J. A. G., Baas, A. C.W., Delgado-Fernandez, I., 2011. Investigation of three-dimensional wind flow behaviour over coastal dune morphology under offshore winds using computational fluid dynamics (CFD) and ultrasonic anemometry. Earth Surface Processes and Landforms 36, 1113– 1124. doi:10.1002/esp.2139
Joshi, P. B. (1982), Hydromechanics of tidal jets, Journal of the Waterway Port Coastal and Ocean Division, 108(3), 239–253.
Joubert, E.C., Harms, T.M., Muller, A., Hipondoka, M., Henschel, J.R., 2012. A CFD study of wind patterns over a desert dune and the effect on seed dispersion. Environmental Fluid Mechanics 12, 23–44. doi:10.1007/s10652-011-9230-3
Kostaschuk, R., and Villard, P., 1996. Flow and sediment transport over large subaqueous dunes: Fraser River, Canada. Sedimentology 43: 849-863.
Kraus, H., J. Malcher, and E. Schaller (1985), A nocturnal low level jet during PUKK, Boundary-Layer Meteorology, 31(2), 187–195, doi:10.1007/BF00121177.
Lancaster N., Nickling W.G., McKenna Neuman C.K., Wyatt, V.E., 1996. Sediment flux and airflow on the stoss slope of a barchan dune. Geomorphology 17: 55-62.
Mattingly, G. E., and W. O. Criminale (1972), The stability of an incompressible two-dimensional wake, Journal of Fluid Mechanics, 51, 233–272,
doi:10.1017/S0022112072001193.
Maun, M. A. (2009), The Biology of Coastal Sand Dunes, Oxford University Press.
Moth Iversen, T.C., Lindegaard, K., Sand-Jensen, K., Thorup, J., 1989. Vandlobsokologi (Watercourse Ecology), Freshwater-Biological laboratory, Copenhagen University.
Ollerhead, J., R. Davidson-Arnott, I. J. Walker, and S. Mathew (2012), Annual to decadal morphodynamics of the foredune system at Greenwich Dunes, Prince Edward Island, Canada, Earth Surface Processes and Landforms, 38(3), 284–298,
doi:10.1002/esp.3327.
Olson, J.S., 1958. Lake Michigan dune development. 1. Wind-velocity profiles. J. Geology 66: 254-263.
For Peer Review
Parish, T. R. (2000), Forcing of the Summertime Low-Level Jet along the California Coast., Journal of Applied Meteorology, 39(12), 2421–2433.
Parsons, D. R., I. J. Walker, and G. F. S. Wiggs (2004), Numerical modelling of flow
structures over idealized transverse aeolian dunes of varying geometry, Geomorphology, 59(1-4), 149–164, doi:10.1016/j.geomorph.2003.09.012.
Pattanapol, W., S. J. Wakes, M. J. Hilton, and K. J. M. Dickinson (2007), Modeling of Surface Roughness for Flow Over a Complex Vegetated Surface, Proceedings of world academy of science, Engineering and, 26, 273–281.
Petersen, P. S., M. J. Hilton, and S. J. Wakes (2011), Evidence of aeolian sediment transport across an Ammophila arenaria-dominated foredune, Mason Bay, Stewart Island, New Zealand Geographer, 67(3), 174–189, doi:10.1111/j.1745-7939.2011.01210.x.
Rasmussen, K. R. (1989), Some aspects of flow over coastal dunes, Proceedings of the Royal Society of Edinburgh Section B: Biological Sciences, 96, 129–147.
Rowland, J. C., M. T. Stacey, and W. E. Dietrich (2009), Turbulent characteristics of a shallow wall-bounded plane jet: experimental implications for river mouth hydrodynamics. Journal of Fluid Mechanics, 627, 423–449.
Ruith, M. R., P. Chen, E. Meiburg, and T. Maxworthy (2003), Three-dimensional vortex breakdown in swirling jets and wakes: direct numerical simulation, Journal of Fluid Mechanics, 486, 331–378. doi:10.1017/S0022112003004749.
Schlichting, H. (1955), Boundary-layer Theory, 7th 1979 ed., McGraw-Hill, New York.
Smyth, T. A. G., D. W. T. Jackson, and J. A. G. Cooper (2012), Geomorphology High resolution measured and modelled three-dimensional airflow over a coastal bowl blowout, Geomorphology, 177-178, 62–73, doi:10.1016/j.geomorph.2012.07.014.
Smyth, T. A. G., D. W. T. Jackson, and J. A. G. Cooper (2013), Three dimensional airflow patterns within a coastal trough – bowl blowout during fresh breeze to hurricane force winds, Aeolian Research, 9, 111–123.
Sonu, C. J. (1972), Field observation of nearshore circulation and meandering currents, Journal of Geophysical Research, 77(18), 3232–3247, doi:10.1029/JC077i018p03232.
Sutton, O. G. (1953), Micrometeorology: a study of physical processes in the lowest layers of the earth's atmosphere. New York: McGraw-Hill.
Van Boxel, J. H., S. M. Arens, and P. M. Van Dijk (1999), Aeolian processes across
transverse dunes. I: Modelling the air flow, Earth Surface Processes and Landforms, 24, 255–270.
van der Knaap, F.C.M., van Mierlo, M.C.L.M., Officier, M.J., 1991. Measurements and computations of the turbulent flow field above fixed bed-forms. In: Soulsby, R. and Bettess, R., (Eds.), Sand Transport in Rivers, Estuaries and the Sea. Proc. Euromech 262
http://mc.manuscriptcentral.com/esp 3
For Peer Review
Colloquim on sand transport in Rivers, Estuaries and the Sea, Wallingford, 26-29 june, 1990: 179-185. A.A. Balkema, Rotterdam.
Vogel, S. (1996), Life in Moving Fluids. The Physical Biology of Flow, Princeton University Press, New Jersey.
Wakes, S. (2013), Three-dimensional Computational Fluid Dynamic experiments over a complex dune topography, Journal of Coastal Research, (S I65), 1337–1342, doi:10.2112/SI65-226.1.
Wakes, S. J., T. Maegli, K. J. Dickinson, and M. J. Hilton (2010), Numerical modelling of wind flow over a complex topography, Environmental Modelling & Software, 25(2), 237–247, doi:10.1016/j.envsoft.2009.08.003.
Walker, I. J. (2005), Physical and logistical considerations of using ultrasonic anemometers in aeolian sediment transport research, Geomorphology, 68(1-2), 57–76,
doi:10.1016/j.geomorph.2004.09.031.
Walker, I. J., P. A. Hesp, B. O. Bauer, J. Ollerhead, and M. Allison (2009a), Mean Flow and Turbulence Responses in Airflow over Foredunes : New Insights from Recent Research. Journal of Coastal Research, (SI 56), 366–370.
Walker, I. J., P. A. Hesp, R. G. D. Davidson-Arnott, and J. Ollerhead (2006), Topographic Steering of Alongshore Airflow over a Vegetated Foredune: Greenwich Dunes, Prince Edward Island, Canada, Journal of Coastal Research, 22(5), 1278–1291,
doi:10.2112/06A-0010.1.
Walker, I. J., P. A. Hesp, R. G. D. Davidson-Arnott, B. O. Bauer, S. L. Namikas, and J. Ollerhead (2009b), Responses of three-dimensional flow to variations in the angle of incident wind and profile form of dunes: Greenwich Dunes, Prince Edward Island, Canada, Geomorphology, 105 (1-2), 127–138, doi:10.1016/j.geomorph.2007.12.019.
Walker, I. J., & Shugar, D. H. (2013). Secondary flow deflection in the lee of transverse
dunes with implications for dune morphodynamics and migration.Earth Surface
Processes and Landforms, 38(14), 1642-1654.
Walmsley, J.L., Howard, A.D., 1985. Application of a boundary-layer model to flow over an eolian dune. Journal of Geophysical Research 90, 631–640.
Wei, W., B. G. Wu, X. X. Ye, H. X. Wang, and H. S. Zhang (2013), Characteristics and Mechanisms of Low-Level Jets in the Yangtze River Delta of China, Boundary-Layer Meteorology, 149 (3), 403–424, doi:10.1007/s10546-013-9852-8.Wolfe, S. A., and W. G. Nickling (1996), Shear stress partitioning in sparsely vegetated desert canopies, Earth Surface Processes and Landforms, 21, 607–619.
Wipperman, F.K., Gross, G., 1986. The wind-induced shaping and migration of an isolated 3
For Peer Review
Xianwan, L., L. Sen, and S. Jianyou (1999), Wind tunnel simulation experiment of mountain dunes, Journal of Arid Environments, 42(1), 49–59.
doi:http://dx.doi.org/10.1006/jare.1998.0488.
Yakhot, V., S. A. Orszag, S. Thangam, T. B. Gatski, and C. G. Speziale (1992), Development of turbulence models for shear flows by a double expansion technique Phys. Fluids A, 7(May), 1510–1520, doi:10.1063/1.858424.
Figure CAPTIONS
Figure 1. Digital elevation model of the P.E.I. foredune. Orientation of two topographic profile lines relative to the dune crestline used in the CFD modelling are indicated. Topographic profiles over the P.E.I. foredune from 0° (onshore) to 70° (obliquely alongshore). Note that the profile flattens and broadens considerably as the incident flow swings from perpendicular to highly oblique.
Figure 2a. Location of the seven points on the upper stoss slope, crest and lee slope sampled for CFD velocity profiles. The vertical height (m) of each location is labelled. Distance indicated by the x axis is relative to the dune crest (at 0 m).
Figure 2b. Wind velocity profiles from the upper stoss slope starting at – 1.5m upwind (down-slope) of the crest (the red line, at 0m) (locations in 2a) and down the upper lee slope for a 0° incident wind (i.e. perpendicular to the dune crest). The velocity profiles indicate progressive acceleration up the stoss slope and the jet flow appears at ~1m seawards of the dune crest. Ref wind speed refers to wind speed 4 m above the surface at the inlet.
Figure 3. Percent wind velocity profiles at the crest of the foredune for a directly onshore flow. Jets were produced for a range of shear velocities (∗ 0.23 – 0.58) equivalent to incident wind speeds of 5.0 to 12.5ms-1 at 4 m height on the beach upwind of the foredune. Ref wind speed refers to wind speed 4 m above the surface at the inlet.
Figure 4. Comparison of the foredune crest percent wind velocity profiles for a range of incident wind directions.Zero (0°) indicates directly onshore winds. Jet development is not present at an incident approach direction of 60° but is present by 50°, and is most pronounced for onshore to low angle oblique winds. Ref wind speed refers to wind speed 4 m above the surface at the inlet.
Figure 5. The degree and magnitude of jet development for three incident directions (0° - directly onshore, 40° and 70°). The jet is most pronounced and has the greatest aerial extent when winds are perpendicular to the foredune crest.
Figure 6. Maximum jet velocity developed at the foredune crest for each incident wind direction (a), the percent jet velocity relative to winds at 3m above the dune crest (b) and the log regressions of the vertical profiles of wind velocity up to 3 m height (c).
http://mc.manuscriptcentral.com/esp 3
For Peer Review
Figure 7. Wind velocity profiles and jet development for three different surface roughness lengths (left side), and isovels over the dune topography and varying surface roughness (right side). The presence of vegetation retards the degree of jet development. Ref wind speed refers to wind speed 4 m above the surface at the inlet.
Figure 8. Wind velocity profiles measured at the foredune crest for an onshore 2-D flow for the scarped (0.7m high) and non-scarped morphology. The jet is marginally faster (5%) at the crest where the scarp is present. Ref wind speed refers to wind speed 4 m above the surface at the inlet.
Shear Velocity (m s-1) Wind Speed 4 m above surface (m s-1)
0.23 5
0.35 7.5
0.47 10
0.58 12.5
TABLE CAPTION
Table 1. Shear velocities (m s-1) and equivalent wind speeds (m s-1) at 1 m above the surface at the inlet of the computational domain for each simulation assuming a of 0.0005 m. 3
For Peer Review
Jet Flow over Foredunes
Patrick A. Hesp and Thomas A.G. Smyth
School of the Environment, Faculty of Science and Engineering, Flinders University, Bedford Park, South Australia 5042
[email protected]; [email protected]
Key Points
• Jet flow over a foredune is examined for a range of wind speeds/directions.
• Jets develop regardless of wind speed, best developed for perpendicular winds.
• Surface roughness affects jet development
Abstract
Jet flows, which are localized flows exhibiting a high speed maxima, are relatively common in nature, and in many devices. They have only been occasionally observed on dunes, and their dynamics are poorly known. This paper examines computational fluid dynamic (CFD) 2D modelling of jet flow over a foredune topography. Flow was simulated in 10° increments from onshore (0°) to highly oblique alongshore (70°) incident wind approach angles. CFD modelling reveals that the formation of a jet is not dependent on a critical wind speed, and an increase in incident wind velocity does not affect the magnitude of jet flow. A jet is first formed at ~1.0m seawards of the foredune crest on the Prince Edward Island foredune morphology example examined here. A jet is not developed when the incident wind is from an oblique approach angle greater than ~50° because there is significantly less flow acceleration across a much lower slope at this incident angle. The presence of a scarp does influence the structure of the crest jet, in that the jet is more pronounced where a scarp is present. Surface roughness affects the magnitude of jet expansion and jets are better developed on bare surfaces compared to vegetated ones.
Keywords: Foredune, jet, jet flow, computational fluid dynamics (CFD), flow dynamics; .
1. Introduction
Jet flows are relatively common in nature, and in many devices. A jet is a localized flow exhibiting a high-speed maxima according to Wei et al. [(2013]). The word comes from the French jeter and Latin jactare ‘to throw’, and by the 16th Century was used as a verb meaning ‘to jut out’ (http://www.oxforddictionaries.com/definition/english/jet), hence the observation
http://mc.manuscriptcentral.com/esp 3
For Peer Review
that a jet has a well-defined ‘nose’ in the velocity profile (Wei et al., [(2013]); see e.g. http://www.eng.fsu.edu/~shih/succeed/jet/jet.htm). Jets may be formed where fluids are compressed and ejected from nozzles, pipes, taps, engines, exhausts (often as buoyant plumes) and similar objects or devices [(Schlichting, 1955; Birkhoff and Zarontonello, 1957; Cala et al., 2006]). One classic commonly cited example is the flow from a household tap. Jets are found, or occur in the atmosphere, for example, as low level jets during certain wind conditions [(e.g. Kraus et al., 1985; Brook, 1985]), as coastal phenomena associated with temperature gradients [(e.g. Parish, 2000]), in wakes behind bluff bodies [(Bickley, 1939; Mattingly and Criminale, 1972]), in various marine animals such as sponges and mollusks
[(Vogel, 1996]), in tidal flows [(e.g. Joshi, 1982]), in river mouths and streams [(e.g.
Abramovich, 1963; Wright, 1977, Allen, 1982; Rowland et al., 2009]), over stones in streams (Moth Iversen et al., 1989), in rip currents [(e.g. Sonu, 1972, fig 9; Haller and Dalrymple, 2001]), over steep slopes, scarps and cliff tops [(Bowen and Lindley, 1977; Liu et al., 1999]), and collimated jets are an important ingredient in the formation of stars [(Bacciotti et al., 2003]). Brook [(1985]) stated that “there are many types, their only common factor being a well-marked maximum in the boundary-layer wind speed profile” [(Brook, 1985, p. 133]). In the near-surface terrestrial coastal zone, there have been only a few observations or studies of jets within incident flows in blowouts [(Hesp and Hyde, 1996]) and over dunes and ridges. Hsu [(1977]) measured the existence of a jet just above the surface over the crest of an ice ridge, and produced a general model indicating jet flow over similarly shaped dunes and ice ridges. Arens [(1996]), Arens et al. [(1995]), Petersen et al., [(2011]), and Hesp et al. [(2013])
have shown that under certain conditions jets occur on, or near the crests of scarps and foredunes. These studies demonstrate that sand may be transported across scarps and dune crests due to these locally accelerated flows (termed ‘jettation’ by Arens, [(1996]) for the suspended sand transport component; cf. Petersen et al., [(2011])). The occurrence of jets may be related to incident wind speed, and/or incident wind direction, since in both the Arens
[(1996]) and Hesp et al. [(2013]) studies, jets only appeared once the incident wind speeds had increased above a certain velocity, or approached from a certain wind direction. In the aeolian/desert literature, jets have been shown to occur near or at the crests of various dune types, particularly transverse and barchan dunes, (although in some cases jets are observable in the velocity profiles but not discussed). Both Lancaster et al. (1996) and Omidyeganeh et al. (2013) have jets in some of their velocity profiles over terrestrial and
For Peer Review
occasions at 20-50cm high above the surface at the crest of a 7m high transverse dune. Walker and Shugar (2013, their figure 5a) appear to have a jet present in their dune crest velocity profile for a crest transverse flow. Jets have also been observed over small to large subaqueous dunes (e.g. Bridge and Best, 1988; van der Knaap et al., 1990; Bennett and Best, 1995; Kostaschuk and Villard, 1996).
Since jets are a specific, defined component of the flow field or regime, and may be critical to understanding the general flow behaviour over dunes and other topographies, it is important to recognise these phenomena as a distinct flow region, separate from other components of the flow (e.g. a speed-up region). It is critical to understand jet generation and behaviour over dunes since they may be prevalent more commonly than indicated by the few studies which encountered jets occurring them in studies over dunes, and they may be essential in assisting sediment transport up stoss slopes and/or generating onshore or offshore sediment transport downwind of the dune crest [(Petersen et al., 2011; Hesp et al., 2013; Bauer et al., 2015]). The same jets may be responsible for lifting and/or transporting sediment across vegetation canopies [(Hesp et al., 2013]), and perhaps in accelerating disturbance events
[(Hesp and Martinez, 2007]). In addition, some models of wind flow over dunes do not consider or generate jets in their development [(e.g. Van Boxel et al., 1999]).
In the following, we model the development of jets over a foredune topographic profile from Prince Edward Island, Canada, (where jets have been recorded; see Hesp et al., 2009, 2013) via computational fluid dynamic (CFD) modelling, and then examine five principal questions regarding jets over foredunes:
1. Where and when does a jet form?
2. How does it change with incident flow speed? 3. How does it change with incident wind direction/slope? 4. How does it change over a scarped versus a non-scarped dune? 5. How is it affected by a change in surface roughness?
2. Methods
2.1Dune Topography
The surface topography for this study is a foredune which has been studied for some years within the Greenwich Dunes unit of Prince Edward Island National Park on the north-east shore of Prince Edward Island (P.E.I.), Canada (see e.g. Davidson-Arnott et al., 2012; Hesp
http://mc.manuscriptcentral.com/esp 3
For Peer Review
et al, 2009, 2013, Chapman et al, 2013; Walker et al., 2006, 2009; Bauer et al., 2012, 2015; Delgado-Fernandez and Davidson-Arnott, 2011).
The foredune crest is ~8 to 9 m above mean water level with a steep stoss slope (20°-25°) and an ENE-WSW crestline orientation. A low-gradient, microtidal (~1 m tidal range), moderate to high energy intermediate beach with a low-tide width of about 35 m is present on the seaward side of the dune. At the time of survey the foredune displayed a non-vegetated, 0.7 m high scarp, which later filled in with sand following a significant wind storm [(see figure 6 in Hesp et al., 2009]). The dune was vegetated by Ammophila breviligulata, with plant heights averaging 0.3 m and spatial density ranging from 2 – 45% based on visual assessments of percent cover on contiguous transects. The digital elevation model used to produce the dune surface within the computational domain was generated from 3666 RTK-DGPS points collected in a 100 m x 150 m area on the foredune at PEI.
For Peer Review
Figure 1. Digital elevation model of the P.E.I. foredune. Orientation of two topographic profile lines relative to the dune crestline used in the CFD modelling are indicated. Topographic profiles over the P.E.I. foredune from 0° (onshore) to 70° (obliquely alongshore). Note that the profile flattens and broadens considerably as the incident flow swings from perpendicular to highly oblique.
2.2 Computational Fluid Dynamics (CFD) Methodology
Wind flow over the dune surface was simulated using computational fluid dynamics (CFD)
CFD is a numerical method of solving fluid flow using the Navier-Stokes equations and . CFD has been successfully used to simulate flow over a number of coastal dune landforms
[(Wakes, 2013; Wakes et al., 2010; Smyth et al., 2012; 2013; Hesp et al., 2014; Jackson et al., 2011). The Navier-Stokes equations can also be solved linearly over dunes (Walmsley and Howard, 1985), with less computational cost than CFD, however this method is only
appropriate where the windward slope is small and the wind flow not affected by near surface jets or flow separation. Wippermann and Gross (1985), also numerically modelled over a barchan dune using the mesoscale meteorological model, FITNAH (Flow over Irregular Terrain with Natural and Anthropogenic Heat Sources). FITNAH is however limited by its finest cell resolution of 2 m.]). Simulations in this study were performed using the open source software OpenFOAM, which is capable of solving a range of complex fluid flows and also includes tools for meshing the surface topography and visualising the results. In this case, wind over the dune was calculated as an incompressible flow using a steady state solver, simpleFoam. Turbulence was modelled using the Renormalised group (RNG) κ-epsilon method [(Yakhot et al., 1992]). This is a turbulence model based on the Reynolds-averaged Navier-Stokes (RANS) equations, which focuses on the effects of turbulence on the average flow rather than resolving turbulence at every scale, as with direct numerical simulation (DNS) or at the larger scale such as a large eddy simulation (LES). The RNG model has been used to accurately simulate near surface flows over a transverse dune in a wind tunnel [(Parsons et al., 2004]), coastal dune complex [(Wakes et al., 2010]), a complex foredune blowout [(Smyth et al., 2012; 2013]), and flow over a foredune [(Hesp et al., 2015]). Joubert et al., (2012) also found that the original κ-epsilon turbulence model reproduced three-dimensional near surface patterns around a linear desert dune.
0 2 4 6 8 10 12
0 20 40 60 80 100 120 140 160 180 200
H e ig h t (m ) Distance (m) 0° 10° 20° 30° 40° 50° 60 70°
Formatted: Font: (Default) Times New Roman, 12 pt
Formatted: Font: (Default) Times New Roman, 12 pt
Formatted: Font: (Default) Times New Roman, 12 pt
Formatted: Font: (Default) Times New Roman, 12 pt
For Peer Review
All simulations in this study were performed in two-dimensions. This approach was used because in three-dimensions, accurate representation of the change in the slope at the crest of the foredune in the mesh proved problematic as it became overly smoothed. In the two-dimensional simulations any change in slope was accurately recreated in the mesh using a polyline. Ideally flow modelling over the foredune would occur in three dimensions as wind is elliptic in nature as demonstrated by Hesp et al. (2015) who confirmed that incident winds which approach obliquely to the dune toe are deflected toward a more crest-normal
orientation across the stoss slope of the foredune.
A mesh independence test was performed by calculating wind flow over 3 meshes of 0.5 m, 0.375 m and 0.25 m resolution. Between each case, wind flow at 30 points between 0.1 m and 3 m above the crest of the foredune changed by <1%. Due to the increased resolution of data points, the 0.25 m horizontal resolution mesh was employed for this study. The horizontal extent of each mesh ranged from 156 m for the 0° transect to 199 m for the 70° transect. In all cases the horizontal resolution of the mesh was 0.25 m and the vertical resolution progressed from 0.1 m at the surface to 1.63 m at the upper boundary located 64 m above the beach surface. Vertical cell size resolution of the mesh was restricted by the maximum dune surface roughness height () of 0.05 m. Each simulation was deemed complete when the residuals for each variable being solved (velocity, pressure, turbulent kinetic energy and energy dissipation) decreased by 4 orders of magnitude.
2.2.1 Computational Boundary conditions
In each simulation vertical profiles of wind speed (), turbulent kinetic energy () and energy dissipation () at the inlet boundary were defined assuming a constant shear velocity (∗) value with height using equations 1, 2 and 3 (Richards and Hoxey, 1993 and Blocken et al., 2006):
= ∗ ln
(1)
= ∗
(2)
= ∗
(3)
Where is the height above the surface, is the von Karman constant (0.42), is the surface roughness length and a constant of 0.09.
For Peer Review
To examine how flow dynamics changed with wind speed, simulations were conducted using 4 values of ∗ ranging from a minimum of 0.24 m s-1 to 0.60 m s-1 (Table 1). For each simulation a surface surrounding the dune was prescribed a surface roughness constant () of 0.0005 m, the equivalent of a sand surface (Bagnold, 1960). To test how jet dynamics change with roughness height, the foredune was prescribed roughness heights equivalent to that of bare sand ( 0.0005 m (Bagnold, 1954)), Ammophila breviligulata ( 0.01 m (Olson, 1958)), and thin grass 0.5 m high ( 0.05 m (Sutton, 1953)).
Table 1. Shear velocities (m s-1) and equivalent wind speeds (m s-1) at 1 m above the surface at the inlet of the computational domain for each simulation assuming a of 0.0005 m.
Shear Velocity (m s-1) Wind Speed 4 m above surface (m s-1) 0.23 5.0
0.35 7.5 0.47 10 0.58 12.5
.
3. Location of the Jet Formation
Because it is often the case that there are not enough instrumented masts in the field to adequately cover a foredune, it cannot be determined exactly where on the stoss face or near-crest region the jet flow is first formed. Thus, the CFD model was utilized to examine where the jet first forms on the foredune. Figure 2 illustrates seven locations across the upper stoss, crest and lee slope where velocity profiles were modelled in order to examine the first point of jet formation, and its downwind extension past the crest (if it occurs).
8.35 8.45
8.56 8.66
8.75
8.80 8.81
8.76
-2.0 -1.5 -1.0 -0.5 0.0 0.5
Distance (m) relative to crest (crest at 0 m) (b)
(A)
http://mc.manuscriptcentral.com/esp 3
For Peer Review
Figure 2a. Location of the seven points on the upper stoss slope, crest and lee slope sampled for CFD velocity profiles. The vertical height (m) of each location is labelled. Distance indicated by the x axis is relative to the dune crest (at 0 m).
Figure 2b. Wind velocity profiles from the upper stoss slope starting at – 1.5m upwind (down-slope) of the crest (the red line, at 0m) (locations in 2a) and down the upper lee slope for a 0° incident wind (i.e. perpendicular to the dune crest). The velocity profiles indicate progressive acceleration up the stoss slope and the jet flow appears at ~1m seawards of the dune crest. Ref wind speed refers to wind speed 4 m above the surface at the inlet.
In order to assess this, the wind velocity profiles were modelled at intervals of 0.25m across the P.E.I. foredune from upper stoss position over the crest, and down the lee slope to determine where the jet flow structure was initiated (Figure 2a). The transect utilized was the scarped profile, and a roughness height equivalent to Ammophila breviligulata (z0 0.01 m)
was applied to the foredune slope. Figure 2b demonstrates that the flow progressively accelerates up the stoss slope as observed in many similar dune and ridge studies [(e.g. Arens et al., 1995; Finnigan, 2007; Walker et al., 2006, 2009; Bauer et al., 2013; Hesp et al., 2009, 20154]). While there is some slight indication of jet formation at -1.5m, a clear jet is formed at 1.0m seawards of the crest. The flow becomes better defined as a more pronounced speed bulge (or nose) develops at around 50cm above the bed at -0.75 to -0.5min the next 50cm horizontal distance downwind (or upslope), and is most pronounced at -0.25m seawards or downslope of the crest (Figure 2b). Note that the crest is itself quite convex and rounded (Figure 2a). The jet shifts upwards ( to around 0.75m above the surface) and becomes more bulbous in the profile at 0.25m past the crest. It is likely that the very top of the crest is the point at which lee flow separation begins, and as this develops, the higher speed jet
0.0 0.5 1.0 1.5 2.0 2.5 3.0
0.7 0.9 1.1 1.3 1.5 1.7
H
e
ig
h
t
a
b
o
ve
d
u
n
e
s
u
rf
a
ce
(
m
)
Wind speed /Ref Wind Speed -1.50
-1.25
-1.00
-0.75
-0.50
-0.25
Crest
0.25
(B) 3
For Peer Review
component of the flow is forced upwards over the separation envelope as observed in other studies [(cf. Hsu, 1977]). In addition, the flow tends to sweep upwards across the crest directed by the steep angle of the stoss slope, so the jet will tend to move upwards in the profile as it crosses the dune crest. Flow velocities are low near the surface in the lee of the dune crest due to flow separation development in this region.
The wind velocity profile with embedded jet at the dune crest displays a similar structure to that encountered in the field at P.E.I. (Hesp et al., 2009, 2013), and provides partial validation of the modelling. The vertical height above the bed at which the jet is most pronounced (the
apex of the nose) in the modelling is lower by approximately 50cm (at the crest) to 25cm (just downwind of the crest) than that encountered in the field. This is likely due to the presence of vegetation in the field, whereas there is no vegetation present on the modelled surface.
4. Jet Structure and Incident Wind Speed
As noted in the introduction, observations of jets formed during different incident wind speeds have been made [(e.g. Hsu, 1977; Arens et al., 1995; Hesp et al., 2009, 2013]), but it is unclear if variations in incident wind speed actually produce changes in the jet formation or shape. Figure 3 shows wind velocity profiles simulated via CFD for four quite different incident wind velocities (5 m s-1 to 12.5m s-1 at 4m above the surface on the beach) for a directly onshore flow.
http://mc.manuscriptcentral.com/esp 3
For Peer Review
Figure 3. Percent wind velocity profiles at the crest of the foredune for a directly onshore flow. Jets were produced for a range of shear velocities (∗ 0.23 – 0.58) equivalent to incident wind speeds of 5.0 to 12.5ms-1 at 4 m height on the beach upwind of the foredune. Ref wind speed refers to wind speed 4 m above the surface at the inlet.
Jet flow was produced at the foredune crest for all four wind speeds tested (Figure 3) thereby indicating that once the flow velocity is above the threshold for sand transport, wind speed is not a factor determining whether a jet is present or not. Whilst it superficially appears as if the jet becomes more pronounced as wind speed increases (as in Hesp et al., 2013, their Figure 6)), when the results are made relative to the incident wind speed on the beach (at 4m height), all the four percent velocity profiles in Figure 3 virtually overlap, and there is only a very slight difference apparent indicating that incident wind speed has minimal effect on jet development.
5. Jet Development and Incident Wind Direction
Field observations of jets (e.g. Hesp et al., 2013) indicates that the jets vary according to incident wind direction. In order to test the influence of incident wind direction on jet development, a range of incident wind approach angles from 10° to 70° (almost perpendicular to almost dune crest parallel) were examined via the CFD model (Figure 4). Figure 1
illustrates the 2-D topographic profiles for the range of incident winds modelled. These show
0.0 0.5 1.0 1.5 2.0 2.5 3.0
1.3 1.4 1.5 1.6 1.7
H
e
ig
h
t
a
b
o
ve
d
u
n
e
c
re
st
(
m
)
Wind speed/Ref wind speed 0.58
0.47
0.35
0.23 3
For Peer Review
the relative slopes that the incident wind would encounter or “see” as it crosses the dune. Note how the slopes flatten considerably and elongate as the incident wind flow becomes increasingly oblique to the dune crest.
Figure 4. Comparison of the foredune crest percent wind velocity profiles for a range of incident wind directions.Zero (0°) indicates directly onshore winds. Jet development is not present at an incident approach direction of 60° but is present by 50°, and is most pronounced for onshore to low angle oblique winds. Ref wind speed refers to wind speed 4 m above the surface at the inlet.
The incident wind angle/stoss slope has a significant impact on the production of a jet at the crest. As the incident angle becomes more oblique, making the slope less steep, the jet becomes slower and less defined until it is not discernable past 50° incident wind approach angle (Figure 4). In the field Hesp et al. (2013) found that a jet did not develop when the incident wind was from an angle >55°.
In three dimensions, the flow is topographically steered before reaching the dune crest (Walker et al., 2006; Hesp et al., 2015).This may cause the jet to form at more oblique incident angles than has been found here.
0.0 0.5 1.0 1.5 2.0 2.5 3.0
0.50 0.75 1.00 1.25 1.50 1.75
H
e
ig
h
t
(m
)
Wind Speed/Ref Wind Speed 0°
10° 20° 30° 40° 50° 60° 70
http://mc.manuscriptcentral.com/esp 3
For Peer Review
The jet is also more pronounced (i.e. more defined nose) in the vertical profile during winds that are perpendicular to the crest, likely because the stoss slope is steepest for these incident winds, and perhaps because of the presence of a more defined separation zone, which starts to limit the near surface wind speed near or at the crest.
Wind speed at the crest also decreases as incident wind direction becomes more oblique [(cf. Walker et al., 2009; Hesp et al., 2015]). The degree and magnitude of jet development for three incident directions (0°, 40° and 70°) may be seen in Figure59. The red zone indicates a high speed jet zone or region, and this is most pronounced in perpendicular flows. As the dune profile flattens and lengthens and the wind becomes increasingly oblique and the dune profile flattens and lengthens, the red zone decreases in size and the velocity declines. The degree of speedup also decreases as the incident flow becomes more oblique as indicated by the speed zones in Figure 5.
Figure 5. The degree and magnitude of jet development for three incident directions (0° -
directly onshore, 40° and 70°). The jet is most pronounced and has the greatest aerial extent
when winds are perpendicular to the foredune crest.
Figure 6 displays the maximum jet velocity developed at the foredune crest for each incident wind direction (Figure 6a), and the percent jet velocity relative to winds at 3m above the dune crest (Figure 6b). Figure 6c illustrates the log regressions of the vertical profiles of wind velocity up to 3 m height, and shows that as