A Genetic Analysis of Lysosomal Enzyme Activities in Brahman Cattle
7
0
0
Full text
(2) with 0.75 ml of a medium (TKA) containing 0.5 M KCl, 0.005 M acetate buffer (pH 3.5) and 0.2% Triton-XIOO (Healy 1982). The activities of acid alpha-glucosidase (GLU), beta-D-galactosidase (EC 3.2.1.23) (GAL) and beta-N-acetyl-D-glucosaminidase (EC 3.2.1.30; hexosaminidase) (HEX) were measured in the supernatant of these cell extracts according to Healy (1982), with the exception that ap-nitrophenol derivative was used as the substrate for HEX. Activities are expressed as IU I-I of TKA extract. Data Analysis The data analysed were measurements of GLU, HEX and GAL activities in 323 male and 1429 female Brahman cattle from 6 herds. These were the progeny of 199 sires and 1190 dams. Herds were bled on from two to six different occasions, and in all there was a total of 24 different sampling dates across the herds. The average age at bleeding was 48 :t 0.9 months. Data analysis involved the use of least squares to estimate fixed effects and restricted maximum likelihood (Patterson and Thompson 1975) to estimate components of variance. The computer programme used was developed by Robinson et al. (1987). The fixed effects were herd, sampling date, sex and age (covariate). The random effects were sire, dam and residual. An analysis was also carried out on GLU alone using the same model, with HEX and GAL added as covariates. Dam effects were absorbed and sire effects used to estimate heritabilities and genetic correlations between traits. The sum of cross products for correlation estimates were obtained from the difference between the sire variance of the sum of the traits and the sum of the sire variances obtained for each trait. Selection indices (I) were constructed by the standard procedure described by Cunningham (1972). These combined HEX, GAL and GLU into a single measurement to predict genetic merit for GLU. These were of the form:. ('. I=b..HEX + b2.GAL+ hJ.GLU, where the bn are weighting coefficients. The efficiencies of the indices as selection criteria for changing GLU were measured as the genetic gain expected in the population per standard deviation change in selection differential. They are also equivalent to the genetic correlations between the index values and the breeding values for GLU. To search for evidence of major gene effects on the activities of the enzymes, quantile-quantile (Q' -Q) plots were drawn for HEX, GAL and GLU. Hoeschele (1988) demonstrates the use of this technique in detecting the presence of several major genotypic means. In constructing the Q' -Q plots, the ordered sire effects were plotted against cumulative probabilities. The model given in the Appendix predicts the change in frequency of a gene which contributes a known proportion of the total variation of a continuously variable trait, in this case GLU.. Results Fixed Environmental Effects - Herd, Sampling Date, Age, Sex Hexosaminidase activity (HEX) The average value of HEX was 91.2:t 0.6 IV I-I. Males at 94.2 were higher than females at 88.2 IV I-I (standard error of difference (s.e.d.) 2.3 IV I-I). Age at bleeding had a significant effect on HEX, with values declining at the rate of 0.2 :t 0.02 IV 1- I per month. There were considerable herd differences in mean levels of HEX. These ranged from 116.3 to 73.6 IV I-I (mean s.e.d., ~.5). Mean HEX values also differed between sampling dates, ranging from 114.3 to 69.9 IV I-I (mean s.e.d., 6.3). Beta-D-galactosidase activity (GAL) The average value of GAL was 2.1 :t 0.02 IV I-I. There was no difference between the sexes but age at bleeding had a significant effect on the level of GAL. This declined 0.02 :t 0.007 IV I-I per month of age. Herd averages for GAL ranged from 1.7 to 2.8 IV I-I (mean s.e.d., 0.1) and sampling dates from 1.7 to 2.5 IV I-I (mean s.e.d., 0.2 IV I-I). Alpha-glucosidase activity (GLU) The average value of GLV was 0.59:t 0.01 IV I-I. Neither sex nor age had any significant effect on GLV. Herd means ranged from 0-49 to 0.76 IV I-I (mean s.e.d., 0.06). r.
(3) and sampling date means from 0.41 to 0.75 IU 1-[ (mean s.e.d., 0.07). The partial regression coefficients of GLU on HEX and GAL were 0.003 :t 0.0003 and 0,109 :t 0.012 IU 1-1, respectively. Random Effects - Sire, Dam, Residual After removal of the fixed and sire and dam effects on HEX, GAL and GLU, an examination of the distribution of the residuals revealed no significant departure from normality. Probability plots of the distributions of the 199 sire effects on HEX, GAL and GLU are given in Fig. 1. Superimposed on these are the same distributions plotted as histograms. 999 99. -. ). 95 BD 50 20. 0.1' 81. 89. 85. 93. 97. 101. 105. HEX IIU/1) 999 99. Fig. 1. Quantile-quantile plots of sire effects for the activities 501 201. I. Jvo-/. 80 951. of the three enzymes 11. hexosaminidase beta-galactosidase. I ./. (HEX), (GAL). and alpha-glucosidase (GLU). Histograms of the distributions are superimposed on the probability plots. 0. 1. I "" ".r'. 1.8. I " 2. ,. I Lr,1 2.2. nln 2.4. m 2.6. GAL (IU/1) !l99. '). =". 99 c w. 11. 951. = --. 80 50 1ii 20 (5. 01 0.39. 0.49. 0.59. 069. 0.79. GLU (IU/1). Of the three distributions, only that ofGLU exhibits a departure from normality. This is revealed by a Kolmogorov statistic of 0.12 (P< 0.01). The inflections of the Q' -Q plot and peaks of the histogram for GLU are consistent with a mixture of two normal distributions with means approximating 0.5 and 0.6 IU 1-[ respectively. Genetic Parameters The overall means, standard deviations, heritabilities and genetic and phenotypic correlations of GLU, HEX and GAL are given in Table 1..
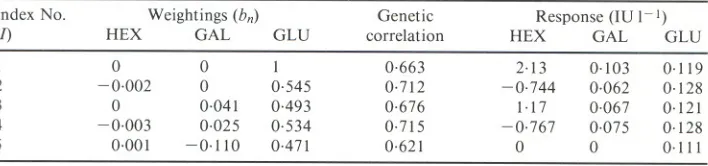
(4) Table 1. Population statistics of the activities of hexosaminidase (HEX), beta-galactosidase (GAL) and acid alpha-glucosidase (GLU) Heritabilities are underlined on the diagonal. Phenotypic correlations are above and genetic correlations below the diagonal HEX HEX GAL GLV Mean (IV I-I) s.d. (IV I-I). 0.29 + 0.09A 0.67 :t 0.11 0.23:t0.18 91.2:t0.6 25.9. GAL 0.76 0.31 +0.09 0.42 :t 0.16 2.1 :t 0.02 0.67. GLV 0.52:t 0.02 0.52 :t 0.02 0.44 + 0.09 0.59:t0.01 0.27. AStandard error.. The heritabilities of all three enzyme activities are in the intermediate range and do not differ significantly from each other. The heritability of GLU corrected by phenotypic regression on HEX and GAL was 0.54 :t 0.12. Genetic and phenotypic correlations among the three enzymes activities were positive. Of the genetic correlations, that between HEX and GAL (0.67:t 0,11) was the largest and that between HEX and GLU (0.23 :t 0.18) was the smallest.. (. Selection Indices The weighting coefficients (bn) for a range of selection indices are given in Table 2. Indices 1 to 4 vary in the number of enzymes included. Index 5 includes measurements on all enzyme activities, but its objective is to increase GLU whilst simultaneously preventing change in HEX and GAL. Table 2. Selection indices with the activity of hexosaminidase (HEX), beta-galactosidase (GAL), and acid alpha-glucosidase (GLU) as measured traits and an increase in GLU as the breeding objective The ,elative efficiencies of the indices are shown by genetic correlations between the indices and GLV. Responses in HEX, GAL and GLV expected from I s.d. of selection are also given Index No. (I) I 2 3 4 5. HEX. Weightings (bn) GAL GLV. 0 -0.002 0 -0.003 0.001. 0 0 0.041 0.025 -0.110. I 0.545 0-493 0.534 0.471. Genetic correlation 0.663 0.712 0.676 0.715 0.621. Response (IV I-I) HEX GAL GLV 2.13 -0.744 1.17 -0.767 0. 0.103 0.062 0.067 0.075 0. 0.119 0.128 0.121 0.128 0.111. As expected, both the correlations between the indices and the breeding value for GLU and the predicted response in GLU rise with the number of enzymes included in the index. Thus, the best selection criterion is Index 4, which includes measurements of all three enzymes. However, Index 2, using only HEX and GLU, is almost as good as Index 4. Compared with the use ofGLU alone (Index 1), Indices 4 and 2 are 1.08 times as efficient as selection criteria. Using Index 5 which restricts change in HEX and GAL, sacrifices 13% of the gain possible in GLU by using Index 4. Predicted responses in GAL vary according to the index used, but are in the same direction as GLu. Responses in HEX vary in direction, being negative for those indices in which HEX has a negative weighting. The use ofGLU corrected by phenotypic regression on HEX and GAL, had a heritability ofO. 54 :t 0.11 and a phenotypic standard deviation of 0.22 IU 1-1. Using this as the selection criterion would give a response from I s.d. of selection of 0,121, the same as Index 3 and only 2% more than using GLU alone.. (.
(5) ). ). Discussion A number of sources of variation and covariation in the activities of the three enzymes were identified. The environmental effects of sampling date and herd caused variation in the activities of all three enzymes. Levels of HEX and GAL declined with age, and males had higher HEX values than females. In estimating breeding values for GLU, the enzyme of prime interest, some account should be taken of these environmental effects, e.g. by using deviations from herd by sampling date means rather than absolute values. The objective of selection to increase GLU is, of course, to reduce the incidence of Pompe's disease. As shown in the Appendix 1, the extent to which this can be achieved depends on the contribution of the gene causing the condition to the total genetic variation in GLU and on the frequency of this gene. Although not evident in the distribution of individual animal phenotypic measurements of GLU, the distribution of sire effects obtained from the analysis (Fig. 1), is suggestive of bimodality. Given that this is due to the gene, which when homozygous causes Pompe's disease, the two means estimated at 0.5 and 0.6 IU 1-[ would then represent the two types of progeny, the one produced by heterozygous sires, and the other by homozygous normal sires. Assuming both types of sire had a random allocation of mates with respect to the gene, a value of 0.2, twice the difference in means, is considered to be a reasonable estimate of a, the gene's effect in this population, assuming additivity. Quite high levels of genetic variation were found in the activities of all three enzymes, heritabilities ranging from 0.29 for HEX to 0-44 for GLU. This indicates that all three should respond readily to selection. The genetic correlations between the activities of the enzymes were of sufficient magnitude for measurements of all to be considered in predicting the breeding value of anyone. This was demonstrated by the construction of the selection indices, although the advantage of using these in place of GLU itself does not exceed 8%, owing to the high heritability ofGLU. The measurement of HEX makes a more useful contribution than GAL to the prediction of an animal's breeding value for GLU, but this contribution would have to be weighed against the cost of determining HEX levels. An increase in GLU by selection will result in changes in HEX and GAL, the magnitude and direction of these changes depending on the index used (Table 2). If these changes were judged to be undesirable, the restricted Index 5 could be used as a selection criterion. At the cost of a 13% reduction in the maximum possible selection response in GLU, the levels of both HEX and GAL could be held stationary by the use of this index. The phenotypic regression coefficients of GLU on HEX and GAL were very close to those reported by Reichmann et al. (1987) for a herd of Friesian cattle known to be free ofPompe's disease. As expected from genetic theory, correcting GLU by phenotypic regression on HEX and GAL gave a selection criterion inferior to the best index, Index 4, which was formed by using genetic regressions. An alternative method of estimating a would have been to use an individual animal rather than a sire model to obtain the distributions, then a would have equalled the difference in mean of the distributions. This approach was not taken because individual breeding values would have been of lower reliability than sire values and may have been biased by maternal effects. Data from this project and from field observations suggest that approximately 5 in 1000 Brahman calves born in central Queensland exhibit Pompe's disease. Assuming random mating of their parents, this gives an estimate of 0.07 for the frequency (q) of the gene and 0.13 for the frequency of heterozygotes. The latter value is consistent with the distribution ofGLU in Fig. 1, where 6.5% (50% of 0,13) of the sire effects are less than 0.5, the apparent mean of heterozygous sire effects. From Appendix 1, the genetic variance in GLU attributable to the gene is calculated at 0.005 IU 1-[, given that q is 0.07 and a is 0.2. This variance is only 16% of the total of 0.032 IU 1-\ calculated for the trait from sire variances, the remaining 84% presumably being due to other genes whose individual effects cannot be detected..
(6) It follows that 1 s.d. of selection differential should increase the level of GLU in the population by 0.12 IU 1-1 (Table 2), but only 16% of this change would be due to a reduction in the frequency of the gene causing Pompe's disease, the remainder being due to other genes. The low estimate of the gene's contribution to variation in GLU is surprising. Oisassortative mating of the parents of the animals analysed would have led to an underestimate of q, and hence its contribution to variation in GLU, but this seems unlikely since the enzyme activities of most of the parents would not have been known at mating. Even allowing for the possibility of downward bias, there is clear evidence for the existence of minor genes which would lead to low values of GLU in some families, even in the absence of the Pompe's disease gene. Table 3. Change in the frequency of the gene n due to lethality and one standard deviation of truncation selection on the continuous scale of the selection criterion The effect of the gene is measured in phenotypic standard deviations (aP-1/2) Initial frequency (q) 0.05 0.05 0.05 0.10 0.10 0.10 0.15 0.15 0.15. ap-1/2 0.5 0.75 1.0 0.5 0.75 1.0 0.5 0.75 1.0. Frequency change Selection Lethality (dq) (dq') -0.022 -0.032 -0.043 -0.037 -0.056 -0.074 - 0.048 -0.072 -0.096. -0.002 -0.002 - 0.002 -0.009 -0.009 -0.009 -0.020 -0.020 -0.020. (. Total -0.024 -0.034 -0.045 - 0.046 -0.065 -0.083 -0.068 - 0.092 -0.116. Applying the arguments set out in the Appendix, 1 s.d. of selection differential for increased GLU is expected to result in a decline of approximately 0.05 in q(Table 3). Under random mating this would lead to a fall in the incidence ofPompe's disease over the same period to 5 in 10000 calves born. At the existing level of culling of 0.15 in the present Pompe's disease control programme, it should take 3. 5 generations to accomplish this. The recommended selection criterion would be an estimate ofthe breeding value for GLU using measurements of HEX and GLU and taking account of an animal's sex, age, date of bleeding and herd of origin. Acknowledgments Thanks are due to staff of the Biochemistry Branch and to Or F. C. Baldock and Mr G. M. Macbeth of the Animal Research Institute for assistance with data preparation. References Cunningham, E. P. (1972). Theory and application of statistical selection methods. Proc. XIV Br. Poultry Breeder's Roundtable, Birmingham, pp. 1-38. Healy, P. J. (1982). Diagnosis of genotype for generalised glycogenosis in cattle. Biochem. Med. 28, 224-8. Hoeschele, I. (1988). Statistical techniques for detection of major genes in animal breeding data. Theor. Appl. Genet. 76, 311-19. Jolly, R. D., Van-de-Water, N. S., Richards, R. 8., and Dorling, P. R. (1977). Generalised glycogenesis in beef Shorthorn cattle - heterozygote detection. Aust. J. Exp. BioI. Med. Sci. 55, 141-50. O'Sullivan, B. M., Healy, P. J., Fraser, I. R., Nieper, R. E., Whittle, R. J., and Sewell, C. A. (1981). Generalised glycogenosis in Brahman cattle. Aust. Vet. 1. 57, 227-9.. (.
(7) ~. Patterson, H. D., and Thompson, R. (1975). Maximum likelihood estimation of components ofvariance. Proc. 8th Int. Biometric Conf., pp. 197-207. Reichmann, K. G., Twist, J. 0., McKenzie, R. A., and Rowan, K. J. (1987). Inhibition of bovine alpha-glucosidase by Castanospermum australe and its effect on the biochemical identification of heterozygotes for generalised glycogenosis type II (Pompe's disease) in cattle. Aust. Vet. 1. 64, 274-6. Robinson, D. L, Digby, P. G. N., Wiliiams, E. R., and Ratcliff, D. (1987). Estimation of variance components in non-orthogonal data by residual maximum likelihood. REML user manual. Scottish Agricultural Statistics Service, University of Edinburgh. Manuscript received 15 May 1989, accepted I August 1989. Appendix 1. The effect of truncation selection on the frequency of a major gene Let q be the frequency of a gene n in breeding animals. It has an additive effect on a normally distributed trait and is recessive lethal for fitness. It is desired to approximate the change in frequency of n through one generation of truncation selection on the trait. With random mating of the parents, the following describes their progeny just before selection as parents of the following generation: nn Genotype NN Nn 0 Fitness I I 0 Frequency of genotype x y Effect on trait (e) a 0 Frequency of the n gene (q) 0 0.5 where x=(l. -. q)(l + q)~ I and y= 2q(l + q)-I,C is the covariance between q and e and C= -axy2-1. P is the phenotypic variance of the trait, and P=G+E, where G is the genetic variance due to the locus and G=a2x(l-x). E is the residual variance due to environmental loci. b is the regression of q on phenotype and: b = CP-l.. effects and the effect of genes at other. dq is the change in q resulting from i standard deviations of truncation selection on the trait and or. dq= -ibpl/2 dq= -iCP-l/2.. To this change in the frequency of n due to selection on the metric scale must be added the change due to the lethality of nn genotypes given by: dq'=-q2(l+q). Using these formulae, the change in gene frequency per generation for each standard deviation of selection was calculated for a range of values of q and aP-l/2, the effect of the n gene in phenotypic standard deviations of the selection criterion. The results are given in Table 3..
(8)
Figure

Related documents
Since the crack geometry is symmetric, 1/4 cylinder model with an inner semi-elliptic surface crack is assumed for finite element analysis, as shown in Fig..
21 Department of Neurosurgery, Tangdu Hospital, The Second Affiliated hospital of the Fourth Military Medical University, 1 Xinsi Road, Xian, Shanxi Province 710038, People ’ s
Given that the station uses different presenters who may be non-native speakers of some of the target languages of the listeners of Mulembe FM newscasts, the
The paper assessed the challenges facing the successful operations of Public Procurement Act 2007 and the result showed that the size and complexity of public procurement,
After successfully supporting the development of the wind power technology, an approach is needed to include the owners of wind turbines in the task of realizing other ways, other
In conclusion, the finding of this cross-sectional study of pre and post menopausal women show no evidence of a significant difference in BMD between Ocs users and never user
AIRWAYS ICPs: integrated care pathways for airway diseases; ARIA: Allergic Rhinitis and its Impact on Asthma; COPD: chronic obstructive pulmonary disease; DG: Directorate General;
It was decided that with the presence of such significant red flag signs that she should undergo advanced imaging, in this case an MRI, that revealed an underlying malignancy, which
