A survey of the Princess
Charlotte Bay recreational
barramundi fishery
D.
J.
Russell
P. Hales
Northern Fisheries Centre
Cairns
© Queensland Government 1993 Department of Primary Industries GPO Box 46
SUMMARY
A voluntary survey of recreational anglers using Lakefield National Park, a wilderness reserve in north Queensland, was undertaken from 1986 to 1991. The recreational barramundi fishery catch in the Park is estimated to be between 4.4 and 9.4 tonnes per annum and is conservatively worth between $A 200 000 and $A 430 000 per year. Management measures regulating the fishery including the bag limit, closed season and minimum legal size were largely respected. The average angler caught 1.26 barramundi per visit. Average size of barramundi retained increased from 59.8 cm in 1987 to 66.4 cm in 1990. Catch rates, while low (0.09 fish per hour), were comparable to those obtained in similar recreational fisheries in the Northern Territory and have steadily increased since 1987.
INTRODUCTION
The river systems of Princess Charlotte Bay (14° 40'S, 144° OO'E) have long supported extensive commercial and recreational fisheries. Commercial fishermen are primarily boat based and target a number of estuarine and coastal species using river and foreshore set gill nets. Its high market value makes barramundi, (Lates calcarifer), the most sought after of these species.
The recreational fishery is largely centred· on the extensive freshwater habitats in the hinterland. Most of the lower parts of the basin including the main recreational fishing areas are covered by Lakefield National Park (Fig. 1). The Park is about 537 000 hectares in area and is one of the Quensland's largest conservation reserves. While the Park has no built accommodation there are excellent camping facilities. In 1990 over 4000 campers visited the park. During their visit tourists can undertake a range of recreational activities including fishing. The Park is drained by the Normanby, Bizant, Morehead and North Kennedy Rivers and their tributaries and distributaries. The rivers are largely ephemeral, becoming a series of isolated freshwater waterholes and lagoons during the dry winter months. In the summer wet season, the various watercourses often merge to flood large areas. The lower estuaries and proximal inshore areas are also protected by the Princess Charlotte Bay Fish Habitat Reserve.
Documentation of the recreational fisheries of tropical Australia is patchy. In the Northern Territory, Griffin (1982, 1988) has, through a series of roadside surveys, documented the recreational barramundi fishery in the Arnhem Highway area. In Queensland, Rasmussen (1988) released the results of a 1987 survey of the recreational fishery of Lakefield National Park. This survey was undertaken using a combination of survey forms and roadside interviews and some of the data he collected have been used in the present study.
rivers some other estuarine species are also important components of the catch. Commercial fishing activity is limited to tidal waters. National Parks permit seven commercial fishers to fish in the Bizant and Normanby Rivers (N. Hedgecock, National Parks and Wildlife Service, pers. comm.). The remaining rivers and coastal foreshores are open to all commercial fishermen endorsed to operate in the east coast barramundi fishery.
The recreational barramundi fishery in Queensland is subjected to a series of regulations including a closed season (November to January inclusive), minimum legal size (now 58 cm total length) and a bag limit of five fish per day. As part of the management strategy for the Park, locations are routinely closed to fishing for periods of up to six years.
The present study. represents the most comprehensive investigation yet undertaken on a Queensland recreational fishery. As well as providing vital data on the size, structure, economics and short-term stock abundance of the barramundi fishery in Lakefield National Park, it gives an insight into angler attitudes. and degree of compliance with current regulatory measures.
METHODS
The survey was conducted using a questionnaire (Appendix 1) which was offered to all angler parties checking in with National Parks personnel prior to their stay in the park. The form was based on one used by Rasmussen (1988). Completion of the form was voluntary. Forms were sequentially numbered to allow return rates to be calculated. The completed forms could be returned to the National Parks personnel, placed in one of the drop boxes located at each exit to the Park or returned directly to the Northern Fisheries Centre using a post=paid envelope. National Parks rangers returned accumulated batches of questionnaires at regular intervals. Information collected by Rasmussen (1988) during 1987 was also included in the analyses. Relative abundance or catch per unit effort (CPUE) was measured in terms of number of fish per angler per hour. When calculating an average CPUE for individual sites the minimum number angler records needed was arbitrarily set at 15.
Two techniques were used to estimate the number of anglers visiting the Park each year. The first involved extrapolating from the total number of questionnaires distributed using the average number of anglers per party. This assumes that all angling parties visiting the Park were issued with forms and that the average number of people in the parties which returned the questionnaires was the same as those which didn't complete the survey forms. The other method was to ask the rangers stationed permanently in the Park to estimate the number of visiting fishers using the records of visitation permits issued.
determine if there were statistical differences between sizes of fish caught each year. Not all questionnaires were fully completed so there may be discrepancies in the numbers given in, the various analyses.
RESULTS
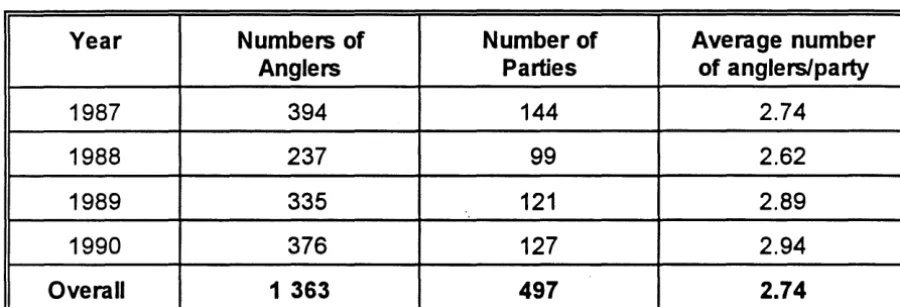
Visitor statistics. Summary statistics of angler groups participating in the survey are given in Table 1. As only small numbers of anglers were surveyed in 1986 and 1991 these years were only included in overall figures.
Table
1.
Year
1987
1988
1989
1990
Overall
Number of anglers, parties and anglers per party surveyed from 1987 to 1990. Seven of the parties did not give angler numbers so have been excluded. Data obtained in 1986 and 1991 have been included in the overall figures.
Numbers of Number of Average number
Anglers Parties of anglers/party
394 144 2.74
237 99 2.62
335 121 2.89
376 127 2.94
1 363 497 2.74
Over the four years 1987 to 1990, 491 forms were returned with an average return rate of 22%. Assuming that the average number of anglers per party for that period was 2. 7 4 then the total angler number can be extrapolated to about 6 120 or about 1 530 per year. The estimates made by National Parks staff ranged from 1150 to 2450 anglers per annum however they caution that these figures may be conservative as not all fishers who visit the Park obtain permits.
Table 2.
Year
1987
1988
1989
1990
Overall
Frequency of visits of anglers to the Park. Percentage of total annual visits is given in parentheses. Data for 1986 and 1991 have been included in the overall figures.
First Visit Number of visits per year
1 2 3 >3
209 (55) 91 (24) 37 (10) 29 (8) 12 (3)
139 (60) 45 (20) 30 (13) 10 (4) 7 (3)
157 (53) 48 (16) 42 (14) 24 (8) 24 (8)
189 (56) 66 (20) 56 (17) 8 (2) 19 (6)
701 (55) 257 (20) 166 (13) 76 (6) 76 (6)
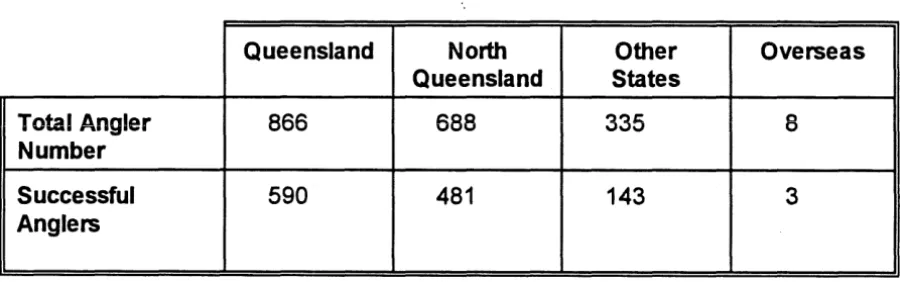
As expected, the majority of anglers (73%) came from Queensland with most of those (79%) from north Queensland (Table 3).
Table 3·. Origin of anglers who replied to the survey. Successful anglers were in a party which caught one or more barramundi.
Queensland North Other Overseas
Queensland States
Total Angler 866 688
335
8Number
Successful 590 481 143 3
Anglers
The chances that anglers in a party caught one or more barramundi was higher for Queensland (68%) and north Queensland residents (70%) than for interstate (43%) or overseas (38%) visitors.
Table 4. Number of persons visiting Lakefield National Park for fishing or other reasons.
Queensland Other Total
Primarily to fish 732 192 924
Other 147 160 307
No infonnation 23 0 23
Among the other reasons given for visiting the Park were bird watching, observing (other) wildlife, recreational camping, photography, sightseeing and bush walking.
Recreational Fishing Activity. Camping locations within the Park were sited either on freshwater waterholes or lagoons or upper tidal river reaches. To fish in estuarine or coastal environments requires boat access. About 65% of all parties had a boat of some form. An array of fish other than barramundi were caught in the estuarine habitats. These included mangrove jack (Lutjanus argentimaculatus), grunters (Pomadasys kaakan), threadfin salmon (Eleutheronema tetradactylum and Polydactylus sheridani), trevally (Caranx sp.), pikey bream (Acanthopagrus berda), fingermark (Lutjanus johnii) plus various sharks and rays. In freshwater, archerfish (Toxotes sp), tarpon (Mega/ops cyprinoides), sooty grunter (Therapon fuliginosus), sleepy cod (Oxyeleotris lineolatus), jewfish (Tandanus spp.), eels (Anguilla spp.) and long tom (Strongylura kreffti) were caught. Fork-tailed catfish (Arius spp.) were caught in both freshwater and estuarine habitats by nearly 45% of the parties surveyed. Unfortunately, these are among the less desirable of the angling species.
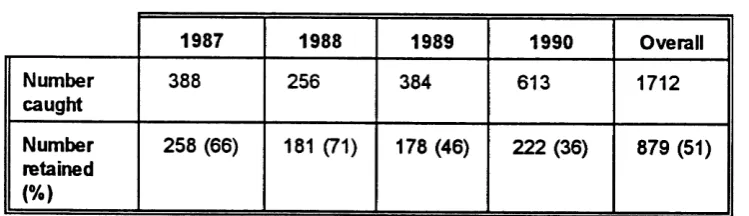
The most sought after angling species in both freshwater and estuaries was barramundi, Lates calcarifer. Of those visitors who came to the Park primarily to fish, 92% expected to catch a barramundi. The number of barramundi caught and number retained over the survey period is given in Table 5.
Table 5.
Number caught Number
retained
(%)
Number and proportion of barramundi caught and retained by anglers participating in the survey. Barramundi caught in 1986 and 1991 have been included in the overall figures.
1987 1988 1989 1990 Overall
388 256 384 613 1712
The decrease in the percentage of fish retained in 1989 corresponds to the introduction of revised management regulations which included an increase in the minimum legal size from 50 cm to 55 cm total length. Of the 1712 fish caught (Table 5), anglers supplied reliable length data on 894 (Table 6).
Table 6.
Number
Number, average total length and size range of barramundi caught over one period of the survey. Overall figures include 1986 and 1991 data.
1987
1988
1989
1990
Overall269 159 222 227 894
Average length 58.58 62.22 59.13 62.72 60.40
(± S.E.) (cm) (0.6) (0.9) (1.1) (1.0) (0.44)
Size range( cm) 34-85 38-110 25-100 31-115 31-115
Even though the average size of barramundi caught appears to have increased over the period of the survey (Table 6) there was no significant statistical difference between average annual lengths.
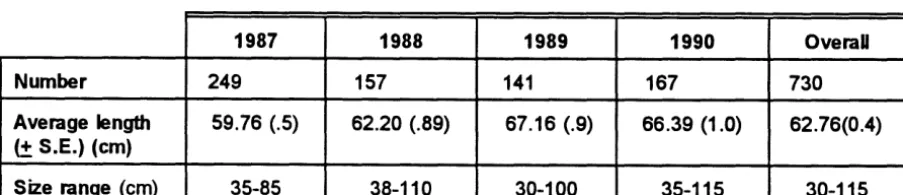
Catch retention. While the average length of the annual catch increased over the survey period, more importantly, the average length of retained barramundi also increased (Table 7, Fig. 2). There was no significant statistical difference between the lengths of fish retained over the four years.
Table 7.
Number
Number, average total length and size range of barramundi retained by fishermen over the period of the study. Overall figures include 1986 and 1991 data. Length data were not available for all fish recorded as being retained in Table 5.
1987 1988 1989 1990 OveraU
249 157 141 167 730
Average length 59.76 (.5) 62.20 (.89) 67.16 (.9) 66.39 (1.0) 62.76(0.4) (± S.E.) (cm)
Size range (cm) 35-85 38-110 30-100 35-115 30-115
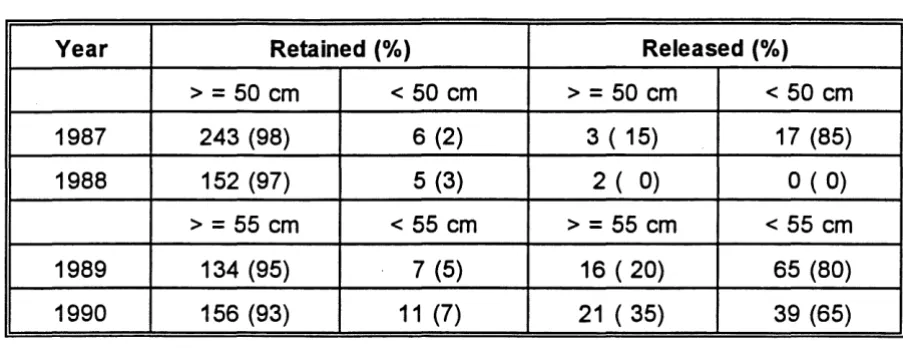
increased again to 58 cm in July 1992. Table 8 shows the proportions of fish in the various size ranges which were retained or released by the anglers.
Table 8.
Year
1987
1988
1989
1990
Number and proportion of fish above and below the minimum legal size which were released or retained. Data for 1987 and 1988 are incomplete.
Retained (%) Released (%)
>
=
50 cm < 50 cm >=
50 cm < 50 cm243 (98) 6 (2) 3 ( 15) 17 (85)
152 (97) 5 (3) 2 ( 0) 0 ( 0)
>
=
55 cm < 55 cm >=
55 cm < 55 cm134 (95) 7 (5) 16 ( 20) 65 (80)
156 (93) 11 (7) 21 ( 35) 39 (65)
With the introduction of the new minimum legal size of 55 cm in 1989 the proportion of undersized fish retained jumped slightly to 5% (1989) and 7% (1990). The fish in the 50 - 55 cm size class account for 4% (1989) and 2% (1990) of the net increase in numbers of undersized fish caught.
The average number of fish retained per angler was 0.68 with a minimum and a maximum of zero and six fish respectively. The average number of barramundi caught per angler per trip was 1.26 with a minimum and maximum of zero and 17 .5 respectively. With the average angler catching 1.26 fish per trip with a weight of 2.87 kg the annual recreational catch can be estimated at between 4.4 and 9.4 tonnes.
Maximum legal size. A maximum legal size of 120 cm was introduced for barramundi in Queensland in July 1992. This would have little effect on recreational fishing activities in the Park as the largest fish recorded in this survey was only 115 cm.
Table 9. Catch per unit effort (number of barramundi per angler per hour) over the period of the survey. Overall figures include 1986 and 1991 data.
1987 1988 1989 1990 Overall
Angler number 381 233 310 349 459
CPUE 0.06 0.08 0.10 0.10 0.09
Figure 3 shows seasonal changes in CPUE. No data are available for the closed season, November to January inclusive.
The CPUE was relatively high in February although this may be an artefact of the small sample size of only 13 anglers. The CPUE fell in March and then gradually increased to a peak in May. It then decreased for the remainder of the season. CPUE varied widely between study sites (Table 10, Fig. 1). The highest CPUE was 0.2 fish per angler per hour at the Twelve Mile Hole. This location was closed to all fishing for the three years prior to 1989. The first year it was reopened
(1989) the average CPUE was 0.24 dropping to 0.12 in 1990. There was no
apparent geographical relationship between site location and CPUE.
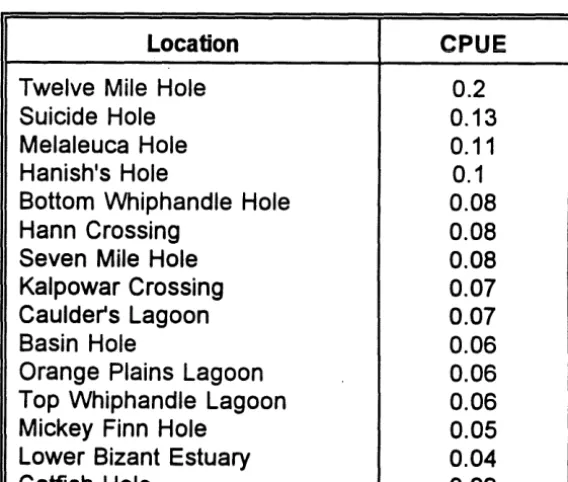
Table 10. CPUE's for fishing locations which were visited by more than 15
anglers in the survey, averaged for all years.
Location CPUE
Twelve Mile Hole 0.2
Suicide Hole 0.13
Melaleuca Hole 0.11
Hanish's Hole 0.1
Bottom Whiphandle Hole 0.08
Hann Crossing 0.08
Seven Mile Hole 0.08
Kalpowar Crossing 0.07
Caulder's Lagoon 0.07
Basin Hole 0.06
Orange Plains Lagoon 0.06
Top Whiphandle Lagoon 0.06
Mickey Finn Hole 0.05
Lower Bizant Estuary 0.04
The only true estuarine location included in Table 1 O was the Lower Bizant, which had the second lowest CPUE. Such estuarine locations do however produce considerable quantities of other recreational species (see Recreational Fishing Activity Section). About 8% of the total number of days spent fishing were in the estuarine reaches of the rivers and the remainder in the freshwater reaches and water holes. Only 88(10%) of the total numbers of barramundi caught came from estuaries.
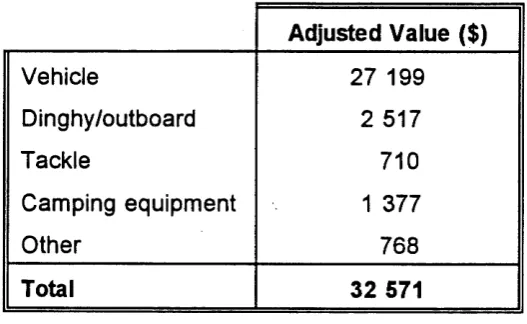
Capital equipment Table 11 gives the average capital investment needed by a party or individual to undertake a fishing trip to Lakefield National Park. All costs have been converted to real terms using 1991/92 as a base. The nearest large city, Cairns, has been nominally set as the starting point for all visits to the Park.
Table 11. Capital costs associated with fishing expeditions to Lakefield National Park, expressed in 1992 values.
Adjusted Value ($)
Vehicle 27 199
Dinghy/outboard 2 517
Tackle 710
Camping equipment 1 377
Other 768
Total 32 571
Operating costs. Costs of typical consumables used by a fishing party are given in Table 12. Fuel costs include the return journey from Cairns.
Table 12. Consumables used on an average fishing trip to Lakefield National Park, expressed in 1992 values.
Adjusted Value ($)
Fuel 240
Ice 29
Lures/tackle 44
Maintenance 165
Cost per fish. With an average party consisting of 2. 7 4 people (Table 1) catching 3.59 fish, and assuming that fishing is the only reason for the trips, the cost per angler to catch a barramundi was about $49.
DISCUSSION
. Fishing Effort. The abundance of fish in the freshwater areas inland of Princess Charlotte Bay as measured by angler catch rates has gradually increased from 0.06 fish per person per day in 1987 to 0.10 in 1990. Rasmussen (1988), who used data from survey questionnaires and supplemented it with information collected from a series of roadside surveys, calculated the catch rate at 0.09 fish per person per hour. In the Mary River area of the Northern Territory, Griffin (1988) found barramundi were caught at 0.12 fish/hour in 1986 as compared to 0.15 fish/hour in 1978179. These are comparable to the catch rates in the Lakefield fishery. The relatively low catch rates probably, in part, reflect the level of skill which is required to catch a barramundi. Inexperienced or occasional anglers simply do not have the equipment or technical skills to catch the equivalent number of fish that a more experienced angler would catch in the same circumstances.
Possession of a boat is only a slight advantage when fishing for barramundi at Lakefield. Parties who had a boat had a CPUE of 0.09 while those who didn't had an average CPUE of 0.08. A boat was a big advantage for general estuarine fishing. Fishing effort is seasonal, being restricted to the dry winter months by weather, road access into Lakefield and· ·by the closed season of November to January inclusive. The Park is often closed during periods of heavy monsoonal activity. The relatively high CPUE in February may be an artefact of the small number of anglers who visit the Park at this time of the year due to floods and access difficulties. Alternatively, it may also reflect a high component of skilled and dedicated anglers. The average CPUE remains relatively constant throughout the remainder of the year although there is a peak in May followed by a gradual decline. This may be a result of localised depletion of fish stocks in the isolated lagoons.
Work in the Northern Territory (eg. Davis 1986; Griffin 1987) suggested that inland waters are inhabited by mainly immature barramundi which have moved upstream during their first year. Similarly, in Lakefield National Park, yearling juvenile barramundi move upstream to colonise freshwater habitats (Russell and Garrett 1985). At maturity these fish undertake a spawning migration to coastal waters (Russell and Garrett 1985). Davis (1986) noted that fish which had moved to coastal areas from freshwater to spawn usually remained in tidal waters.
While first-time visitors to the Park accounted for the majority of respondents, a significant proportion (45%) visited the Park one or more times per year. As expected, most visitors came from north Queensland, and most came primarily to fish. A higher proportion of the successful anglers came from Queensland (68%) and north Queensland (70%) than interstate (43%) or overseas (38%).
While the study covered only four years in detail, the upward trend in CPUE must be viewed as encouraging. The CPUE values are roughly consistent with what has been obtained in barramundi fisheries in the Northern Territory (Griffin 1988). Complaints from anglers about the poor fishing may be a result of lack of skill, natural variation in fish numbers, unreasonable expectations or climatic and other factors rather than indicative of overfishing. It must be acknowledged that catching this particular fish does require a reasonable level of skill and fishing knowledge.
Economics. Capital investment necessary to travel to Lakefield to fish was relatively high averaging about $32 500 per party of approximately 3 people. In addition, each fishing party spent nearly $500 in consumables during their trip making each fish caught worth around $49. Rutledge et al. (1990) concluded that the value of the recreational barramundi fishery to the Queensland economy was between $AB and $A 15 million per annum. Using similar methods it can be calculated that the value of the Lakefield recreational barramundi fishery in direct terms to the local economy is between $A 200 000 and $A 430 000.
Implications for management In general, the management strategies in place for the fishery appear to be largely respected and seem to be having a positive impact on the barramundi resource. The following can be concluded about individual management measures:
a. Minimum legal size: While there appear to be a few breaches of the minimum legal size regulation for barramundi each year the vast majority of fish caught and retained were legal. A slight increase in the number of undersized fish retained in 1989 may simply have been a result of confusion or ignorance about the newly increased size limit. It is noteworthy that many of the fish being released are above the size limit, perhaps indicative of a growing trend towards capture and release in the recreational fishing community.
b. Maximum legal size: Most large adult fish are resident in estuarine and coastal waters, not in freshwater where most of the recreational activity occurs. The proposed maximum legal size should have only minimal effect on the fishery.
d. Closed season: The isolated nature of the Park and inclement weather conditions during the period of the closed season makes breaches relatively uncommon by the recreational fishing fraternity.
e. Area closures: Given the migratory nature of the fish and the existing fisheries management strategies described above, the long or medium term benefits of temporarily closing specific lagoons or waterholes to fishing on solely biological grounds must be questioned. There is evidence of short-term benefit however, with the Twelve Mile Hole giving a relatively high CPUE (0.24) in 1989, the first year of fishing after a three year closure. Depending on their age, most barramundi present in this waterhole at the start of the 1989 fishing season would not have been subjected to any exploitation.
Continued fishing effort in the Twelve Mile Hole resulted in the halving of CPU E to O .12 in 1990, which was only slightly more than the overall average (0.09). It would be expected that closures over a longer period would have a similar result although close monitoring of such a closure was not done during this study and would be a useful exercise.
REFERENCES
Davis, T.LO. (1986). Migration patterns in barramundi, Lates calcarifer (Bloch), in Van Diemen Gulf, Australia with estimates of fishing mortality in specific areas. Fisheries Research, 4, 243-58.
Griffin,
R.K.
(1982). A survey of amateur angling for barramundi (Lates calcarifer) in the Northern Territory. Northern Territory Dept. Primary Production Technical Report No. 2, 23 pp.Griffin,
R.K.
(1987). Life history, distribution and seasonal migration of barramundi, Lates calcarifer (Bloch) in the Daly River, Northern Territory, Australia. In "Proceedings of International Symposium on Common Strategies of Anadromous and Catadromous Fishes". American Fisheries Society Symposium No. 1 (Eds M.J. Dadw~ll, R.J., Klauda, C.M. Moffitt and R.L. Saunders), pp. 14-25.Griffin,
R.K.
(1988). Recreational fishing for barramundi in the Arnhem Highway Area. Report of 1986/87 surveys. Northern Territory Dept. Primary Industry and Fisheries, Fishery Report No. 17, 27 pp.Rasmussen, l.R. (1988). Report on a survey of recreational fishing in Lakefield National Park, North Queensland, during 1987. Queensland Dept. Primary Industries, Fisheries Research Branch Technical Report No. 88/14, 14 pp.
Rutledge. W., Rimmer, M., Russell, D.J., Garrett, R., and Barlow, C. (1990). Cost benefit of hatchery-reared barramundi, Lates calcarifer (Bloch), in Queensland. Aquaculture and Fisheries Management, 21, 443-48.
Figure 1.
Figure 2.
Figure 3.
FIGURE LEGENDS
Map of Lakefield National Park showing major fishing locations.
Stacked bar histograms showing sizes of fish released and retained by recreational fishermen over the years of the survey.
APPENDIX 1. DEPARTMENT OF PRIMARY INDUSTRIES FISHERIES DIVISION
LAKEFIELD NATIONAL PARK RECREATIONAL BARRAMUNDI FISHING SURVEY
1 . Date of trip:
2. Number of anglers in your group: _ _ _ _ _ _ anglers.
3. Duration of stay at Lakefield: _ _ _ _ _ _ days.
4. Fishing location• (use waterhole name from reverse of this form).
Location Name Days fished No. of barra caught Location Name Days Fished No. of barra caught
5. Barramundi Catch:
a. Average daily fishing hours per angler: _ _ _ _ _ _ hours.
b. Total number of Barramundi caught: _ _ _ _ _ _ r .. h. c. Number of Barramundi retained: _ _ _ _ _ _ fish.
(Please fill in the table for each Barramundi in order caught).
1 2 3 4 5 6 7 8 9 10
Length (cm)
Weight (kg)
Retained YIN YIN YIN YIN YIN YIN YIN YIN YIN YIN
6. Other fiah caught (please indicate species and number, eg. Catfish, 2; Grunter, 3).
7. Costa (please supply an estimated value of vehicles, equipment and consumables uaed on the trip).
Capital $ Capital $
Vehicle Fuel
Dinghy and motor Ice
Tackle Replacement lures
Camping Vehicle maintenance
Other Other
8. Reason• for visiting Lakefield (each angler is to fill in a column). Please insert or circle appropriate response.
Anglers Name (use first name) eg. 1 2 3 4 5 6
Primarily to fish? yes/no yes/no yes/no yes/no yes/no yes/no yes/no
Did you expect to catch a yes/no yes/no yes/no yes/no yes/no yes/no yes/no
Barramundi7 '
How many·timea a year do First First First First First First First
you visit Lakefield? (If first 1234 123 4 1234 1234 1234 1 2 3 4 1234
visit circle first). or more or more or more or more or more or more or more
What is your home postcode 7
0 5
Princess
Charlotte
Bay
10 15 20 25
Kilometers
N
Melaleuca Wllerhole
Hanish Wl1erhole
Natirnal Park
Queensland
Q 3QO
Kibne1ers
• Ranger Stations
Cooktown
Cai ms
o Fishing Locations
i
Minimum Legali
80 1987 Length
70
60
II
50 Released
40
mIJ
30 Retained
:!O
10
0
10 20 30 40 50 60 70 Ii() 90 100 110 110
80 1988
70
i
60 50 .to 30 20:>..
10u
~ 0
60 70 8() 90 I()() 110 t.:?O
10 20 30 40 50
(1)
::::s
~
(1) 80
1989
~
~ 70
60 50 40 30 :!O 10 0
10 JO 30 40 50 60 70 llO 90 (()() 110 110
RO 1990
70 60 j() .to 30 :!O 10 0
10 JO 30 40 j() 60 100 110 110
O.~
0.45
0.40
0.35
OJ)
5
0.25
0.20
0.15
0.10
0.05
0.00-..---.---..----.---.---.---.---.----~---,