National Conference on 'Advanced Analytical Tools for Materials Characterization' (AATMC-2018) © 2018 IJSRSET | Volume 5 | Issue 4 | Print ISSN : 2395-1990 | Online ISSN : 2394-4099 Themed Section: Science and Technology
Copper Oxide Nanoparticles : Synthesis and Characterization
Himanshu Narayan1 *, Hailemicheal Alemu2, Lineo F. Maxakaza2 , Sandesh Jaybhaye31 Department of Physics & Electronics, National University of Lesotho, Roma, Lesotho
2 Department of Chemistry & Chemical Technology, National University of Lesotho, Roma, Lesotho
3 Nanotech Research Lab, Department of Chemistry, Birla College, Kalyan, India
ABSTRACT
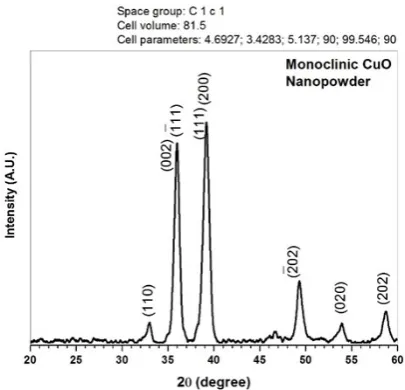
We report the synthesis of copper oxide (CuO) nanoparticles from Cu(NO3)2 through wet chemical precipitation method. Characterization was done by X-ray diffraction (XRD) analysis, scanning electron microscopy (SEM), particle size analyzer and Fourier transform infra-red spectroscopy (FTIR). Two most prominent peaks in XRD profile, around 2 = 35.9° and 39.2°, which are combinations of double-reflections {(002) and (-111)} and {(111) and (200)}, respectively, are characteristics of monoclinic CuO. Unit cell parameters determined through Reitveld analysis of XRD data under FullProf Software Suite were: a = 4.6927, b = 3.4283 and c = 5.137 Å, with = = 90° and = 99.546° for monoclinic Cc space group. Moreover, crystallite size estimation from XRD data using Debye-Scherrer formula produced average size of 34 nm for the nanoparticles. However, the particle size analyzer measured the average grain-size as 86 nm. Therefore, it was concluded that each grain of the nano-sized CuO seemed to be made up of roughly 16 crystallites. SEM pictures showed uniform distribution of ice-glass like crystalline particles, which are agglomeration of smaller particles. FTIR results showed expected peaks corresponding to Cu-O stretching. As a potential application as carbon paste electrode (CPE) modifier, the electrocatalytic efficiencies of CuO nanoparticles are being investigated. Keywords: Copper oxide; Nanoparticles; Wet chemical precipitation; X-ray diffraction
I.
INTRODUCTION
In the past few decades, nanoparticles of a variety of shapes, sizes and compositions, have been discovered. Many of them are with excellent conductivity and fascinating catalytic properties that make them suitable for constructing novel electrochemical sensors. Nanostructured transition metal oxides have attracted considerable attention from researchers in the recent years. Copper (II) oxide, CuO, also known as cupric oxide is a p-type semiconductor with a bandgap of 1.2 – 1.9 eV. It is a black transition metal oxide with monoclinic crystal structure and many interesting characteristics, e.g., high thermal
conductivity, photovoltaic properties, high stability and antimicrobial activity. Because of such useful properties, CuO has been investigated extensively for its wide range of potential applications, such as, in electrochemical cell, gas sensors, magnetic storage devices, field emitters and in catalysis [1]. Nanocomposites are known for significantly improving the electrocatalytic properties of substrates, decrease the overpotential, increase the reaction rate and improve reproducibility of the electrode response in the area of electroanalysis [2,3,4].
method, using Cu(NO3)2 and 1,10-phenanthroline as precursors, and ethanol/water mixture and NaOH as a reducing agents. Characterization of the synthesized CuO nanoparticles have been done by X-ray diffraction (XRD), Fourier Transform Infra-Red spectroscopy (FTIR), thermogravimetric analysis (TGA) and particle-size analysis.
II.
METHODS AND MATERIAL
Synthesis of CuO nanoparticles:
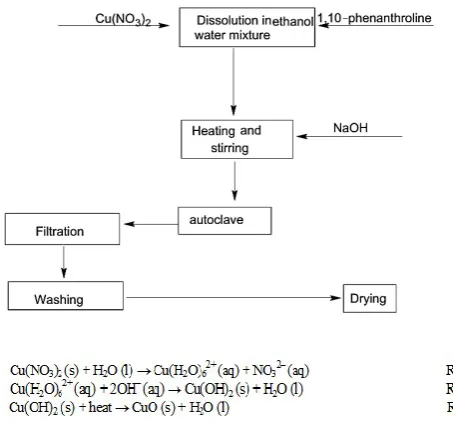
NaOH was obtained from ACE (South Africa), 1,10-phenanthroline from Saarchem (South Africa), ethanol from Laboratory & Analytical Suppliers Co. (Pty) Ltd (South Africa). All reagents were used as received and ultra-pure water was used throughout. Phosphate buffer of pH 7 (supporting electrolyte was prepared from stock solution of 0.1 M disodium hydrogen phosphate and 0.1 M HCl. Cu(NO3)2 3 mM and 1,10-phenanthroline 6 mM were prepared in 1:1 ethanol/water mixture. 2 M NaOH aqueous solution was then added to the solution under magnetic stirring and heating. The alkaline solution was transferred into an autoclave. The autoclave was then sealed and maintained at 160 oC for 24 h. The solution was then cooled to room temperature; the black precipitates were filtered, washed with water and absolute ethanol for several times and then dried in an oven at 50 °C.
Figure 1 shows the synthesis route and reactions for the preparation of CuO nanoparticles. In reaction R1, water displaces the nitro group because it is a stronger ligand, resulting in a blue complex of Cu(H2O)62+. The same is true for reaction R2 [7]. 1, 10-phenanthroline is an organic compound that enhances formation of individual nanowires, a flower of nanowires agglomerated together would otherwise result if it was not used. It does not take part in the chemical synthesis of the reaction.
Figure 1. Synthesis route of CuO nanoparticles and chemical reactions.
Characterization and measurements:
X-ray diffraction measurements were executed with a Shimadzu D6000 Diffractometer (from Shimadzu, Japan) using Cu Kα radiation (λ = 1.5406 Å) in the 2θ range from 20° to 60°. Scanning electron microscopy (SEM) was carried out on a Zeiss crossbeam series with Gemini FESEM unit. Fourier transform infra-red (FTIR) spectroscopy was carried out with Shimadzu FTIR, run from 400 cm-1 to 4000 cm-1 using diffuse reflection method, and KBr pellet was used for background measurement. Thermogravimetric analysis (TGA) was carried out with SDT 2960 Simultaneous DSC-TGA, TA Instruments from 24°C to 700°C at a ramp of 10°C/min. Particle size analysis was performed using Microtrac/Nanotrac TM150, which employs optical light scattering of particles suspended in water.
III.
RESULTS AND DISCUSSION
were identified as combinations of double-reflections {(002) and (-111)} and {(111) and (200)}, respectively, are characteristics of CuO. Further the acceptable FullProf solution after several trails produced monoclinic unit-cell with Cc space group and cell parameters: a = 4.6927 Å, b = 3.4283 Å, c = 5.137 Å, = 90, = 99.546 and = 90. These results are in very good agreement with the already reported single crystal data for CuO [5]. It is also noteworthy that the actual peaks recorded for the CuO nanopowder are apparently shifted approximately by +0.3° of 2 value, which may be tentatively attributed to the strains within the crystallites.
Figure 2. X-Ray Diffraction spectrum of CuO
nano-powder.
Particles size analysis:
Average crystallite size of 34 nm for the CuO nanoparticles was estimated using Debye-Scherrer method. FWHM of the Gaussian best-fit to prominent peaks in the XRD data was used in the formula. Though this method has its own limitations, it immediately gives a rough estimation of the size without much effort. Since the X-rays penetrate through the surface of the particles, what is measured here is the size of small crystallites within the grains that diffract X-rays coherently [8].
On the other hand, the grain-size was measured on a particle size analyzer. A solution of copper oxide was
prepared with pure water and agitated in an ultrasonic bath to obtain an evenly dispersed solution. Instrument was set to zero using the solvent (water) then the CuO solution was filled in the cell and measured. Distribution of grain-size obtained is shown in Figure 3. The mean grain size of CuO nanoparticles was determined to be 86 nm by the particle size analyzer, which measures the average diameter of the grains using light as a probe. Obviously, light cannot penetrate through the surface and therefore, this method gives the size of individual grains that could possibly be made up of several crystallites.
A comparison of volumes created by the two sizes reveals that apparently each grain consists of approximately 16 crystallites, on an average.
Figure 3. Particle size distribution of CuO
nanoparticles.
Scanning electron microscopy:
Figure 4.
SEM pictures of CuO nano-particles.
FTIR and TGA:
FTIR spectrum of CuO nanoparticles is shown in Figure 5. Characteristic peaks of CuO range from around 400 cm–1 to 1000 cm–1. Peaks around 420 cm–1, 500 cm–1 and 610 cm–1 can be assigned to Cu–O stretching along [–202] Cu–O direction. Small sharp peak around 450 cm–1 is attributed to Cu–O stretching along [202] direction. The peak around 2300 cm–1 can be assigned to CO2 stretching, which could have been entrapped in the sample holder during packing. The broad peak around 3500 cm–1 is due to O–H stretch and bending from adsorbed water.
Thermogravimetric analysis of 8.4 mg of CuO nanoparticles was run from 24 °C to 700 °C at a ramp of 10 °C/min (picture not shown). It shows that in the temperatures range of 80 – 140 °C, the percentage weight loss with temperature is about 1.0 %. This can be attributed to loss of adsorbed water and ethanol, 2.0 % weight loss around 260 – 340 °C with is attributed to loss of hydroxyl ions. Weight percentage remains fairly constant above 500 °C, thus most impurities were lost at this temperature. The total
weight loss is about 3 %. It can therefore be concluded that CuO nanoparticles are stable at elevated temperatures.
As a potential application, electrochemical responses of carbon-paste electrodes modified with CuO nanoparticlesare being investigated for the detection of ascorbic acid, atenolol, diclofenac, dopamine, hydrazine and glucose using the method of cyclic voltammeter. The results will be published elsewhere.
Figure 5.
IR spectrum of CuO nanoparticles.
IV.
CONCLUSIONparticles. FTIR results showed stretching of Cu-O bonds as expected.
Electrochemical properties of CuO nanoparticles as carbon paste electrode modifier are being investigated against electrochemical oxidation of ascorbic acid, atenolol, diclofenac, dopamine, hydrazine and glucose using cyclic voltammetry. The initial results seem to be very promising.
V.
REFERENCES1. Y. Aparna, K.V. Enkateswara Rao and P. Srinivasa Subbarao; Synthesis and characterization of CuO nano particles by novel sol-gel method; 2012 2nd International Conference on Environment Science and Biotechnology IPCBEE vol. 48 (2012) IACSIT Press, Singapore 156-160. DOI: 10.7763/IPCBEE. 2012. V48. 30
2. Hadi Beitollahi, Susan Ghofrani Ivari and Masoud Torkzadeh-Mahani; Voltammetric determination of 6-thioguanine and folic acid using a carbon paste electrode modified with ZnO-CuO nanoplates and modifier; Mater. Sci. Engineering C 69 2016 128–133.
3. Rinkesh Kurkure, Sandesh Jaybhaye; Synthesis of Copper / Copper Oxide nanoparticles in eco-friendly and non-toxic manner from floral extract of Hibiscus rosa-sinensis; J. Bio-Nano Frontier 9 (2) 2016 105-10.
4. Rinkesh Kurkure, Sandesh Jaybhaye, Abhijeet Sangale; Synthesis of copper/copper oxide nanoparticles in ecofriendly and nontoxic manner from floral extract of Caesalpinia pulcherrima; Int. J. Recent Innovation Trends Computing Commun. (IJRITCC) 4 (4) 2016 363-366. ISSN: 2321-8169. 5. J.D. Lee; Concise Inorganic Chemistry; 5th Ed,
Blackwell Science, UK 1996 pp. 827-831. https://doi.org/10.1063/1.3610496.9.
6. Himanshu Narayan, Hailemichael Alemu, Pusetso F. Nketsa, Toka J. Manatha and Madhavi Thakurdesai; Synthesis and structure of some
nano-sized rare-earth metal ions doped potassium hexacyanoferrates; Physica E 69 2015 127-132. 7. S. Asbrink and A. Waskowska; CuO: x-ray
single-crystal structure determination at 196 K and room temperature; J. Phys.: Cond. Matter 3 1991 8173-8180.