Mitochondrial DNA control region analysis
of three ethnic populations in lower Northern
part of Thailand
U. Suyasunanont1, M. Nakkuntod1 and S. Mirasena2,3
1Department of Biology, Faculty of Science, Naresuan University, Phitsanulok, Thailand
2Department of Biochemistry, Faculty of Medical Science, Naresuan University, Phitsanulok, Thailand
3Centre of Excellence in Medical Biotechnology, Faculty of Medical Science, Naresuan University, Phitsanulok, Thailand
Corresponding author: S. Mirasena E-mail: saisirim@nu.ac.th
Genet. Mol. Res. 16 (3): gmr16039687 Received March 29, 2017
Accepted May 23, 2017 Published July 6, 2017
DOI http://dx.doi.org/10.4238/gmr16039687
Copyright © 2017 The Authors. This is an open-access article distributed under the terms of the Creative Commons Attribution ShareAlike (CC BY-SA) 4.0 License.
showed less genetic diversity than those living in their original area. The neutrality testing suggested that the result might be influenced by genetic drift.
Key words: Mitochondrial DNA; Hypervariable region; Haplotypes; Ethnic populations; Thailand population
INTRODUCTION
The population of Thailand is an admixture of various races and cultures. Many populations from the neighboring countries migrated into this region by forces of war or political issues; Thailand was called “Siam” until the name was changed to Thailand in 1949 A.D. (Keyes, 2002). The populations are different in physical characteristics, languages, religions, modes of living, and genetic structures. Many ethnic populations were distributed over the region, i.e., the lower northern part of Thailand, especially Phitsanulok Province (Satapanawattana et al., 2011). The native Thai (Thai-Siam) who spoke central-Thai dialect with different accents were identified and their geographical areas were mapped, according to linguistic characterization (Ngourungsi et al., 1976). Moreover, Lao Song (Thai Song Dam) and Hmong are examples of populations who migrated to Thailand a long time ago and inhabited Phitsanulok Province (Goldstein and Goldstein, 1986). Lao Song, the Tai-Kadai speaking population, is one of the minority groups living in the area near the border of Southern China, Laos, and Vietnam for more than 200 years (Schliesinger, 2001). They migrated to Thailand in the early Rattanakosin period (1778-1779 A.D.). The first wave of Lao Song colony came to the central part of Thailand - Phetchaburi, Suphan Buri, and Nakhon Prathom provinces. They then traveled upwards to Phitsanulok Province in the lower northern part of Thailand during the 1890s (Srising, 1976). Hmong (a hill tribe) is one of the Hmong-Mian ethnicities once inhabiting China. During the Indo-China conflict, they were forced to abandon their land and move to the northern part of Laos and Vietnam, where they were affected by the war going on at the time. Hmong then continued their migration to several areas in the northern part of Thailand, and some part of the population settled in Phitsanulok Province (Schliesinger, 2000).
control region, also called as displacement loop (D-loop). HVR-1 is at position 16,024-16,365 (342 bp), HVR-2 is at position 73-340 (268 bp), and HVR-3 is at position 438-574 (137 bp). A higher mutation rate is noted in the D-loop than in other regions in the mtDNA (Ingman et al., 2000), and can be used as a genetic marker to trace the maternal ancestors of populations that lived approximately 200,000 years ago (Behar et al., 2008). The HVRs are the key to reveal the genetic structure and relationship within and between populations (Zimmermann et al., 2009; Tillmar et al., 2010). HVR-1 contains more polymorphic sites than others do, and therefore, provides higher discrimination power for individual identification in forensic science applications (Meyer et al., 1999).
While there are various ethnicities in Thailand, information about the population structure of mtDNA is still limited. Few studies were conducted in northern and northeastern part of Thailand (Fucharoen et al., 2001; Zimmermann et al., 2009; Kutanan et al., 2014). They mostly focused on hill tribes - Tai-Kadai, Thai-Isan, and Mon-Khmer (Kutanan et al., 2011; Boonsoda et al., 2013; Kutanan et al., 2014). In this research, we focused on the genetic structure of the three populations - Thai Siam, Lao Song, and Hmong - inhabiting Phitsanulok Province in the lower northern part of Thailand. The HVRs of mtDNA were used as molecular markers to trace maternal ancestors of populations. The genetic diversity and relationship within and between populations were also investigated. The genetic history and evolutionary forces which affected the population structures were discussed.
MATERIAL AND METHODS
Sample collection
After the protocol was approved by Naresuan University Human Ethical Committee (COA No. 211/2015), the ethnicity of populations was explored. The dialect, culture, and population history were used to categorize the ethnicity. The volunteers were explained about the details of research and signed consent form was obtained. The family and migration history were obtained via questionnaires and personal interviews. A translator was used if the volunteers could not clearly understand our language (in case of Hmong). Three milliliters blood samples were collected from 109 unrelated individuals. They were 53 Hmongs from Hmong village in Nakhon Thai district (Lat. 16.8124112, Long. 100.9695965), 29 Lao Songs from Bang Rakam district (Lat.16.6367235, Long.100.1505811), and 27 Thai-Siams from Phrom Phiram district (Lat.17.1669996, Long. 100.0945124) (Figure 1). The collection process and data storage were done according to the human ethical protocols.
DNA analysis
Genomic DNA was extracted using PureLinkTM Genomic DNA kit (Invitrogen;
Thermo Fisher Scientific, M.I., U.S.A.). The entire sequences of D-loop HVR of mtDNA were amplified using primers F15878 (5'-AAA TGG GCC TGT CCT TGT AG-3') and R649 (5'-TTT GTT TAT GGG GTG ATG TGA-3') (Brandstätter et al., 2004). The PCR mixture consisted of 2 μL DNA template, 1X OnePCRTM (GeneDirex; Keelung, Taiwan), and 200 μM
Purification kit (Invitrogen) and sequenced by BigDye® Terminator v3.1 cycle sequencing kit
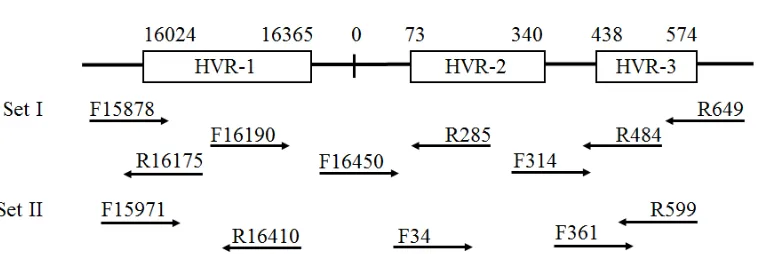
(1st BASE, Singapore). Series of 8 overlapping PCR-amplified primers set-I - F15878, R649, F16190 (5'-CCC CAT GCT TAC AAG CAA GT-3'), R16175 (5'-TGG ATT GGG TTT TTA TGT A-3'), F16450 (5'-GCT CCG GGC CCA TAA CAC TTG-3'), R484 (5'-TGA GAT TAG TAG TAT GGG AG-3'), R285 (5'-GTT ATG ATG TCT GTG TGG AA-3'), and F314 (5'-CCG CTT CTG GCC ACA GCA CT-3') - were used for the determination of D-loop hypervariable sequences. In case of mutation or polymorphisms at the primer binding site or incomplete sequence, the primer F15971 (5'-TTA ACT CCA CCA TTA GCA CC-3') and R599 (5'-TTG AGG AGG TAA GCT ACA TA-3') were used. The PCR mixture consisting of 2 μL DNA template, 1X OnePCRTM (GeneDirex), and 200 μM each primers were carried out in a 50-μL
total volume. PCR was performed using the following conditions: 95°C for 10 min; 36 cycles of 94°C for 30 s, 56°C for 30 s, and 72°C for 1 min; and 72°C for 5 min. The overlapping primer set-II - F15971, R599, R16410 GAG GAT GGT GGT CAA GGG A-3'), F34 (5'-GGG AGC TCT CCA TGC ATT TGG TA-3'), R599 (5'-TTG AGG AGG TAA GCT ACA TA-3'), and F361 (5'-ACA AAG AAC CCT AAC ACC AGC-3') - was used (Irwin et al., 2007) (Figure 2). The generated sequences of each sample were assembled using the MEGA7 software (Kumar et al., 2016). To ensure the quality of sequences, the consensus sequences were generated twice and both of consensus sequences were compared to generate the final sequences. The nucleotide positions of the mtDNA control region were numbered according to the revised Cambridge Reference Sequence (rCRS) (Andrews et al., 1999).
Statistical analysis
The mtDNA control region sequences from position 16,024-16,569 and 1-576 were analyzed. MEGA7 (Tamura et al., 2013) was used to identify variable sites (v), parsimony-informative sites (pi), and singleton (s). The percentage of v, pi, and s was calculated by number of sites divided by range of nucleotide in each regions. The percentage of mutations - transitions (ts), transversions (tv), insertions-deletions (in/del) - were calculated by number of mutations divided by number of variable sites in each region. DnaSP ver.510.1 software (Librado and Rozas, 2009) was used to calculate the number of haplotype, haplotype diversity (Hd), and nucleotide diversity (πi). Neutrality estimator, Fu’s Fs (Fu, 1997) and Tajima’s D (Tajima, 1989), and genetic distance within and between groups were calculated using the number of nucleotide diversity.
RESULTS AND DISCUSSION
Variation in mtDNA control regions
One hundred and nine sequences from unrelated individuals were aligned and compared with rCRS reference sequence. The D-loop control region from position 16,024-16,569 and from 1-576 (1130 nucleotides) was analyzed. One hundred and sixty-one variation sites (14.25%) were found (Table 1). Ninety-six parsimony-informative sites (8.5%) and 61 singletons (5.40%) were noted. The HVR-1 contained the highest number of variable and parsimony-informative sites. One hundred and sixty-two mutational sites were counted, consisting of 137 transitions and 26 transversions. The combination of transitions and transversions were found at 7 sites. This result indicated that transitions were common in the entire control region, but transversions were more frequent in HVR-3 than in other regions. The ratio of the transitions to transversions was approximately 5:1. However, the ratio of the transitions to transversions in HVR-1 was 9:1, which was lower than that reported in a previous report on Thai population (12:1) (Sangthong et al., 2015). This ratio revealed the mutation that is accumulated in isolated populations.
them were A→C followed by C→A. Four insertion/deletion (in/del) positions were found at position 249 (A-deletion), 512 (ACAC-insertion), and 524-525 (CC-deletion).
Table 1. Distribution of variable sites and mutations in HVR of mtDNA control regions in the three ethnic populations in Phitsanulok Province (N = 109).
HVR-1 HVR-2 HVR-3 between HVR Total Position 16,024-16,365 73-340 438-576 16,366-16,371
341-437
Range (bp) 342 268 137 373 1130
Var. sites (%) 76 (22.22) 42 (15.67) 22 (16.06) 21 (5.63) 161 (14.25) Par-Info. (%) 59 (17.25) 20 (7.46) 10 (7.30) 7 (1.88) 96 (8.50) Singletons (%) 18 (5.26) 18 (6.72) 11 (8.03) 14 (3.75) 61 (5.40) Transitions (%) 72 (94.74) 35 (83.33) 10 (45.45) 19 (90.48) 137 (85.09) Transversions (%) 8 (10.53) 6 (14.29) 10 (45.45) 2 (9.52) 26 (16.15)
in/del (%) 0 1 (2.38) 3 (13.64) 0 4 (2.48)
The poly-C (or C-stretch) was found around positions 16,184-16,193 and 303-309. However, they were reported as common length heteroplasmy sites in several populations (Brandstätter et al., 2004; Ramos et al., 2013). In this report, the poly-C positions were then excluded during haplotyping and statistical analysis. Point heteroplasmy was found in only one sequence at position 311(C→Y) in the Lao Song population. However, 2 individuals in Thai-Siam population were characterized with position 311 heteroplasmy, but they were not included in this result because of low quality of DNA sequences due to length heteroplasmy at position 309. There were the heteroplasmy hotspots, mostly in HVR-1 (Irwin et al., 2009), but not at position 309. The ACAC-insertion at position 512 was also reported as length heteroplasmy (Ramos et al., 2013). In this study, there were 4 individuals with ACAC-insertion, but no heteroplasmy was noted.
The frequency distribution of mutation at each variation site showed a similar pattern in all populations (Figure 3). Some positions, particularly HVR-1, showed higher frequency of mutation (>0.100) in all the three ethnic populations (Table S1). The positions at which mutational frequency was over 0.3 were 16,223; 489; 523; 524; and 525. The latter four positions were in HVR-3. The distinctively high mutational frequency positions were 73 (A→G) and 263 (A→G) with frequency 1.00 and 0.991, respectively. A previous study
Table 2. Observed mutations in 1130 nucleotides of mtDNA control region in the studied populations (N = 109).
Base substitutions 1108 %
Transitions 990 89.35
A→G 275 24.82
G→A 98 8.84
T→C 399 36.01
C→T 218 19.68
Transversions 118 10.65
A→C 75 6.77
A→T 1 0.09
G→C 2 0.18
G→T 0 0.00
T→A 1 0.09
T→G 0 0.00
C→A 23 2.08
C→G 16 1.44
Deletions 115 10.38
Insertions 4 0.36
reported that position 263A of rCRS was a rare polymorphism (Andrews et al., 1999), but the data for position 73 is still lacking.
Haplotype analysis
Within the three ethnic populations, 86 haplotypes were found, out of which 73 were unique (Table 3 and Table S2). The Thai-Siam population showed the highest percentage of unique haplotypes (85.19%). No shared haplotype was found between populations. It might indicate that each population had different maternal genetic structure. In Hmong population, 9 shared haplotypes were found with high frequencies (Table 4). The obviously high-frequency haplotypes in Hmong are Haplotype 17 (0.094) and 34 (0.075). This result indicated the close relationship of maternal lineage in Hmong population. Two shared haplotypes were found in Lao Song and Thai-Siam populations. The overall highest frequency haplotype in populations was Haplotype 37, found in the Lao Song population. This haplotype contained ACAC-insertion at position 512 in HVR-3. All 4 individuals who had Haplotype 37 had maternal migration history from Nakhon Prathom Province in the central part of Thailand. This insertion was reported as heteroplasmy; as mentioned before, several reports suggested that numerous heteroplasmy sites might be eliminated from populations by genetic drift. However, this result suggested that the ACAC-insertion might be a unique pattern found in Lao Song population and might be capable of identifying this population.
Table 3. Numbers of haplotypes, as well as unique and shared haplotypes, observed in the three ethnic populations. N Haplotypes Unique haplotypes (%) Shared haplotypes (%)
Hmong 53 36 27 (50.94) 9 (16.98)
Lao Song 29 25 23 (79.31) 2 (6.90)
Thai-Siam 27 25 23 (85.19) 2 (7.41)
Total 109 86 73 (66.97) 13 (11.93)
Table 4. Frequencies of haplotypes in the three ethnic populations. Number of samples of Hmong, Lao Song, and Thai-Siam populations were 53, 29, and 27, respectively.
Shared haplotypes Ethnicity Numbers Frequencies
Haplotype 1 Hmong 2 0.038
Haplotype 14 Hmong 3 0.057
Haplotype 17 Hmong 5 0.094
Haplotype 18 Hmong 3 0.057
Haplotype 28 Hmong 2 0.038
Haplotype 31 Hmong 3 0.057
Haplotype 33 Hmong 2 0.038
Haplotype 34 Hmong 4 0.075
Haplotype 36 Hmong 2 0.038
Haplotype 37 Lao Song 4 0.138
Haplotype 60 Lao Song 2 0.069
Haplotype 62 Thai-Siam 2 0.074
Haplotype 79 Thai-Siam 2 0.074
The diversity parameters of mtDNA control region haplotype in the three ethnic populations are presented in Table 5. The insertion and deletion sites were ignored (Tillmar et al., 2010; Jankova-Ajanovska et al., 2014). There were 1119 positions in the final dataset. The average number of nucleotide differences (k) was approximately 13. The Thai-Siam population showed the highest haplotype diversity (Hd). The nucleotide diversity (πi) varied
from 0.01130 to 0.01174.
A previous report on the Hmong population in China, the original habitat of Hmong, revealed that the Hd varied from 0.937 to 1.000, which was consistent with the Hmong population Hd observed in this study. Meanwhile, πi of Hmong population in this report was relatively low when compared to that in a similar report, which varied from 0.00174 to 0.00218 (Wen et al., 2005). Lao Song population in this study revealed lower percentage of unique haplotype as compared to that in Suphan Buri (92.0%, N = 25), where their first wave colonized (Fucharoen et al., 2001). The evidence of migration of these 2 populations resulted in a decrease in genetic diversity by founder effect. Additionally, there were higher values of genetic diversity in the Thai-Siam population who had no history of migration.
The Tajima’s D and Fu’s Fs were estimated to prove the null hypothesis of neutrality of genetic effect. The negative values of both parameters in all populations suggested that they were evolved without selective effect and growth in constant population size. The evolution of population was influenced by the founder effect of population expansion.
Most of the previous reports revealed only HVR-1 data because of the forensic tradition of mtDNA control region study. The HVR-1 Hd and πi of the three ethnic populations were calculated by the sequences from position 16,024-16,365. The HVR-1 Hd in Hmong, Lao Song, and Thai-Siam populations was 0.957, 0.975, and 0.989, respectively. The HVR-1 πi in Hmong, Lao Song, and Thai-Siam populations was 0.02365, 0.02112, and 0.02110, respectively. Several studies on several populations in Thailand reported the range of the HVR-1 Hd, which varied from 0.931 to 1.000, and that of πi varied from 0.0169 to 0.0235 (Fucharoen et al., 2001; Lertrit et al., 2008; Bodner et al., 2011; Boonsoda et al., 2013; Kutanan et al., 2014). These values indicated that the genetic diversity of the three ethnic populations in this study were relatively high. Moreover, the genetic distance, referred to as the differentiation of genetic structure between populations, between the three populations (Table 6) was relatively high as compared to that revealed in previous reports (Fucharoen et al., 2001; Kutanan et al., 2014). The previous study on Tai-Kadai populations - Yuan, Leu, and Yong in the northern part of Thailand - reported that the range of percentage of unique haplotypes was 26.3-67.7 and Hd range was 0.878-0.992 (N = 39-62). The negative value of Fs also suggested the demographic expansion of populations (Kampuansai et al., 2007).
Table 5. Diversity and neutrality testing parameters of mtDNA control region haplotypes in the three ethnic populations.
Hmong Lao Song Thai-Siam
No. of Sequences 53 29 27
Number of variable sites 87 78 93
Ave. no. of nucleotide differences, k 13.137 12.714 12.669
No. of Haplotypes 36 25 25
No. of unique Haplotypes (% individuals) 27 (50.94) 23 (79.31) 23 (85.19)
No. of share Haplotypes 9 2 2
Haplotype diversity, Hd 0.979 0.983 0.994
Variance of Hd 0.00008 0.00029 0.00014
Standard Deviation of Hd 0.009 0.017 0.012
Nucleotide diversity; πi 0.01174 0.01130 0.01132
Variance of πi 0.0000001 0.0000007 0.0000006
Standard Deviation of πi 0.00035 0.00082 0.00079
Tajima’s D (P < 0.05) -1.16069 -1.40425 -1.86488
CONCLUSION
The present study demonstrated the genetic structure and diversity of Thai-Siam, Hmong, and Lao Song populations living in Phitsanulok Province, Thailand. The haplotype study of mtDNA control region revealed no admixture between populations. The unique patterns of mutation in mtDNA control region were found at position 73 (A→G) and 512 (ACAC-insertion), which can be used as population markers. Thai-Siam population represented the highest diversity in all the three populations, while the genetic diversities of Hmong and Lao Song populations, who had migration history, decreased as compared to their original populations. These results confirmed the history of long-term isolation of Hmong and Lao Song populations.
Conflicts of interest
The authors declare no conflicts of interest.
ACKNOWLEDGMENTS
Research supported by funding from the National Research Council of Thailand. The authors greatly appreciate the helpful comments and suggestions from anonymous reviewers. The authors would like to thank all individuals who were helpful in specimen collection.
REFERENCES
Anderson S, Bankier AT, Barrell BG, de Bruijn MHL, et al. (1981). Sequence and organization of the human mitochondrial genome. Nature 290: 457-465. https://doi.org/10.1038/290457a0
Andrews RM, Kubacka I, Chinnery PF, Lightowlers RN, et al. (1999). Reanalysis and revision of the Cambridge reference sequence for human mitochondrial DNA. Nat. Genet. 23: 147. https://doi.org/10.1038/13779
Asin-Cayuela J and Gustafsson CM (2007). Mitochondrial transcription and its regulation in mammalian cells. Trends
Biochem. Sci. 32: 111-117. https://doi.org/10.1016/j.tibs.2007.01.003
Behar DM, Villems R, Soodyall H, Blue-Smith J, et al.; Genographic Consortium (2008). The dawn of human matrilineal diversity. Am. J. Hum. Genet. 82: 1130-1140. https://doi.org/10.1016/j.ajhg.2008.04.002
Bodner M, Zimmermann B, Röck A, Kloss-Brandstätter A, et al. (2011). Southeast Asian diversity: first insights into the complex mtDNA structure of Laos. BMC Evol. Biol. 11: 49. https://doi.org/10.1186/1471-2148-11-49
Boonsoda P, Srithawong S, Srikuka S and Kutanan W (2013). Mitochondrial DNA variation of the Khmer in Surin province, Thailand. Thai J. Genet 6: 40-48.
Brandstätter A, Peterson CT, Irwin JA, Mpoke S, et al. (2004). Mitochondrial DNA control region sequences from Nairobi (Kenya): inferring phylogenetic parameters for the establishment of a forensic database. Int. J. Legal Med. 118: 294-306. https://doi.org/10.1007/s00414-004-0466-z
Fu YX (1997). Statistical tests of neutrality of mutations against population growth, hitchhiking and background selection.
Genetics 147: 915-925.
Fucharoen G, Fucharoen S and Horai S (2001). Mitochondrial DNA polymorphisms in Thailand. J. Hum. Genet. 46: 115-125. https://doi.org/10.1007/s100380170098
Table 6. The genetic differentiation by nucleotide diversity between groups of the three ethnic populations.
Hmong Lao Song Thai Siam
Hmong -
Lao Song 0.04072 -
Goldstein S and Goldstein A (1986). Migration on Thailand: a twenty-five-years review. East-West Population Institute, Paper; No. 100. Honolulu, HI: East-West Center.
Ingman M, Kaessmann H, Pääbo S and Gyllensten U (2000). Mitochondrial genome variation and the origin of modern humans. Nature 408: 708-713. https://doi.org/10.1038/35047064
Irwin JA, Saunier JL, Strouss KM, Sturk KA, et al. (2007). Development and expansion of high-quality control region databases to improve forensic mtDNA evidence interpretation. Forensic Sci. Int. Genet. 1: 154-157. https://doi. org/10.1016/j.fsigen.2007.01.019
Irwin JA, Saunier JL, Niederstätter H, Strouss KM, et al. (2009). Investigation of heteroplasmy in the human mitochondrial DNA control region: a synthesis of observations from more than 5000 global population samples. J. Mol. Evol. 68: 516-527. https://doi.org/10.1007/s00239-009-9227-4
Irwin JA, Parson W, Coble MD and Just RS (2011). mtGenome reference population databases and the future of forensic mtDNA analysis. Forensic Sci. Int. Genet. 5: 222-225. https://doi.org/10.1016/j.fsigen.2010.02.008
Jankova-Ajanovska R, Zimmermann B, Huber G, Röck AW, et al. (2014). Mitochondrial DNA control region analysis of three ethnic groups in the Republic of Macedonia. Forensic Sci. Int. Genet. 13: 1-2. https://doi.org/10.1016/j. fsigen.2014.06.013
Kampuansai J, Bertorelle G, Castri L, Nakbunlung S, et al. (2007). Mitochondrial DNA variation of Tai-speaking peoples in Northern Thailand. Sci. Asia 33: 443-448. https://doi.org/10.2306/scienceasia1513-1874.2007.33.443
Keyes C (2002). Presidential address: “The people of Asia”-Science and politics in the classification of ethnic groups in Thailand, China and Vietnam. J. Asian Stud. 61: 1177-1181. https://doi.org/10.2307/3096439
Kivisild T (2015). Maternal ancestry and population history from whole mitochondrial genomes. Investig. Genet. 6: 3.
https://doi.org/10.1186/s13323-015-0022-2
Knight A, Underhill PA, Mortensen HM, Zhivotovsky LA, et al. (2003). African Y chromosome and mtDNA divergence provides insight into the history of click languages. Curr. Biol. 13: 464-473. https://doi.org/10.1016/S0960-9822(03)00130-1
Kumar S, Stecher G and Tamura K (2016). MEGA7: molecular evolutionary genetics analysis version 7.0 for bigger datasets. Mol. Biol. Evol. 33: 1870-1874. https://doi.org/10.1093/molbev/msw054
Kutanan W, Kampuansai J, Fuselli S, Nakbunlung S, et al. (2011). Genetic structure of the Mon-Khmer speaking groups and their affinity to the neighbouring Tai populations in Northern Thailand. BMC Genet. 12: 56. https://doi. org/10.1186/1471-2156-12-56
Kutanan W, Srithawong S, Kamlao A and Kampuansai J (2014). Mitochondrial DNA-HVR1 variation reveal genetic heterogeneity in Thai-Isan people from the lower region of northeastern Thailand. Adv. Anthropol. 4: 7-12. https:// doi.org/10.4236/aa.2014.41002
Lertrit P, Poolsuwan S, Thosarat R, Sanpachudayan T, et al. (2008). Genetic history of Southeast Asian populations as revealed by ancient and modern human mitochondrial DNA analysis. Am. J. Phys. Anthropol. 137: 425-440. https:// doi.org/10.1002/ajpa.20884
Librado P and Rozas J (2009). DnaSP v5: a software for comprehensive analysis of DNA polymorphism data. Bioinformatics
25: 1451-1452. https://doi.org/10.1093/bioinformatics/btp187
Mercer TR, Neph S, Dinger ME, Crawford J, et al. (2011). The human mitochondrial transcriptome. Cell 146: 645-658.
https://doi.org/10.1016/j.cell.2011.06.051
Meyer S, Weiss G and von Haeseler A (1999). Pattern of nucleotide substitution and rate heterogeneity in the hypervariable regions I and II of human mtDNA. Genetics 152: 1103-1110.
Ngourungsi K, Ngamkasame P, Kocharoenpaiboon B and Sriprasert A (1976). Linguistic map of Phitsanulok province. Srinakharinwirot University, Phitsanulok, Thailand.
Ramos A, Santos C, Mateiu L, Gonzalez MdelM, et al. (2013). Frequency and pattern of heteroplasmy in the complete human mitochondrial genome. PLoS One 8: e74636. https://doi.org/10.1371/journal.pone.0074636
Sangthong P, Jansom A and Chinnabanchonchai N (2015). Sequence analysis of mitochondrial DNA hypervariable region 1 in Thai individuals. Aust. J. Forensic Sci. 47: 345-354. https://doi.org/10.1080/00450618.2014.973444
Satapanawattana J, Sirasutha P and Suwanprathet O (2011). Phitsanulok: Province of opportunities and challenges. Eastern Printing Co. Ltd. Naresuan University, Phitsanulok, Thailand.
Schliesinger J (2000). Ethnic groups of Thailand: non-Tai speaking peoples. In: Hmong. White Lotus Press, Bangkok, 149-154. Available at [https://books.google.co.th/books?id=YDojBgAAQBAJ&printsec=frontcover&source=gbs_ ge_summary_r&cad=0#v=onepage&q&f=false].
Srising S (1976). Thai Song Dam (Lao Song) culture in Phitsanulok and Phichit province. Srinakharinwirot University, Phitsanulok, Thailand.
Tajima F (1989). Statistical method for testing the neutral mutation hypothesis by DNA polymorphism. Genetics 123: 585-595.
Tamura K, Stecher G, Peterson D, Filipski A, et al. (2013). MEGA6: molecular evolutionary genetics analysis version 6.0.
Mol. Biol. Evol. 30: 2725-2729. https://doi.org/10.1093/molbev/mst197
Tillmar AO, Coble MD, Wallerström T and Holmlund G (2010). Homogeneity in mitochondrial DNA control region sequences in Swedish subpopulations. Int. J. Legal Med. 124: 91-98. https://doi.org/10.1007/s00414-009-0354-7
Tuppen HAL, Blakely EL, Turnbull DM and Taylor RW (2010). Mitochondrial DNA mutations and human disease.
Biochim. Biophys. Acta 1797: 113-128. https://doi.org/10.1016/j.bbabio.2009.09.005
Turchi C, Stanciu F, Paselli G, Buscemi L, et al. (2016). The mitochondrial DNA makeup of Romanians: A forensic mtDNA control region database and phylogenetic characterization. Forensic Sci. Int. Genet. 24: 136-142. https://doi. org/10.1016/j.fsigen.2016.06.013
Underhill PA and Kivisild T (2007). Use of y chromosome and mitochondrial DNA population structure in tracing human migrations. Annu. Rev. Genet. 41: 539-564. https://doi.org/10.1146/annurev.genet.41.110306.130407
Wen B, Li H, Gao S, Mao X, et al. (2005). Genetic structure of Hmong-Mien speaking populations in East Asia as revealed by mtDNA lineages. Mol. Biol. Evol. 22: 725-734. https://doi.org/10.1093/molbev/msi055
Zimmermann B, Bodner M, Amory S, Fendt L, et al. (2009). Forensic and phylogeographic characterization of mtDNA lineages from northern Thailand (Chiang Mai). Int. J. Legal Med. 123: 495-501. https://doi.org/10.1007/s00414-009-0373-4
Supplementary material
Table S1. Frequencies distribution of mutation in each position of mtDNA control region.