www.Genes&Cancer.com Genes & Cancer, Vol. 9 (3-4), March 2018
Identification of a panel of MYC and Tip60 co-regulated genes
functioning primarily in cell cycle and DNA replication
Ling-Jun Zhao1, Paul M. Loewenstein1 and Maurice Green1
1 Department of Microbiology and Molecular Immunology, Saint Louis University School of Medicine, Doisy Research Center,
St. Louis, Missouri, USA
Correspondence to: Paul M. Loewenstein, email: [email protected]
Keywords: MYC; NuA4 complex; Tip60; p300; cancer
Received: May 16, 2018 Accepted: July 22, 2018 Published: July 29, 2018
Copyright: Zhao et al. This is an open-access article distributed under the terms of the Creative Commons Attribution License 3.0 (CC BY 3.0), which permits unrestricted use, distribution, and reproduction in any medium, provided the original author and source are credited.
ABSTRACT
We recently reported that adenovirus E1A enhances MYC association with the NuA4/Tip60 histone acetyltransferase (HAT) complex to activate a panel of genes enriched for DNA replication and cell cycle. Genes from this panel are highly expressed in examined cancer cell lines when compared to normal fibroblasts. To further understand gene regulation in cancer by MYC and the NuA4 complex, we performed RNA-seq analysis of MD-MB231 breast cancer cells following knockdown of MYC or Tip60 - the HAT enzyme of the NuA4 complex. We identify here a panel of 424 genes, referred to as MYC-Tip60 co-regulated panel (MTcoR), that are dependent on both MYC and Tip60 for expression and likely co-regulated by MYC and the NuA4 complex. The MTcoR panel is most significantly enriched in genes involved in cell cycle and/ or DNA replication. In contrast, genes repressed by shMYC but not by shTip60 (224 genes) have a low significance of enrichment in identifiable biological processes other than cell cycle and DNA replication. Genes repressed by shTip60 but not by shMYC (102 genes) have no significant identifiable gene enrichment. We propose that MYC cooperates with the NuA4 complex to activate the MTcoR panel of genes to promote DNA replication and cell cycle.
INTRODUCTION
The proto-oncogene product MYC is a transcription factor over-expressed in many cancers [1-3]. It forms a leucine-zipper with MAX to bind promoters [4] and activate genes of multiple cellular pathways that govern cellular proliferation [1-3] and cancer prognosis [5]. Transcriptional regulation by MYC can involve histone acetyltransferase (HAT) complexes, such as the NuA4 complex and the GCN5 complex [6-9]. However, the roles of the HAT complexes during MYC function in cancer remains uncharacterized. The human NuA4 complex has up to 20 subunits [10] with a core HAT enzyme Tip60 to acetylate primarily histones H2 and H4 [11-13]. It is involved in chromatin remodeling, gene activation, and DNA damage repair [10, 14, 15]. MYC association with the NuA4 complex is inefficient in HeLa cells [16] and mouse embryonic stem cells [9], but may be enhanced in HeLa cells by the adenovirus E1A N-terminal domain [16, 17]. Enhanced MYC association with the NuA4 complex
mediated by E1A results in activation of two panels of genes: the MNA4 panel (MYC NuA4) and the MNP300 panel (MYC NuA4 p300) [16]. Activation of the MNP300 panel requires E1A enhanced MYC association with the NuA4 complex as well as E1A targeting of p300/CBP [16]. The MNP300 panel is most significantly enriched in genes functioning in DNA replication and cell cycle. Importantly, selected genes from the MNP300 panel are highly expressed in the three examined cancer cell lines compared to normal fibroblasts [16], suggesting involvement of MYC association with the NuA4 complex in activation of the MNP300 panel in cancer cells.
Tip60 shows that it associates mainly with components of the NuA4 complex [9, 16, 20]. The yeast counterpart of Tip60, Esa1, is also found to exist only in the NuA4 complex [21]. In contrast, TRRAP, as a scaffold protein, helps assemble two additional HAT complexes: the GCN5 complex and the PCAF complex [10, 22]. Since MYC associates with TRRAP [7, 23-25], it is likely that MYC associates with all the three TRRAP-containing HAT complexes. Importantly, however, the adenovirus E1A oncoprotein N-terminal TRRAP-targeting domain, or the ET domain, targets the NuA4 complex [16] and enhances MYC association with the NuA4 complex [17], suggesting that the NuA4 complex may be critical for MYC and E1A function.
To further explore the function of MYC association with the NuA4 complex in cancer, we examined effects of shRNA-mediated knockdown of MYC and the Tip60 component of the NuA4 complex on gene expression in MD-MB231 human breast cancer cells. Our RNA-seq results suggest that MYC and Tip60 co-regulate the expression of a panel of genes, the MTcoR panel, that are critical for DNA replication and cell cycle.
RESULTS
Repression of selected genes by MYC and Tip60 knockdown
We previously identified the MNP300 panel of 352 genes that are activated in normal fibroblasts by the adenovirus E1A N-terminal domain through targeting p300 and the MYC-NuA4 complex [16]. Since the MNP300 panel of genes are enriched most significantly in genes involved in DNA replication and cell cycle, they may have important functions in cancer. Consistent with this possibility, selected genes from the MNP300 panel are over-expressed by 10-30 fold in three examined human cancer cell lines compared to normal fibroblasts [16]. To determine whether these genes are regulated by MYC and the NuA4 complex in human cancer cells, MYC and Tip60 (the core HAT enzyme in the NuA4 complex) were knocked down in MB231 human breast cancer cells by using two independent shRNA clones targeting different genomic regions of MYC or Tip60 (see Materials and Methods). Western blot analysis of cells expressing shMYC(1) or shMTC(2) showed efficient knockdown of MYC expression compared to control cells expressing shGFP (see Supplementary Figure 1, lanes 2 and 3). Western blot analysis of Tip60 with several commercial antibodies did not detect endogenous levels of Tip60 in cells likely due to lower expression of Tip60 and lower sensitivities of the antibodies.
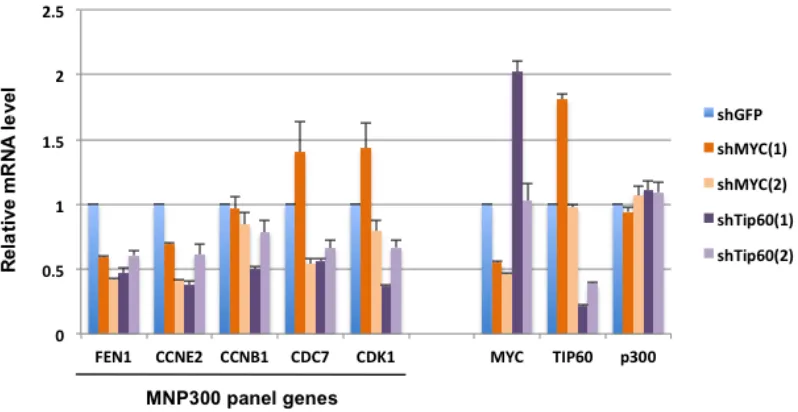
However, as expected, RT-qPCR analysis of cells expressing the shRNAs showed that the MYC shRNA clones efficiently inhibited MYC and the Tip60 shRNA
clones efficiently inhibited Tip60 mRNA synthesis (Figure 1). Of interest, shMYC(1) and shTip60(1) mutually enhanced the mRNA synthesis of Tip60 and MYC, respectively (Figure 1) (see Discussion). As control, the level of p300 mRNA was not affected significantly by the expression of the shRNA clones (Figure 1). Among the MNP300 panel genes previously selected for analysis due to their roles in cell cycle and DNA replication [16], FEN1 and CCNE2 were most efficiently repressed by all four shRNA clones (Figure 1), and thus may be co-regulated by MYC and the NuA4 complex (represented by Tip60). Repression of CCNB1 was inefficient by all the shRNA clones, and repression of CDC7 and CDK1 appeared to be dependent on the shRNA clone. Specifically, shMYC(1), which enhanced Tip60 mRNA, also enhanced CDC7 and CDK1 mRNAs, whereas shMYC(2) repressed both genes. Since shMYC(1) appears to repress a lower number of genes than shMYC(2), it may serve as a more stringent selector of genes that are repressed specifically by MYC knockdown (see next). The co-repression of the selected MNP300 panel genes mediated by shMYC and shTip60 suggests that these shMYC and shTip60 clones are suitable for MYC and Tip60 knockdown and subsequent global analysis of their effects on gene repression.
Identification of a MYC-Tip60 co-regulated (MTcoR) panel of genes by RNA-seq analysis following MYC and Tip60 knockdown
repressed by all shMYC and shTip60 clones (Figure 1) are included in the MTcoR panel (Supplementary Table 2), whereas CDC7 and CDK1, which are enhanced by shMYC(1) (Figure 1), are excluded.
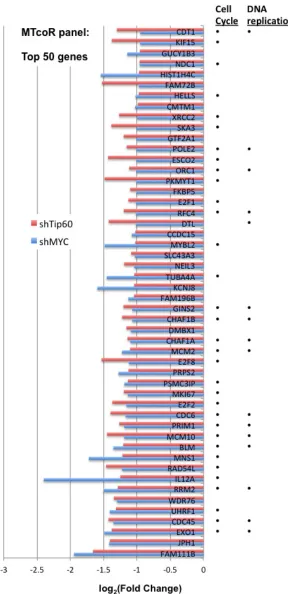
The MTcoR panel was sorted by the efficiency of co-repression by shMYC and by shTip60, i.e., the extent of overlap between the repression efficiency of MYC knockdown (average of shMYC(1) and shMYC(2)) and the repression efficiency of Tip60 knockdown (average of shTip60(1) and shTip60(2)). The top 50 genes with the highest co-repression by shMYC and shTip60 are shown in Figure 2, and are good candidates for genes co-regulated by MYC and the NuA4 complex (represented by Tip60). As indicated in Figure 2, most of these genes are involved in cell cycle and DNA replication (see gene ontology analysis next).
RT-qPCR analysis of gene repression by MYC and Tip60 knockdown
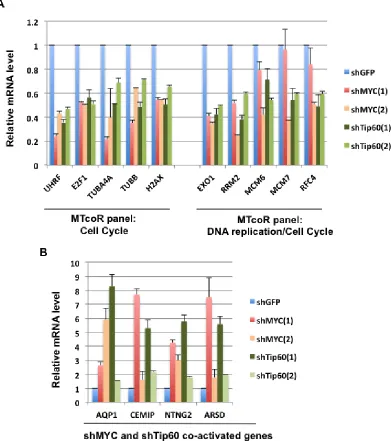
To provide further evidence that the MTcoR panel of genes are co-regulated by MYC and Tip60, RT-qPCR analysis was performed for genes in the MTcoR panel that are involved in cell cycle and DNA replication as determined by gene ontology analysis described below. As shown in Figure 3A, the five genes that are involved in “cell cycle” are efficiently repressed by all shMYC and shTip60 clones. The five genes that are involved in both “DNA replication” and “cell cycle” (Figure 3A) are
also repressed by shMYC and shTip60 clones, except that MCM7 and RFC4 are only marginally repressed by shMYC(1). Thus, although shMYC(1) and shMYC(2) both efficiently repress most of the MTcoR panel of genes, shMYC(1) appears to repress less number of genes than shMYC(2) as may be expected from the results of Figure 1. As a control for this analysis, four genes that were shown by RNA-seq analysis to be enhanced by shMYC and shTip60 are also shown to be efficiently activated during the RT-qPCR analysis (Figure 3B). We noted that shTip60(1) activated these genes much more efficiently than shTip60(2), possibly due to its enhancement of MYC expression (Figure 1). Similarly, to some extent, shMYC(1) also activated these genes more efficiently than shMYC(2). From these results, we conclude that the MTcoR panel of genes, identified by RNA-seq analysis, are also largely co-repressed by shMYC and shTip60 by RT-qPCR analysis, thereby strengthening the possibility that the MTcoR panel of genes are normally co-regulated by MYC and the NuA4 complex.
Gene enrichment analysis of MTcoR panel for functional significance
To evaluate the functional significance of the MTcoR panel of genes, these genes were subjected to gene ontology analysis using the PANTHER database of ~21,000 genes with functional annotation [26, 27]. This analysis showed that the MTcoR panel is most
significantly enriched in genes involved in cell cycle and DNA replication (Figure 4A). Of the 424 genes in the MTcoR panel, 164 are involved in cell cycle (false discovery rate (FDR)-adjusted P value of 7.69 x 10-78), and 70 are involved in DNA replication and mostly overlap with cell cycle genes (FDR-adjusted P value of 3.65 x 10 -56). MTcoR panel genes involved in cell cycle represent ~ 6-fold enrichment compared to the database, whereas those involved in DNA replication represent ~16-fold enrichment. The highly significant P values also indicate
that cell cycle and DNA replication are the main function of the MTcoR panel of genes. Importantly, the MTcoR panel of genes are also enriched in biological processes that seem to facilitate DNA replication and cell cycle, such as “chromosome organization” and “Nucleic acid metabolic processes”.
In contrast, similar analysis revealed that genes repressed by shMYC (by ≥ 30%) but not by shTip60 (repression by shTip60 ≤ 10%) (224 genes) have a low significance of gene enrichment in several identifiable
Figure 3: RT-qPCR analysis of selected genes from the MTcoR panel for repression by MYC and Tip60 knockdown.
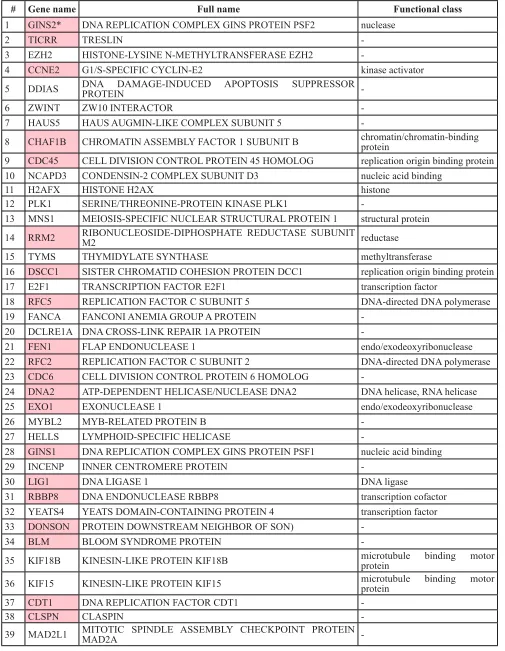
Table 1: Genes overlapping between the MTcoR panel and the MNP300 panel and involved in cell cycle
# Gene name Full name Functional class
1 GINS2* DNA REPLICATION COMPLEX GINS PROTEIN PSF2 nuclease
2 TICRR TRESLIN
-3 EZH2 HISTONE-LYSINE N-METHYLTRANSFERASE EZH2
-4 CCNE2 G1/S-SPECIFIC CYCLIN-E2 kinase activator
5 DDIAS DNA DAMAGE-INDUCED APOPTOSIS SUPPRESSOR PROTEIN
-6 ZWINT ZW10 INTERACTOR
-7 HAUS5 HAUS AUGMIN-LIKE COMPLEX SUBUNIT 5
-8 CHAF1B CHROMATIN ASSEMBLY FACTOR 1 SUBUNIT B chromatin/chromatin-binding protein 9 CDC45 CELL DIVISION CONTROL PROTEIN 45 HOMOLOG replication origin binding protein 10 NCAPD3 CONDENSIN-2 COMPLEX SUBUNIT D3 nucleic acid binding
11 H2AFX HISTONE H2AX histone
12 PLK1 SERINE/THREONINE-PROTEIN KINASE PLK1
-13 MNS1 MEIOSIS-SPECIFIC NUCLEAR STRUCTURAL PROTEIN 1 structural protein 14 RRM2 RIBONUCLEOSIDE-DIPHOSPHATE REDUCTASE SUBUNIT M2 reductase
15 TYMS THYMIDYLATE SYNTHASE methyltransferase
16 DSCC1 SISTER CHROMATID COHESION PROTEIN DCC1 replication origin binding protein
17 E2F1 TRANSCRIPTION FACTOR E2F1 transcription factor
18 RFC5 REPLICATION FACTOR C SUBUNIT 5 DNA-directed DNA polymerase
19 FANCA FANCONI ANEMIA GROUP A PROTEIN
-20 DCLRE1A DNA CROSS-LINK REPAIR 1A PROTEIN
-21 FEN1 FLAP ENDONUCLEASE 1 endo/exodeoxyribonuclease
22 RFC2 REPLICATION FACTOR C SUBUNIT 2 DNA-directed DNA polymerase
23 CDC6 CELL DIVISION CONTROL PROTEIN 6 HOMOLOG
-24 DNA2 ATP-DEPENDENT HELICASE/NUCLEASE DNA2 DNA helicase, RNA helicase
25 EXO1 EXONUCLEASE 1 endo/exodeoxyribonuclease
26 MYBL2 MYB-RELATED PROTEIN B
-27 HELLS LYMPHOID-SPECIFIC HELICASE
-28 GINS1 DNA REPLICATION COMPLEX GINS PROTEIN PSF1 nucleic acid binding
29 INCENP INNER CENTROMERE PROTEIN
-30 LIG1 DNA LIGASE 1 DNA ligase
31 RBBP8 DNA ENDONUCLEASE RBBP8 transcription cofactor
32 YEATS4 YEATS DOMAIN-CONTAINING PROTEIN 4 transcription factor
33 DONSON PROTEIN DOWNSTREAM NEIGHBOR OF SON)
-34 BLM BLOOM SYNDROME PROTEIN
-35 KIF18B KINESIN-LIKE PROTEIN KIF18B microtubule binding motor protein
36 KIF15 KINESIN-LIKE PROTEIN KIF15 microtubule binding motor protein
37 CDT1 DNA REPLICATION FACTOR CDT1
-38 CLSPN CLASPIN
-39 MAD2L1 MITOTIC SPINDLE ASSEMBLY CHECKPOINT PROTEIN MAD2A
biological processes excluding cell cycle and DNA replication (data not shown). Genes repressed by shTip60 but not by shMYC (102 genes) have no identifiable gene enrichment (data not shown). Thus, gene regulatory functions of MYC and the NuA4 complex (represented by Tip60) may be exerted predominantly by their cooperation with each other in activation of the MTcoR panel of genes that primarily function in cell cycle and DNA replication. In contrast, genes that are regulated by MYC or the NuA4
complex separately may affect diverse cellular processes. We also noted that the top 424 genes co-activated by shMYC and by shTip60 (by ≥ 47%) have no identifiable gene enrichment (not shown), suggesting that these genes may be normally suppressed by MYC and the NuA4 complex and function in multiple cellular processes. These gene ontology analyses indicate an overall pattern of gene regulation by MYC and the NuA4 complex, i.e., only genes whose expression is normally activated
Figure 4: Gene ontology analysis and mammalian phenotype analysis for the MTcoR panel of genes. A. PANTHER Gene Ontology analysis (PANTHER version 13). Biological processes with confidence defined by Fisher’s Exact P value (with FDR - false discovery rate - multiple test correction) of < 1 x 10-25 are shown. Processes that appear to be redundant are at different levels of the
gene classification hierarchy. B. Enrichr Mammalian phenotype analysis. The MGI (Mouse Genome Informatics) Mammalian Phenotype database contains experimental phenotypic changes due to targeted gene mutations in mouse. A high significance score (a low adjusted
cooperatively by MYC and the NuA4 complex have a predominant function in cell cycle and DNA replication.
The MTcoR panel of genes are also subjected to Enrichr analysis for mammalian phenotypes (http://amp. pharm.mssm.edu/Enrichr/) [28, 29]. This analysis is based on the Mouse Genome Informatics (MGI) database for mammalian phenotypes which are derived from mouse models through targeted gene mutations, such as knockout of the H2AX gene [30] or mutations that cripple the functional domain of Exo1 [31]. Both H2AX and Exo1 are identified in the MTcoR panel (Figure 3). Importantly, Enrichr analysis of the MTcoR panel (Figure 4B) revealed that it has the most significant enrichment in genes whose mutation may be associated with chromosomal instability (14 genes from the MTcoR panel) and increased lymphoma incidence (16 genes from the MTcoR panel) (Figure 4B). In the MGI database, 658 genotypes are correlated with an increased lymphoma incidence, and 212 genotypes with chromosomal instability (http://www. informatics.jax.org/). These results are consistent with the conclusion from the PANTHER gene enrichment analysis that the MTcoR panel of genes are involved in cell cycle regulation and DNA replication.
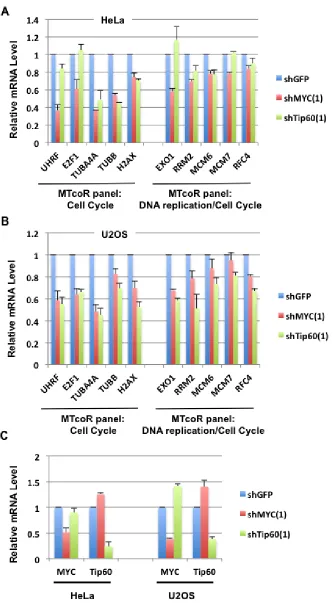
Repression of selected MTcoR panel of genes in other cancer cell lines by MYC and Tip60 shRNA
To determine whether the MTcoR panel of genes are regulated by MYC and Tip60 also in other cancer cell lines, shMYC(1) and shTip60(1) were expressed in HeLa and U2OS cells, and then expression of selected genes (same as in Figure 3A) was analyzed. As shown, most of the selected genes are inhibited by both shMYC(1) and shTip60(1) in both cell lines (Figure 5A and 5B). In particular, TBUA4A, TUBB, and H2AX appear to have the highest degree of co-dependence on MYC and Tip60 for expression in both cell lines. In contrast, knockdown of MYC repressed UHRF, E2F1, and Exo1 in both U2OS and HeLa cells, whereas Tip60 knockdown repressed these genes in U2OS cells but not in HeLa cells (see Discussion). Thus, different cancer cell lines may have a common set of MTcoR genes that are co-regulated by MYC and the NuA4 complex (represented by Tip60). Other MTcoR genes may be co-regulated by MYC and the NuA4 complex in a cell type-specific manner. Additionally, shMYC(1) and shTip60(1) appear to significantly enhance expression of Tip60 and MYC, respectively, in U2OS cells, but only marginally in HeLa cells (Figure 5C).
DISCUSSION
MYC and Tip60 - the essential HAT enzyme of the NuA4 complex, play critical roles in cellular proliferation and death. Cooperativity between MYC and Tip60
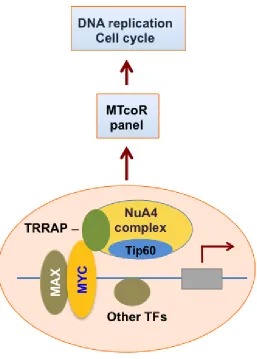
in promoter regulation has been observed in mouse embryonic stem cells [32]. Tip60, possibly in the context of the NuA4 complex, may directly acetylate MYC [33]. Our previous studies with adenovirus E1A N-terminal domain helped identify an MNP300 panel of genes that are activated by E1A targeting of both the MYC-NuA4 complex and p300/CBP [16]. The MNP300 panel shares 54 genes with the MTcoR panel identified in this study, including FEN1 and CCNE2, which are repressed by both shMYC and shTip60 (Figure 1). Gene ontology analysis shows that these overlapping genes are also predominantly enriched in genes involved in cell cycle and DNA replication (Table 1). In fact, 39 genes (72%) of the 54 genes are involved in cell cycle regulation, and 20 of these 39 genes are also involved in DNA replication (Table 1). In contrast, 164 genes of the 424 genes in the MTcoR panel, representing ~39%, are involved in cell cycle. These results support the thesis that E1A N-terminal domain targets the MYC-NuA4 complex to up-regulate genes involved in cell cycle/DNA replication probably to promote conditions suitable for adenovirus replication [16]. Under appropriate conditions and lack of functional check points these changes in gene expression may lead to cellular transformation. Importantly, in the top 50 genes from MTcoR panel (Figure 2), 33 genes - representing 66% - are involved in cell cycle, suggesting that genes with a higher degree of co-regulation by MYC and the NuA4 complex have a higher probability of involvement in cell cycle. We propose that MYC and the NuA4 complex may cooperate to activate the MTcoR panel of genes that function mainly in cell cycle regulation and DNA replication (Figure 6) and may play major roles in cancer development. Conceivably, this cooperativity could be achieved by the recruitment of a MYC-NuA4 complex to the MTcoR gene promoters, or by recruitment of MYC and the NuA4 complex separately.
cannot exclude the possibility that some of the MTcoR panel of genes are regulated by MYC and by the NuA4 complex on the same promoter in the absence of a direct interaction.
Since a high fraction of human cancers have MYC over-expression, MYC is an attractive cancer target [34, 35]. For example, p53 and MYC are found to co-regulate genes aberrantly expressed in leukemic stem cells, and targeting p53 and MYC simultaneously selectively eliminates leukemic stem cells [36]. The primary function of the MTcoR panel of genes in DNA replication and cell cycle suggests that the MTcoR panel may be of potential importance for cancer therapies targeting MYC and the NuA4 complex. Comparison of effects of MYC and Tip60 knockdown on MTcoR panel gene expression in different cell lines (Figure 3 and Figure 5) suggests that there are genes co-regulated by MYC and the NuA4 complex in many cancer cell lines, as well as genes co-regulated by MYC and the NuA4 complex in a cell type-specific manner. Thus, identification of a common set of
MTcoR panel genes that are co-regulated by MYC and the NuA4 complex in most cancer lines may be valuable in understanding cancer development. Significantly, shMYC(1) and shTip60(1) mutually enhance expression of Tip60 and MYC in MB231 (Figure 1) and U2OS cells (Figure 5C). These shRNA clones have been used in various studies to explore gene regulatory pathways in cancer [37, 38]. Although the mechanism remains unclear, it may reflect a cellular mechanism to compensate for the loss of MYC or a functional NuA4 complex (due to lack of Tip60), by increasing the expression of MYC or Tip60, respectively. This is consistent with the important functions of the MTcoR panel of genes in DNA replication and cell cycle. Nevertheless, most of the MTcoR panel of genes remain susceptible to repression by shMYC(1) and shTip60(1), and increasing MYC or Tip60 synthesis alone fails to normalize the expression of the MTcoR panel of genes. Thus, the MTcoR panel of genes may be targeted for cancer therapy, alone or in combination with targeting of MYC and the NuA4 complex.
MATERIALS AND METHODS
Cell culture and lentiviral transduction
Human breast cancer cell line MD-MB231 (ATCC), HEK 293T (Invitrogen), HeLa and U2OS (osteosarcoma, ATCC) were cultured in DMEM (Life Technologies) supplemented with 10% fetal bovine serum and 50 U/ml of Pen/Strep. Lentiviruses were generated by transfection in 293T cells as described previously [17]. Cells in 100 mm dishes were transduced with shRNA lentiviruses overnight, selected with puromycin (1 µg/ml) for two days, and used for RNA preparation as described previously[16]. Alternatively, MB231 cells were plated in 6-well dishes, transduced and drug-selected the same way, and then lysed for Western blot analysis. All shRNA lentiviral clones are from Sigma and target different genomic regions of MYC and Tip60: shMYC(1) - TRCN0000039642 (target sequence: CCTGAGACAGATCAGCAACAA), shMYC(2) - TRCN0000312581 (target sequence: CCAGAGGAGGAACGAGCTAAA); shTip60(1) - TRCN0000020315 (target
sequence: CCTCAATCTCATCAACTACTA), shTip60(2) - TRCN0000020317 (target sequence:
CCTCCTATCCTATCGAAGCTA).
RT-qPCR analysis and RNA-seq analysis
RNA was prepared in triplicates as described previously [16], and subjected to PolyA selection and RNA-seq analysis at the Washington University Genome Technology Access Center as described earlier [16]. RT-qPCR analysis was as described previously [16].
Gene enrichment analysis
PANTHER (version 13) gene enrichment analysis [26, 27] was performed online (http://www.geneontology. org). Biological processes with False Discovery Rate (FDR) corrected P values of smaller than the defined value are shown in Figure 4. Ontologies - MGI (Mouse Genome Informatics) Mammalian phenotype analysis using ENRICHR was performed online (http://amp. pharm.mssm.edu/Enrichr/). The MGI database contains annotated phenotypes induced by targeted gene mutation/ inactivation in mouse [28, 29].
ACKNOWLEDGMENTS
We are grateful for the guidance, encouragement and support from Dr. Maurice Green, a senior and respected adenovirologist and cancer biologist who passed away in December of 2017. Dr. Green remains as senior author
of this manuscript, which would not have been possible without his support and guidance.
We wish to thank William Wold (Saint Louis University) for critical review of this manuscript. We thank Michael Zhao for helping to manage the RNA-seq data. The Genome Technology Access Center at the Department of Genetics at Washington University School of Medicine for help with RNA-seq analysis. The Center is partially supported by NCI Cancer Center Support Grant #P30 CA91842 to the Siteman Cancer Center and by ICTS/CTSA Grant# UL1TR000448. This publication is solely the responsibility of the authors and does not necessarily represent the official view of NCRR or NIH.
CONFLICT OF INTEREST
The authors declare that they have no conflicts of interest with the contents of this article.
REFERENCES
1. Tansey WP. Mammalian MYC Proteins and Cancer. New Journal of Science. 2014; 2014:1-27.
2. Dang CV. MYC on the path to cancer. Cell. 2012; 149:22-35.
3. Meyer N, and Penn LZ. Reflecting on 25 years with MYC. Nat Rev Cancer. 2008; 8:976-90.
4. Blackwood EM, and Eisenman RN. Max: a helix-loop-helix zipper protein that forms a sequence-specific DNA-binding complex with Myc. Science. 1991; 251:1211-7.
5. Wolfer A, Wittner BS, Irimia D, Flavin RJ, Lupien M, Gunawardane RN, Meyer CA, Lightcap ES, Tamayo P, Mesirov JP, Liu XS, Shioda T, Toner M, et al. MYC regulation of a “poor-prognosis” metastatic cancer cell state. Proc Natl Acad Sci U S A. 2010; 107:3698-703. 6. Liu X, Tesfai J, Evrard YA, Dent SY, and Martinez E.
c-Myc transformation domain recruits the human STAGA complex and requires TRRAP and GCN5 acetylase activity for transcription activation. J Biol Chem. 2003; 278:20405-12.
7. McMahon SB, Wood MA, and Cole MD. The essential cofactor TRRAP recruits the histone acetyltransferase hGCN5 to c-Myc. Mol Cell Biol. 2000; 20:556-62. 8. Frank SR, Parisi T, Taubert S, Fernandez P, Fuchs M, Chan
HM, Livingston DM, and Amati B. MYC recruits the TIP60 histone acetyltransferase complex to chromatin. EMBO Rep. 2003; 4:575-80.
9. Kim J, Woo AJ, Chu J, Snow JW, Fujiwara Y, Kim CG, Cantor AB, and Orkin SH. A Myc network accounts for similarities between embryonic stem and cancer cell transcription programs. Cell. 2010; 143:313-24.
11. Renaud E, Barascu A, and Rosselli F. Impaired TIP60-mediated H4K16 acetylation accounts for the aberrant chromatin accumulation of 53BP1 and RAP80 in Fanconi anemia pathway-deficient cells. Nucleic Acids Res. 2015:First published online: October 7, 2015; doi: 10.1093/ nar/gkv19.
12. Kimura A, and Horikoshi M. Tip60 acetylates six lysines of a specific class in core histones in vitro. Genes Cells. 1998; 3:789-800.
13. Xu P, Li C, Chen Z, Jiang S, Fan S, Wang J, Dai J, Zhu P, and Chen Z. The NuA4 Core Complex Acetylates Nucleosomal Histone H4 through a Double Recognition Mechanism. Mol Cell. 2016; 63:965-75.
14. Doyon Y, Selleck W, Lane WS, Tan S, and Cote J. Structural and functional conservation of the NuA4 histone acetyltransferase complex from yeast to humans. Mol Cell Biol. 2004; 24:1884-96.
15. Squatrito M, Gorrini C, and Amati B. Tip60 in DNA damage response and growth control: many tricks in one HAT. Trends Cell Biol. 2006; 16:433-42.
16. Zhao LJ, Loewenstein PM, and Green M. Enhanced MYC association with the NuA4 histone acetyltransferase complex mediated by the adenovirus E1A N-terminal domain activates a subset of MYC target genes highly expressed in cancer cells. Genes Cancer. 2017; 8:752-61. 17. Zhao LJ, Loewenstein PM, and Green M. Ad E1A 243R
oncoprotein promotes association of proto-oncogene product MYC with the NuA4/Tip60 complex via the E1A N-terminal repression domain. Virology. 2016; 499:178-84 18. Lehner B, Crombie C, Tischler J, Fortunato A, and Fraser AG. Systematic mapping of genetic interactions in Caenorhabditis elegans identifies common modifiers of diverse signaling pathways. Nat Genet. 2006; 38:896-903. 19. Mitchell L, Lambert JP, Gerdes M, Al-Madhoun AS,
Skerjanc IS, Figeys D, and Baetz K. Functional dissection of the NuA4 histone acetyltransferase reveals its role as a genetic hub and that Eaf1 is essential for complex integrity. Mol Cell Biol. 2008; 28:2244-56.
20. Ikura T, Ogryzko VV, Grigoriev M, Groisman R, Wang J, Horikoshi M, Scully R, Qin J, and Nakatani Y. Involvement of the TIP60 histone acetylase complex in DNA repair and apoptosis. Cell. 2000; 102:463-73.
21. Allard S, Utley RT, Savard J, Clarke A, Grant P, Brandl CJ, Pillus L, Workman JL, and Cote J. NuA4, an essential transcription adaptor/histone H4 acetyltransferase complex containing Esa1p and the ATM-related cofactor Tra1p. EMBO J. 1999; 18:5108-19.
22. Brown CE, Lechner T, Howe L, and Workman JL. The many HATs of transcription coactivators. Trends Biochem Sci. 2000; 25:15-9.
23. Park J, Kunjibettu S, McMahon SB, and Cole MD. The ATM-related domain of TRRAP is required for histone acetyltransferase recruitment and Myc-dependent oncogenesis. Genes Dev. 2001; 15:1619-24.
24. Nikiforov MA, Chandriani S, Park J, Kotenko I, Matheos D, Johnsson A, McMahon SB, and Cole MD. TRRAP-dependent and TRRAP-inTRRAP-dependent transcriptional activation by Myc family oncoproteins. Mol Cell Biol. 2002; 22:5054-63.
25. McMahon SB, Van Buskirk HA, Dugan KA, Copeland TD, and Cole MD. The novel ATM-related protein TRRAP is an essential cofactor for the c-Myc and E2F oncoproteins. Cell. 1998; 94:363-74.
26. Ashburner M, Ball CA, Blake JA, Botstein D, Butler H, Cherry JM, Davis AP, Dolinski K, Dwight SS, Eppig JT, Harris MA, Hill DP, Issel-Tarver L, et al. Gene ontology: tool for the unification of biology. The Gene Ontology Consortium. Nat Genet. 2000; 25:25-9.
27. Mi H, Huang X, Muruganujan A, Tang H, Mills C, Kang D, and Thomas PD. PANTHER version 11: expanded annotation data from Gene Ontology and Reactome pathways, and data analysis tool enhancements. Nucleic Acids Res. 2017; 45:D183-D9.
28. Kuleshov MV, Jones MR, Rouillard AD, Fernandez NF, Duan Q, Wang Z, Koplev S, Jenkins SL, Jagodnik KM, Lachmann A, McDermott MG, Monteiro CD, Gundersen GW, et al. Enrichr: a comprehensive gene set enrichment analysis web server 2016 update. Nucleic Acids Res. 2016; 44:W90-7.
29. Chen EY, Tan CM, Kou Y, Duan Q, Wang Z, Meirelles GV, Clark NR, and Ma’ayan A. Enrichr: interactive and collaborative HTML5 gene list enrichment analysis tool. BMC Bioinformatics. 2013; 14:128.
30. Bassing CH, Chua KF, Sekiguchi J, Suh H, Whitlow SR, Fleming JC, Monroe BC, Ciccone DN, Yan C, Vlasakova K, Livingston DM, Ferguson DO, Scully R, et al. Increased ionizing radiation sensitivity and genomic instability in the absence of histone H2AX. Proc Natl Acad Sci U S A. 2002; 99:8173-8.
31. Wei K, Clark AB, Wong E, Kane MF, Mazur DJ, Parris T, Kolas NK, Russell R, Hou H, Jr., Kneitz B, Yang G, Kunkel TA, Kolodner RD, et al. Inactivation of Exonuclease 1 in mice results in DNA mismatch repair defects, increased cancer susceptibility, and male and female sterility. Genes Dev. 2003; 17:603-14.
32. Ravens S, Yu C, Ye T, Stierle M, and Tora L. Tip60 complex binds to active Pol II promoters and a subset of enhancers and co-regulates the c-Myc network in mouse embryonic stem cells. Epigenetics Chromatin. 2015; 8:45.
33. Patel JH, Du Y, Ard PG, Phillips C, Carella B, Chen CJ, Rakowski C, Chatterjee C, Lieberman PM, Lane WS, Blobel GA, and McMahon SB. The c-MYC oncoprotein is a substrate of the acetyltransferases hGCN5/PCAF and TIP60. Mol Cell Biol. 2004; 24:10826-34.
34. McKeown MR, and Bradner JE. Therapeutic strategies to inhibit MYC. Cold Spring Harb Perspect Med. 2014; 4. 35. Posternak V, and Cole MD. Strategically targeting MYC in
36. Abraham SA, Hopcroft LE, Carrick E, Drotar ME, Dunn K, Williamson AJ, Korfi K, Baquero P, Park LE, Scott MT, Pellicano F, Pierce A, Copland M, et al. Dual targeting of p53 and c-MYC selectively eliminates leukaemic stem cells. Nature. 2016; 534:341-6.
37. Huang CC, Wu DW, Lin PL, and Lee H. Paxillin promotes colorectal tumor invasion and poor patient outcomes via ERK-mediated stabilization of Bcl-2 protein by phosphorylation at Serine 87. Oncotarget. 2015; 6:8698-708.