An Efficient Software Fault Prediction Model using
Cluster based Classification
Pradeep Singh
Assistant Professor National Institute of TechnologyRaipur
Shrish Verma
ProfessorNational Institute of Technology Raipur
ABSTRACT
Predicting fault -prone software components is an economically important activity due to limited budget allocation for software testing. In recent years data mining techniques are used to predict the software faults .In this research, we present a cluster based fault prediction classifiers which increases the probability of detection. The expectation from a predictor is to get very high probability of detection to get more reliable and test effective software. In our experiments, we used fault data from mission critical systems. In this paper we have used discretization as preprocessing and cluster based classification for prediction of fault-prone software modules. Clustering based classification allows production of comprehensible models of software faults exploiting symbolic learning algorithms. To evaluate this approach we perform an extensive comparative analysis with benchmark results of software fault prediction for the same data sets. Our proposed model shows better results than the standard and benchmark approaches for software fault prediction. Our proposed model gives superior probability of detection (pd) 83.3% and balance rates 685%.
General Terms
Software fault prediction, Software Metrics
Keywords
Error Prone, Software fault prediction, software metrics
1.
INTRODUCTION
The demand of highly reliable and secure system is increasing day by day. To fulfill these demands by the ever-increasing power of computing devices, systems are growing complex. Due to the complexity of these systems, effort and cost incur in development is increasing. Software complexity is the main source of failure and potential hazards. High quality software within allocate budget requires a careful planning and cost effective use of testing resources. In context of mission critical or safety and business critical needs more reliability and therefore requires more testing and resources.
Testing phase is the most expensive, time and resource consuming phase of the software development lifecycle requires approximately 50% of the whole project schedule [1, 2]. So an effective and intelligent test strategy can minimize the time of testing by using resources efficiently. Various methods for minimization of testing effort, inspections [3], manual software reviews or automated models [4], [5] are proposed. A panel at IEEE Metrics 2002 concluded that manual software reviews can find approximately 60% of faults [26]. Automated models proposed for fault prediction are useful tools for software organizations and significantly better in terms of fault detection performance, compared to other verification , validation and testing activities
[5][17][18]. These automated models uses static code attributes such as Lines of Code (LOC) and the McCabe/Halstead complexity attributes that can be easily extracted from source code repositories even for large systems.
Software fault prediction uses various static code software metrics such as Halstead, Mc- Cabe metrics etc. to categorize modules and predicting them either falt-prone (fp) or non-fault prone ( nfp) modules by using classification model derived from the data of previous projects. Software fault predictions models can estimate number of faults in software modules as well as which module is faulty. So the predictive models are easy to use and faster to run for highlighting fault-prone modules compared to inspections [4][5][7].Fault prediction models are useful tools for software organizations to manage their testing resources effectively through focusing on fault-prone software modules extracted from software repositories to improve software quality. The software repositories contain years of software project development data, including all of the versions of the project. Some common types of software repositories are source code version control system repositories, bug repositories, and communication archives etc [5][8] .
Many researchers have already worked towards this end and various software metrics and techniques like linear regression, discriminant analysis, decision trees, neural networks and Naive Bayes classification have been analyzed in previous research for fault prediction [5][8][9][35].
This study specifically includes projects of NASA MDP program. We produce the results of experiments on these datasets using cluster based classification after preprocessing, in order to compare it by Menzies et al. framework for the same NASA dataset [5]. We use the same probability of detection pd, probability of false alarm (pf) and balance as performance measure in order to analyze the effectiveness of our framework. Our results indicate that cluster based classification using faulty data at static code attributes may increase the prediction performance significantly, while removing the need for feature subset selection.
easily be repeated, improved or refuted and evaluated by other researchers.
Our conclusion is that, we also found that data mining using static code attributes to learn fault predictors is useful. Given our new results by clustering based classification applied after discretization, these predictions are much better than previously demonstrated [5]. In the following section, related work, models developed for fault prediction are explained. After describing the experimental design and the results, conclusions will be given.
2.
RELATED WORK
Researchers have used various methods such as statistical analysis, regression, Genetic Programming [11], Decision Trees [12], Neural Networks [13], Naïve Bayes [5], Case-based Reasoning [14], Fuzzy Logic [15] and Logistic Regression [16] for software fault prediction. Elish et al. [17] investigated the performance of Support Vector Machines (SVMs) and found SVM better than, or at least is competitive against the other statistical and machine learning models in the context of four NASA datasets. They compared the performance of SVMs with the performance of Logistic Regression, Multi-layer Perceptrons, Bayesian Belief Network, Naive Bayes, Random Forests, and Decision Trees. They used correlation based feature selection technique (CFS) to down select the best predictors out of the numbers of independent variables in the datasets. Catal et al. [18] investigated effects of dataset size, metrics set, and feature selection techniques and found RandomForests provide the best prediction performance for large datasets and Naive Bayes is the best prediction algorithm for small. Tomaszewski [19] have conducted Statistical models vs. expert estimation for fault prediction and found statistical techniques performed superior to locate software fault than an expert estimations approach.
Turhan et al. [22] analyzed the effects of preprocessing of software fault data from NASA with PCA, subset selection and weighted Naive Bayes and concluded that either pre-processing software fault data with PCA or using weighted Naive Bayes should be preferred rather than subset selection for Naïve Bayes models.Static code attributes like lines of code and the McCabe/Halstead attributes are easy to extract, use and provides reliable facts about the software. So they are widely used for software fault prediction. Menzies et al. [5] reported that Naive Bayes with logNums filter achieves the best performance in terms of the probability of detection (pd-71%)and the probability of false alarm (pf-25%) .They also stated that there is no need to find the best software metrics group for software fault prediction because the performance variation of models with different metrics group is not significant. Almost all the software fault prediction studies use metrics and fault data of previous software release to build fault prediction models, which are called ‘‘supervised learning” approaches in machine learning community.
There have been discussions on finding the best classifier for fault predictors. Lessmann et al. [35] argued that their 15 best performing classifiers were statistically indistinguishable from each other in terms of the area under the receiver operating characteristic (ROC) curve. The authors did not use any filtering or transformation techniques. Instead, they used the algorithms on the original data to measure their effectiveness on detecting fault-prone modules.
We used NASA MDP data from promise repository which is an open source repository for fault data [25]. Therefore; all projects used in this study are available online. So, this work can easily be repeated, improved or refuted by other researchers [24][22] .We present a fault prediction model based on cluster based classification for mission critical softwares. Our technique achieved probability of detection (pd-83%) which is better than the earlier models.
Fault predictors as early warning mechanisms, would be very helpful for practitioners in order to improve product quality in mission critical software in a shorter time and with fewer resources, compared to other verification, validation and testing activities [28]. In this research we use static code attributes as predictor variables. A complete list of these attributes is available on line in the Promise repository [24].
3.
EXPERIMENTAL DESIGN
From an industrial perspective, software managers aim to decrease their testing efforts while decreasing fault rates, thereby producing high quality real time systems. Since developers eliminate most of the faults in the software with less testing effort, they would, in turn, improve their product quality. We observed that cluster based classifiers would detect 81% of the faulty modules .Also the cluster based classification decreases the false alarms with increased detection rates. In mission critical systems high detection rates at the cost of false alarms may be a desirable outcome. However, in commercial applications, companies need to employ cost effective oracles, since an increase in false alarms would waste inspection costs by guiding testers through actually safe modules. Therefore, in this paper, our objective is “building a learning-based fault predictor for mission critical software that would decrease false alarms while producing high detection rates’’. We used a cluster-based classification framework in which faulty data are grouped into clusters. In our experiment we use supervised discretization tasks. We first discretize the data then cluster the data using clustering technique for the interdependencies among different attributes. We performed this analysis on same datasets used by Menzies et al. and compared the results of our method with the Menzies et al[5] results .In all experiments, we follow the procedures of conceptual replication studies, in which diverse sources and their effects on the results of the same research question are observed by proposing different experimental procedures [43]. As indicated by Shull et al. [43], replications help the software engineering researchers to address internal and external validity problems. These types of studies also lead the research community to build a solid knowledge about the influence of conditions on the experimental results and observations. Similarly in our case study, we observe a recent study on fault predictors for mission critical software and reproduce those via new techniques in order to find the best approach for fault prediction for mission critical software.
Procedure Evaluation data Learning (data, scheme) Input: data - the data on which the learner is built [CM1,PC1,PC3,PC4, MW1,PC2, KC3]
M=10,N=10
Learners-- the learning scheme. [Cluster_based_classification ] Output Result [C_pd, C_pf, C_prec,C_bal] = C_predictor on TEST
// The final performance of pd,pf and balance over M*N way cross validation.
Preprocessing = {discretization} FOR EACH data
D_TRAIN = discretization data // after discretization of data
//construct predictor from C data
C _PREDICTOR = Train LEARNER with C_TRAIN // construct predictor from D data
D_PREDICTOR = Train LEARNER with D_TRAIN //Evaluate both predictors on the test data
[C_pd,C_pf,C_Balance] = C_ predictor on TEST [D_pd, D_pf, D_Balance] = D_ predictor on TEST END
Fig 1 Pseudo code for the experimental design
Lessman et al. [35] reported that data preprocessing or engineering activities such as the removal of noninformative features or the discretization of continuous attributes may improve the performance of some classifiers [35]. Menzies et al. also reported that their Naive Bayes classifier benefited from log-filter preprocessor [44].
Researchers in the Machine Learning community have introduced many data preprocessing and discretization algorithms. Discretization is the transformation of a continuous variable into a discrete space, grouping together multiple values of a continuous attribute, and partitioning the continuous domain into a finite numbers of non-overlapping intervals. The task of discretizing an input attribute for classification problems is usually divided into supervised discretization, when knowledge interdependency between the class level and attribute values is used for the discretization process and unsupervised discretization, when the class values of the instances are unknown or not used. The methods for unsupervised discretization are width and equal-frequency binning [37]. The equal width divides the range of values of a numerical attribute into a pre-determined number of equal intervals. The equal frequency divides the range of values into a pre-determined number of intervals that contain equal number of instances. Supervised algorithms are maximum entropy [38], Patterson and Niblett [39], statistics- based algorithms like ChiMerge [40] and Chi2 [41].
Fayyad & Irani developed a concept of entropy based partitioning in [36].Dougherty, Kohavi, and Sahami in [42] made comparison of the uniform binning, an entropy based method proposed by Fayyad and Irani [3], using two induction algorithms: C4.5 and a Naive-Bayesian classifier and reported that the entropy based disretization was the most promising one. We have used entropy based preprocessing of fault data preprocessing.
The binary discretization used, to divide the values of continuous attribute into two intervals. We used the state-of-the-art supervised discretisation technique developed by Fayyad and Irani [3] for binary discretization, of continuous attribute into two intervals. This entropy based discretization process is a viable choice as it improve accuracy reported by researchers [17][20].
Let assume a set of samples S, Entropy for S is calculates as
Entropy(S) = - p1*log2 (p1) – p2*log2 (p2)
Now suppose if S is partitioned into two intervals S1 and S2 using boundary T, the entropy after partition can be calculated as the equation given below
The T is taken from the midpoints of the feature values. The goal is to get the maximum information gain after the split and the gain is calculated as
Gain(S,T) = Entropy(S) - E(S,T).
Recursively evaluating all possible splits and then selecting best split(s) with maximum gain is chosen. A partition point is decided on for discretization which minimizes the entropy function. The process is recursively applied to obtain partitions until it minimizes the difference to acceptable level e.g.,
Minimal descriptive length principle is used by [3] to determine stopping criteria for recursive discretization process.
Once the discretization process has been completed, the discretized data is used by cluster based supervised classification algorithm for building the predictive model. We have changed the binary partition range to minimum and maximum values of corresponding attribute. Clustering is one method to find most similar groups from given data, which means that data belonging to one cluster are the most similar; and data belonging to different clusters are the most dissimilar. Finally we generated a simple meta-classifier that uses clusters for classification. Any clustering algorithm such as the hard c-means, mountain clustering algorithms can be used. We use the Simple k-means clustering algorithm that uses a fixed number of clusters.
3.1 Clustering algorithm
The K-means clustering algorithm starts with a training data set and a given number of clusters K. The samples in the training data set are assigned to a cluster based on a closeness measurement. Closeness is measured by Euclidean distance, cosine similarity, Manhatten distance etc. We have used Euclidean distance to measure the similarity. The centroid is the mean of data vectors in the cluster.
Algorithm: k-mean clustering
Input: A set of N data Vectors
X=(x1……….xn) in d
K: - the number of clusters
Output: A set of k clusters partition of the data vectors given by the cluster identity vector Y= {y1,…,yn}, {1,……K}
Initialization: Select arbitrarily K initial cluster centroid vectors { 1,………. k};
Repeat
Each data vector xn, is assigned to the cluster with the closed centroid k
Recompute the centroid of each cluster based on mean value of the data vector
Until no change in centroid
) ( | |
| | ) ( | |
| | ) , (
2 2 1 1
S
S
S
S
EntS Ent
S T S
E
(
,
)
)
(
S
E
T
S
The cluster based classification algorithm takes a cluster built on a data set with a class attribute. K mean clustering is used to find the cluster in the fault data corresponding to faulty and not faulty class separately. We have taken K=2. We have used Euclidean distance in this work. Our model takes the benefit of supervised discretization process to reduce the error. For a new instance to be in faulty cluster should have minimum value from the center of the cluster for all features.
We have overcome the sampling bias by using M*N-way cross validation where both M and N are selected as 10 [44]. We create 10 stratified bins: 9 of these 10 bins are used as training sets and the last one is used as the test set. We randomize the dataset M = 10 times and create N = 10 sets in each iteration. The pseudo code of the model is shown in Fig1.
4.
DATASET USED
We have used NASA MDP program data which is publicly available [25]. NASA makes extensive use of contractors who are contractually obliged (ISO-9O01) to demonstrate their understanding and usage of current industrial best practices. These contractors service many other industries; for example, Rockwell-Collins builds systems for many government and commercial organizations. For these reasons, other noted researchers, such as Basili et al. , have argued that conclusions from NASA data are relevant to the general software engineering industry.
The seven projects MW1,PC1, PC2,PC3,PC4, CM1 and ,KC3 are from NASA MDP program. Due to unavailability of KC4 dataset we have excluded KC4 from our study. Each data set is encompassed of several software modules, together with their static code attributes and associated corresponding number of faults. After metric and bug data extraction from software repositories , modules that contain one or more bugs were marked as fault prone (fp), and where no bug were reported those modules were treated as non fault prone (nfp). The fault data sets which are taken from promise repository includes LOC counts, several Halstead attributes, McCabe complexity measures as well as various other static code attributes. Individual software metric feature per data set, together with percentage faulty modules and some general descriptions are given in Table 1.
Table 1: Data set used in Study
Sourc e
No of Modul e in Softwa re
Featur es
LOC % Fault y
Lan gua ge
Description
MW1 403 37 8341 7 C A zero
gravity experiment related to combustion PC1 1,107 21 25,92
4
6.94 C++ Flight software for earth orbiting satellite. PC2 5590 21 25K 6 C Flight
software for earth
orbiting satellite. PC3 1563 21 1564 10 C Flight
software from an earth orbiting satellite PC4 1458 37 1458 12 C Flight
software from an earth orbiting satellite CM1 498 21 14,76
3
9.83 C Spacecraft instrument
KC3 459 39 8K 9 JAV
A
Storage management for ground data
4.1
Performance Measures
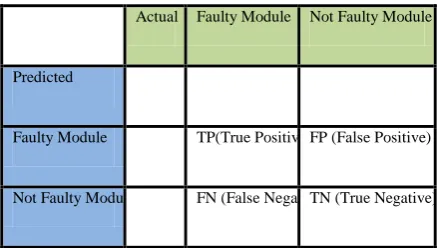
The accuracy and performance of prediction models for two-class problem, defective or not defective is typically evaluated using a confusion matrix. A confusion matrix contains information about actual and predicted classifications done by a classification system. In this study, we used the commonly used prediction performance measures: probability of detection (pd), probability of false alarm (pf), balance (bal) to evaluate and compare prediction models. These measures are derived from the confusion matrix. A confusion matrix is shown below.
Actual Faulty Module Not Faulty Module
Predicted
Faulty Module TP(True Positive) FP (False Positive)
Not Faulty Module FN (False Negative) TN (True Negative)
False alarms, pf, should be 0, meaning that the predictor should never label a defect-free module as defective. In general, an increase in pd would also increase pf rates since the model triggers more often to achieve the ideal case [5]. To see how close our estimates are to the ideal case, we use a balance metric, which is the Euclidean distance between the ideal point and position on the ROC curve in reality.
Pd =TP/ (TP+FN) Pf =FP/ (FP+TN)
2 ) 1 ( ) 0 ( 1
2
2 pd
5.
EXPERIMENTAL RESULTS
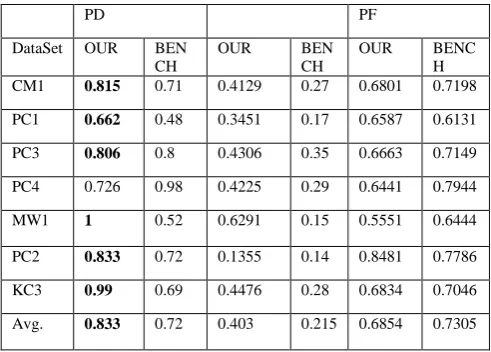
In this work the objectives are (a) building an Cluster based classifiers to predict fault-prone modules for NASA software systems, and (b) achieving high pd rates and balance rates using preprocessing and CBC . We investigate separate performances of the CBC algorithm with and without discretization and found that the results after discretization are significantly better than we are applying it on raw data. According to the findings, we calibrate the proposed model using discretization in CBC to improve the prediction performance in terms of pd and balance rates. We compare CBC with the model proposed on NASA datasets by Menzies et al.[5] to validate its performance. We conjecture that if our results are at least comparable with their study, we can verify that the CBC approach is worth using in the context of NASA software. In Table 2, the prediction performances of CBC and the model of Menzies et al. 2007 are presented. From the results, we could argue that CBC achieves good results for NASA MDP datasets.
We outperform the results of Menzies et al. 2007 in terms of pd on average from 72% to 83% with cost of pf on average from 21% to 40%. When we analyze our cluster based classification for all embedded projects, the average performance is (83, 40%) in terms of (pd, pf). This means that the ensemble can predict 8 out of 10 defective modules, while making false alarms in 4 out of 10 defect-free modules.
Table 2: Comparison of CBC Result Set with Menzies et al. 2007
PD PF
DataSet OUR BEN CH
OUR BEN
CH
OUR BENC H CM1 0.815 0.71 0.4129 0.27 0.6801 0.7198 PC1 0.662 0.48 0.3451 0.17 0.6587 0.6131 PC3 0.806 0.8 0.4306 0.35 0.6663 0.7149
PC4 0.726 0.98 0.4225 0.29 0.6441 0.7944 MW1 1 0.52 0.6291 0.15 0.5551 0.6444
PC2 0.833 0.72 0.1355 0.14 0.8481 0.7786 KC3 0.99 0.69 0.4476 0.28 0.6834 0.7046 Avg. 0.833 0.72 0.403 0.215 0.6854 0.7305
The framework comparison results are summarized in Table 2 which shows the results in terms of pd,pf and balance. From it, we find that our framework outperformed in terms of pd that of Menzies et al. for 6 out of 7 data sets (each “winner” is denoted in bold). The mean probability of detection of the Menzies et al. 2007 framework over the 7 data sets is 72.7 percent, and the mean probability of detection of the proposed framework is 83.3 percent, with an improvement of 10.6 percent. The mean prediction balance of the MGF (Menzies et al.) framework over the 7 data sets is 73.0 percent, and the mean prediction balance of the proposed framework is 69 percent. This suggests that the proposed framework worked well for probability of detection.
6.
CONCLUSION
Software fault prediction can be regarded as one piece of the solution for timely and cost effective software development. It is argued by Lessmann et al. that fault prediction techniques should not be judged on their predictive performance alone, but that other aspects such as computational efficiency, ease of use, and especially comprehensibility should also be paid attention to [35].We conclude that discretization on software fault data with entropy based supervised discretization should be preferred with CBC approach perform better than naive Bayes with logNums. The time complexity of CBC technique is also good for huge data. From a software practitioner’s point of view, these results are useful for detecting faults before proceeding to the test phase. In this sense, test resources can be managed more efficiently. The contributions of this research are two folds: In empirical studies replications are very important to improve, refute, and validate the results of others [5, 22]. This research is not only a replication study, but also provides an effective software fault predictor model for NASA MDP dataset.
On all projects, CBC detects 83% defective modules while producing 40% false alarms. Furthermore, it manages to the balance rates from 68.5% on average (all projects). For further development we will attempt to use intelligent computing for data preprocessing or activities for the removal of non informative features or feature extraction to improve the performance of software fault prediction models
7.
REFERENCES
[1] M.J. Harrold, Testing: a roadmap, in: Proceedings of the Conference on the Future of Software Engineering, ACM Press, New York, NY, 2000.
[2] B.V. Tahat, B. Korel, A. Bader, Requirement-based automated black-box test generation, in: Proceedings of the 25th Annual International Computer Software and Applications Conference, Chicago, Illinois, 2001, pp. 489–495
[3] Wohlin, C., Aurum, A., Petersson, H., Shull, F., & Ciolkowski, M. (2002). Software inspection benchmarking— A qualitative and quantitative comparative opportunity. In METRICS ’02: Proceedings of the 8th international symposium on software metrics (pp. 118–127). IEEE Computer Society.
[4] Basili, V. R., Briand, L. C., & Melo, W. L. (1996). A validation of object-oriented design metrics as quality indicators. IEEE Transactions on Software Engineering. IEEE Press, 22, 751–761
[5] Menzies, T., Greenwald, J., & Frank, A. (2007). Data mining static code attributes to learn defect predictors. IEEE Transactions on Software Engineering, IEEE Computer Society, 32(11), 2–13
[6] F. Shull, V.B. Boehm, A. Brown, P. Costa, M. Lindvall, D. Port, I. Rus, R. Tesoriero, and M. Zelkowitz, “What We Have Learned About Fighting Defects,” Proc. Eighth Int’l Software Metrics Symp., pp. 249-258, 2002
international conference on predictor models in software engineering. Vancouver, Canada.
[8] N. Nagappan and T. Ball, Static Analysis Tools as Early Indicators of Pre-Release Defect Density, Proc. Intl Conf. Software Eng., 2005.
[9] T. Khoshgoftaar and E. Allen, “Model Software Quality with Classification Trees,” Recent Advances in Reliability and Quality Eng., pp. 247-270, 2001.
[10] Li, Q., & Yao, C. (2003). Real-time concepts for embedded systems. San Francisco: CMP Books.
[11] M. Evett, T. Khoshgoftaar, P. Chien, E. Allen, GP-based software quality prediction, in: Proceedings of the Third Annual Genetic Programming Conference, San Francisco, CA, 1998, pp. 60–65.
[12] T.M. Khoshgoftaar, N. Seliya, Software quality classification modeling using the SPRINT decision tree algorithm, in: Proceedings of the Fourth IEEE International Conference on Tools with Artificial Intelligence, Washington, DC, 2002, pp. 365–374.
[13] M.M. Thwin, T. Quah, Application of neural networks for software quality prediction using object-oriented metrics, in: Proceedings of the 19th International Conference on Software Maintenance, Amsterdam, The Netherlands, 2003, pp. 113–122.
[14] K. El Emam, S. Benlarbi, N. Goel, S. Rai, Comparing case-based reasoning classifiers for predicting high risk software components, Journal of Systems and Software 55 (3) (2001) 301–320.
[15] X. Yuan, T.M. Khoshgoftaar, E.B. Allen, K. Ganesan, An application of fuzzy clustering to software quality prediction, in: Proceedings of the Third IEEE Symposium on Application-Specific Systems and Software Engineering Technology, IEEE Computer Society, Washington, DC, 2000, pp. 85.
[16] H.M. Olague, S. Gholston, S. Quattlebaum, Empirical validation of three software metrics suites to predict fault-proneness of object-oriented classes developed using highly iterative or agile software development processes, IEEE Transactions on Software Engineering 33 (6) (2007) 402–419.
[17] K.O. Elish, M.O. Elish, Predicting defect-prone software modules using support vector machines, Journal of Systems and Software 81 (5) (2008) 649–660.
[18] Catal C, Diri B. ”Investigating the effect of dataset size, metrics sets, and feature selection techniques on software fault prediction problem”, Information Sciences. 179:pp.1040-1058,2009.
[19] P. Tomaszewski, J. Hakansson, H. Grahn, and L. Lundberg, Statistical models vs. expert estimation for fault prediction in modified code-an industrial case study, The Journal of Systems and Software, vol. 80, no. 8, pp. 12271238, 2007.
[20] I. Gondra, Applying machine learning to software fault-proneness prediction, Journal of Systems and Software 81 (2) (2008) 186–195.
[21] T. Quah, Estimating software readiness using predictive models, Information Sciences, 2008
[22] B. Turhan and A. Bener, Analysis of Naive Bayes Assumptions on Software Fault Data: An Empirical Study, Data & Knowledge Eng., vol. 68, no. 2, pp. 278-290, 2009.
[23] Ayse Tosun Misirli, Ayse Basar Bener, Burak Turhan: An industrial case study of classifier ensembles for locating software defects. Software Quality Journal 19(3): 515-536 (2011)
[24] Boetticher, G., Menzies, T., & Ostrand, T. J. (2007). The PROMISE repository of empirical software engineering data West Virginia University, Lane Department of Computer Science and Electrical Engineering.
[25]http://promise.site.uottowa.ca/SERepository
[26]Amasaki, S., Takagi, Y., Mizuno, O., & Kikuno, T. (2005). Constructing a Bayesian belief network to predict final quality in embedded system development. IEICE Transactions on Information and Systems, 134, 1134– 1141.
[27] Kan, S. H. (2002). Metrics and models in software quality engineering. Reading: Addison-Wesley.
[28]Oral, A. D., & Bener, A. (2007). Defect Prediction for Embedded Software. ISCIS ’07: Proceedings of the 22nd international symposium on computer and information sciences (pp. 1–6).
[29]T.M. Khoshgoftaar, N. Seliya, Fault prediction modeling for software quality estimation: comparing commonly used techniques, Empirical Software Engineering 8 (3) (2003) 255–283
[30]Zhong, S., Khoshgoftaar, T.M., and Seliya, N., “Analyzing Software Measurement Data with Clustering Techniques”, IEEE Intelligent Systems, Special issue on Data and Information Cleaning and Pre-processing, Vol (2), 2004, pp. 20-27.
[31]T. Menzies, J. DiStefano, A. Orrego, and R. Chapman, “Assessing Predictors of Software Defects,” Proc. Workshop Predictive Software Models, 2004.
[32]Fenton, N., Neil, M., “A Critique of Software Defect Prediction Models”, IEEE Transactions on Software Engineering, Vol 25(5), 1999, pp.675-689.
[33]M. Halstead, Elements of Software Science. Elsevier, 1977.
[34]T. McCabe, “A Complexity Measure,” IEEE Trans. Software Eng.,vol. 2, no. 4, pp. 308-320, Dec. 1976.
[35]S. Lessmann, B. Baesens, C. Mues, and S. Pietsch. Benchmarking classification models for software fault prediction: A proposed framework and novel findings. IEEE Transactions on Software Engineering, 2008.
[37]D. Chiu, A. Wong, and B. Cheung, “Information Discovery through Hierarchical Maximum Entropy Discretization and Synthesis,” Knowledge Discovery in Databases, G. Piatesky-Shapiro and W.J. Frowley, ed., MIT Press, 1991.
[38]X. Wu, “A Bayesian Discretizer for Real-Valued Attributes,” The Computer J., vol. 39, 1996.
[39]A. Paterson and T.B. Niblett, ACLS Manual. Edinburgh: Intelligent Terminals, Ltd, 1987
[40]R. Kerber, “ChiMerge: Discretization of Numeric Attributes,” Proc. Ninth Int’l Conf. Artificial Intelligence (AAAI-91), pp. 123-128, 1992.
[41]H. Liu and R. Setiono, “Feature Selection via Discretization,” IEEE Trans. Knowledge and Data Eng., vol. 9, no. 4, pp. 642-645, July/ Aug. 1997.
[42]Dougherty, J., Kohavi, R., and Sahami, M. (1995), Supervised and Unsupervised discretization of continuous features. Machine Learning 10(1), 57-78.
[43]Shull, F. J., Carver, J. C., Vegas, S., & Juristo, N. (2008). The role of replications in empirical software engineering. Empirical Software Engineering Journal, 13, 211–218.
[44]Hall, M. A., & Holmes, G. (2003). Benchmarking attribute selection techniques for discrete class data mining IEEE transactions on knowledge and data engineering. IEEE Educational Activities Department, 15, 1437–1447.
[45]J. Lung, J. Aranda, S.M. Easterbrook, G.V. Wilson, On the difficulty of replicating human subjects studies in software engineering, in: Proceedings of the 30th International Conference on Software Engineering, 2008, pp. 191–200.
[46]T. Menzies, J. DiStefano, A. Orrego, and R. Chapman, “Assessing Predictors of Software Defects,” Proc. Workshop Predictive Software Models, 2004.
[47]J. MacQueen. Some methods for classification and analysis of multivariate observations. In Proc. 5th Berkeley Symp. Math. Statistics and Probability, pages 281{297, 1967.
[48] Lee, E. A. (2002). Embedded software, advances in computers 56. London: Academic Press.