* To whom all correspondence should be addressed.
Environmental Monitoring of Land Cover in the River Basins
Tatiana Trifonova1,2, Roman Repkin2 and Natalia Mishchenko2
1Lomonosov Moscow State University, Faculty of Soil Science, Russia, 119991, Moscow, GSP-1, Leninskie Gory.
2Vladimir State University named after Alexander and Nikolay Stoletovs, Department of Biology and Ecology, Russia, 600000, Vladimir, Gorky str., 87
DOI: http://dx.doi.org/10.13005/bbra/1978
(Received: 19 July 2015; accepted: 14 September 2015)
The results of monitoring the state of soil and vegetation in the river basins of the European part of the Russian Federation are shown, with the use of soil-production of potential in combination with the vegetation index (NDVI). Assessment of the 12 major river basins showed that its highest values were characteristic of ecosystems in the basins of the Dnepr, the Kuban and the Volga rivers, but in the latter case this indicator is significant, mainly due to the basin of the Oka River. The most significant stock of phytomass is concentrated in the basins of the Neva and the Oka rivers. Analysis of the dynamics of NDVI (MODIS) for small basins of the Klyazma River for the period between 2000 and 2014 made it possible to identify a group of basins characterized by stability of this indicator and its high values.
Key words: Soils and vegetation cover, watersheds, vegetation index, reserve of phytomass.
Constant monitoring of the vegetation and soil cover of various natural-territorial complexes is one of the tasks of environment objects ecological monitoring. Here, it is necessary to consider that the state of the monitored objects is constantly changing, so the changes are comprehensive and depend on temporal and spatial parameters. Therefore, scientifically grounded assessment of natural resources, including biological productivity of various regions and landscapes of Russia, is crucial for environment management.
One of the most important parameters for environmental monitoring is productivity of the vegetation cover, which largely determines stability of the ecosystem. (Isachenko (1990); Romanovsky
et al., (2004); Osem et al., (2004), and others). This indicator largely depends on the condition of the soil cover, which plays a special role in terrain bioecocenoses, since it brings together all other components into a single functioning system. Restoring and maintaining soil productive capacity is one of the priority directions in the rational use of the nature. The state of the soil cover has a significant influence on the production potential of the area: only in case of sustainable fertility soils can fully realize their most important productive (creation of biomass) and ecological (environmental) functions (Armand (1988); Nikitin (1982); Dobrovolsky (2005), and others).
of natural and anthropogenic ecosystems. It is necessary to analyze the changes in the indicators of ecosystems productivity, which are the result of changes in the structure of the natural-territorial complexes.
Using the remote sensing data that cover large areas and reflect the various relations makes it possible to eliminate accidental or short-term changes, focusing on the processes of transformation in the ecological state of the observed ecosystems (Bartalev, Lupyan (2005)); Surin, Shubina (2006)).
Currently, comprehensive monitoring of the condition of vegetation actively uses vegetation indices that are calculated from the remote sensing data (Besk, Goetz (2011); Gamon et al., (2005); Carlson And Ripley (1997)). With the use of the same methods, the condition of soil is assessed, soil mapping is performed, and physical and chemical properties of soils are studied (Korolyuk, Shcherbenko (2003)).
However, virtually no comprehensive indicators that reflect the status of both soil and vegetation are provided, especially at the regional level, although they are very necessary for environmental monitoring.
For the purpose of ecological characterization of the ecosystems in river basins, we previously proposed to use the indicator of soil production potential, which generalizes many years information about vegetation productivity, accumulation of biomass, and the factors that affect activity of the production processes (Trifonova et al., (2012); (Trifonova et al., (2014)).
Objects and research methods Research methods
The basin approach
The basin approach was used in the research. The catchment basin is one of the fundamental geomorphological elements that testifies for orderliness in the landscape (landscape stationarity), which is expressed as systematic and recurring dependence between the slopes, soils, location, and intensity of activities of both fluvial and lithogenic streams. The structure of migration streams and soil cover structure are determined by the structure of the basin, and its various morphological elements are also characterized by different soil content (Dobrovolsky (2005)). At the same time, soil is a part of the ecosystem, and is
considered to be a result of self-organization of the “phytocenosis – soil” system in fixed lithological, geomorphological and climatic conditions. All processes in the territory of the river basins are interrelated, which gives river basins the territorial significance of geosystems. Therefore, the role of the basin approach in assessing soil cover and changes in productivity of the vegetation cover becomes more and more important, since it makes it possible to adequately formalize the models that describe the “phytocenosis – soil” system, thus removing the problem of defining the borders of the phytocenoses.
Assessing the soil productive potential by the in-situ data
For comprehensive characterization of the ecosystems soil and vegetation, we propose to use the “soil-productive potential” (SPP) indicator, which characterizes the ability of natural or semi-natural ecosystems to produce phytomass in certain soil-and-climatic conditions. It characterizes the resource of the ecosystems via the indicator that averages the following parameters (in points) (Table 1):
a) the phytomass resources (the total of live above-ground and underground organs of plants in the indices of absolutely dry mass (t/ha));
b) phytomass production (increase in the
phytomass per year per unit of area (t/ha per year));
c) natural soil fertility; d) yield of the crops; e) bioclimatic parameters;
f) soil-ecological index (SEI) ((Shishov et al., (1991)).
For the convenience of comparative assessment, all characteristics are ranged by dividing them into equal intervals on a 5-point scale with subsequent consolidation of the data to a generalized indicator by summing up the scores. As a result, both soil production potential of the natural ecosystems of the river basin, and the total soil production potential are calculated (Table 2). The vegetation status was determined by analyzing the Normalized Difference Vegetation Index (NDVI)
generic, on-the-spot and monitoring indicator of the soil production potential defined remotely. This index provides quantitative assessment of soil projective coverage by vegetation, makes it possible to assess the state of plants (Ding et al., 2014; Rodrigues et al., 2013; Kim et al., 2012; Jia et al., 2014), and therefore is a quite informative indicator for comprehensive assessment of productivity of the aboveground parts of vegetation in the territories of any rank at a particular moment. NDVI is also most resistant to changes of sun height above the horizon, atmospheric conditions and sensor type (Rackwick, Sitnikova (1981)).
However, we believe that at the same time this index characterizes (directly or indirectly) the condition of the soil, since the state of vegetation is directly dependent on soil properties, therefore, the physico-chemical parameters of the soil indirectly determine the indices of spectral reflectivity of the ecosystems, including NDVI. The method of determining NDVI dynamics
For searching for dynamically changing objects, we proposed a method for determining NDVI dynamics that is based on summing NDVI differences on various dates (hereinafter referred to as the method of NDVI index dynamics).
The general formula for calculating NDVI is the following:
where i is the sequence number of a space image in ascending order of the date of recording, and N is the number of images.
MATERIALS
The following materials were used for assessing the soil-productive potential of the river basins: 1. Electronic maps of the studied area: a topographic map, a soil map, a phytomass reserve and production map, a map of soil-ecological zoning (Dobrovolsky, Urusevskaya (1997)) 2. Statistical and literature data that describe the landscape structure, climatic and soil conditions, phytomass reserves and productivity of the vegetation cover of the studied territory; (Productivity of ecosystems in Northern Eurasia.
http://biodat.ru/db/prod/index.htm; Bazilevich (1993); Bazilevich et al., (1986)) 3. Remote sensing data (Landsat ETM+; MODIS; “Meteor”); 4. Satellite images were digitally processed in the Erdas Imagine application, GIS analysis was performed in the rc GIS application.
Studied objects
The objects of the study were the river basins in the European part of Russia (Figure 1). Several key river basins were chosen for the detailed analysis, which most fully reflect the diversity of the natural systems and landscapes in the studied area. These are catchments of the Mezen, the Onega, the Klyazma, the Oka, the Samara, the Voronezh and the Sal rivers (Figure 2), from the zones of the boreal, sub-boreal and nemoral forests to dry steppes in the south of Russia in the basin of the Sal River; from the tundra-gumbo and podzolic soils to the most fertile and powerful black soils in the basin of the Voronezh River and chestnut soils; from weakly inhabited to most developed territories. The selected key basins belong to the water catches of the Arctic Ocean (the Mezen, the Onega rivers), the Atlantic Ocean (the Voronezh and the Sal are tributaries of the Don River that flows into the Azov Sea) and the Volga-Caspian internal-drainage basin (the Klyazma, the Oka and the Samara rivers). Despite large covered areas, all these basins are located within a single geological basement of the East European (Russian) platform covered by thick layers of sedimentary sheath, and within the temperate climatic zone from temperate-cold to temperate-warm continental climate (Dobrovolsky (1997); Mishon (2000); Resources of surface water of the USSR (1964)).
Mezen is a river in Russia that flows through the territory of the Republic of Komi and the Arkhangelsk region. The length of the river is 966 km, and the area of its drainage basin is 78,000 km². The mean annual flow rate is 886 m³/h, the maximum flow rate is 9,530 m³/h. The Mezen basin belongs to the Far North and is located near the border of the temperate and subarctic climatic zones, zones of taiga and forest-tundra; these are the areas with cool summers and long cold winters. The vegetation period is 50 to 80 days long.
regulated by lakes. The mean annual flow rate in the creek is 505 m³/h, and the maximum flow rate is 4,530 m³/h. The basin is located in the taiga zone, in the area of spreading podzolic soils.
The basin of the Oka River belongs to the Volga basin. Oka is the second largest tributary of the Volga River, originating in the Central Russian Upland, the total length of the river is 1,500 km; the total catchment area of 245 thousand km²; the mean annual discharge of water is about 1,000 m³/sec; in Nizhny Novgorod.
According to soil-ecological zoning, the basin of the Oka River is located within two geographical zones (boreal and sub-boreal), and is characterized by diversity of the natural conditions. Various types of vegetation are formed in its territory: in the North, the boreal type is present (the North Atlantic formations: middle and southern taiga pine forests, broadleaved-coniferous forests); in the middle part of the basin – the nemoral type (the Eastern European formation: oak forests with other broadleaved trees, pine and broadleaved forests), in the South it is replaced by the steppe vegetation type (the Black Sea formation: meadow steppes and meadows – forest steppe with oak forests).
The soil cover is represented by three soil-ecological zones: sod-podzolic soils of the southern taiga; gray forest soils of broadleaved forests; – podzolized, leached and typical black soils and gray forest soils.
In the structure of land use in the basin, a decrease in forest area to the South (from 49% to 14%) and an increase in the share of agricultural land (from 39% to 80%) are observed. The Klyazma River, the largest left tributary of the Oka River, originates on the southern slope of the Klin -Dmitrov ridge of the Smolensk-Moscow upland. The length of the river is 686 km. The basin of the Klyazma River is located entirely in the sub-taiga (coniferous & broadleaved forests). The vegetation cover of the basin is represented by two major types of vegetation: boreal (in the north) and nemoral (in the central and the south-eastern parts). The soils are sod-podzolic, moderately humous.
Forests are the main natural resource in the catchment area of the Klyazma River, which occupies more than 50% of the area.
Samara is a river in the Orenburg and the Samara regions, a left tributary of the Volga River.
Its length is 594 km, and the area of the basin is 46.5 thousand km². The mean annual discharge in the middle reaches is 50 m³/sec. The water is mineralized, belongs to the hydro-carbonate class, calcium group, and is moderately polluted. The terrain is lowland and hilly. The vegetation is steppe herbs and sod grasses on black and chernozem-like soils in the zone with insufficient humidity.
Voronezh is a typical valley river, a tributary of the Don River. It flows through the territory of the Tambov, the Lipetsk and the Voronezh regions. The length of the river, measured from the head, the Polnoy Voronezh River, is 520 km, the length of the Voronezh River itself is 342 km. The area of the basin is 21,600 km²; the water discharge rate close to the Voronezh city is 70.8 m³/s. The basin is located in the forest-steppe and the steppe zone, in the area of distribution of typical, podzolized and leached black soils; it is most agriculturally and industrially developed. The environmental situation is tense.
Sal is the river in the Rostov region, a left tributary of the Don River. Its length is 798 km, and the area of the basin is 21.3 thousand km². The flow rate is 9.9 m³/sec (205 km from the creek). In many places, the river bed is predominantly shallow, especially in the middle reaches, and is overgrown with reeds. The catchment area is a lowland steppe (the Sal steppes), the Eastern part of which reaches the height of 120 m above the sea level.
RESULTS
The soil production potential and the state of commercial lands in the river basins of the European part of Russia
The soil and production capacity of 12 major river basins of the 1st order in the European part of Russia has been assessed. Inside the one with the largest catchment area - of the Volga River - the basins of the Oka and the Kama rivers have been additionally separated and characterized (the river basins of the 2nd order in relation to the main river). The method of imposing the boundaries of the river basins in the zonal areas in the “Arc GIS” was used (Table 2).
Table 1. Assessing soil-productive potential of ecosystems by the in-situ and remote data
Soil production potential Assessment parameters
Soil production potential of natural ecosystems (calculated without 1. Reserve of the phytomass regard to the area of agrocenoses and other anthropogenic objects) 2. Phytomass production
3. Natural soil fertility 4. Bioclimatic parameters Total soil-productive potential of the ecosystem (calculated on the basis 1. Reserve of the phytomass
of the entire area of the basin) 2. Phytomass production
3. Yield of the crops; 4. Soil-ecological index (SEI) On-the-spot monitoring indicator that is determined by the remote sensing data Weighted average NDVI for
certain calendar date
Table 2. The soil production potential of river basins and the state of agrocenoses of the European part of Russia
River Ranking indicators of the soil production Arable Soil ecology Yield, Total
basin potential, score land, % index hw/ha SPP
Specific Specific Humus Bioclimatic (SEI)
phytomass productivity content index agrocenoses
Pesha 6 2 6 3 2 39.0 21.5 17
Neva 9 5 3 8 6.5 43.1 21.7 25
Northern Dvina 7 4 1 6 2.2 39.5 20.6 18
Mezen 6 4 4 5 2 39.0 20.4 19
Pechora 6 3 6 4 2 39.3 19.4 19
Dnepr 9 9 8 9 48.5 48.5 24.6 35
Volga including: 8 8 7 8 35.5 42.7 20.8 31
Oka 9 9 7 9 41 47.1 23.6 34
Kama 7 6 7 7 30.7 41.6 18.7 27
Don 3 9 9 8 62.4 46.9 26.2 29
Ural 3 9 9 7 54.3 41.3 18.7 28
Kuban 5 9 10 8 54 77.6 28.9 32
Terek 1 7 8 6 54.9 48.0 28.9 22
Sulak 3 8 6 3 36.9 41.3 28.9 20
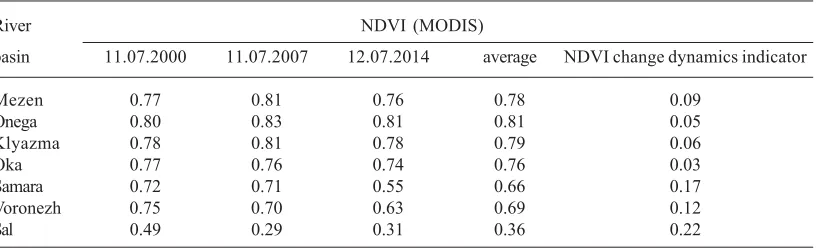
Table 3. The dynamics of NDVI of the key river basins located in the European territory of the Russian Federation
River NDVI (MODIS)
basin 11.07.2000 11.07.2007 12.07.2014 average NDVI change dynamics indicator
Mezen 0.77 0.81 0.76 0.78 0.09
Onega 0.80 0.83 0.81 0.81 0.05
Klyazma 0.78 0.81 0.78 0.79 0.06
Oka 0.77 0.76 0.74 0.76 0.03
Samara 0.72 0.71 0.55 0.66 0.17
Voronezh 0.75 0.70 0.63 0.69 0.12
Sal 0.49 0.29 0.31 0.36 0.22
for the latter, this indicator is mainly significant due to the basin of the Oka River. The analysis of
River basin
The average value of NDVI (according to the MODIS data) for the entire
territory of the basin
NDVI dynamics indicator
Soil-ecological index of agrocenoses/
score
Yield, (hw/ha)/score
Phytomass production in the basin (t/ha per year)/score
Specific phytomass of the basin (t/ha)/score
Soil Production
Potential (SPP)
2014 (July 12)
2007 (July 12)
2000 (July 11)
Aver age value
Polya 0.81 0.82 0.78 0.80 0.05 52.0/3 21.2/4 5.51/2 107.7/3 12
Sudogda 0.83 0.85 0.81 0.83 0.05 41.6/1 13.0/1 6.26/3 120.3/3 8
Suvorosh 0.81 0.83 0.78 0.80 0.07 47.8/2 13.8/1 6.44/3 82.3/2 8
Luh 0.82 0.84 0.79 0.82 0.07 49.0/2 16.3/2 8.41/5 69.9/1 10
Teza 0.82 0.82 0.79 0.81 0.03 41.0/1 21.2/4 6.7/3 135.8/4 12
Uvod 0.81 0.81 0.79 0.80 0.03 53.5/3 18.8/3 6.77/3 133.7/4 13
Nerl 0.80 0.78 0.77 0.78 0.03 65.5/5 23.6/5 4.87/1 109.6/3 14
Koloksha 0.77 0.76 0.77 0.77 0.03 61.7/5 23.4/5 5.93/2 50.5/1 13
Peksha 0.82 0.81 0.79 0.81 0.03 46.4/2 15.9/2 8.04/5 105.8/3 12
Kirzhach 0.81 0.82 0.81 0.81 0.02 50.1/2 14.3/1 5.81/2 145.5/4 9
Sherna 0.79 0.81 0.81 0.80 0.02 46.3/2 13.3/1 7.4/4 112.4/3 10
Vorya 0.76 0.78 0.79 0.78 0.03 52.0/3 21.2/4 4.57/1 93.7/2 10
Tara 0.82 0.85 0.79 0.82 0.09 48.7/2 13.9/1 7.62/4 172.4/5 12
Nerekhta 0.81 0.84 0.79 0.81 0.08 52.3/3 17.6/3 10.07/5 143.4/4 15
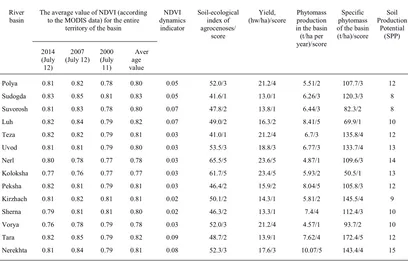
Table 4. Indicators of productivity of the vegetation cover in small basins of the Klyazma River according to the in-situ and remote data
Table 5. The structure of land use in the basins of the Klyazma River
River basin Forests, % Meadows, % Agricultural land, % Water objects, % Swamps, %
Sherna 52.80 10.10 32.60 0.40 0.00
Peksha 49.00 17.40 28.30 0.70 0.70
Koloksha 22.50 21.60 53.50 0.40 0.00
Nerl 50.50 5.52 32.48 0.70 0.80
Uvod 57.10 4.60 26.30 0.80 1.10
Luh 31.60 39.40 20.10 0.60 8.30
Suvorosh 39.80 18.00 35.30 0.30 1.30
Tara 79.91 3.20 13.88 0.08 0.00
Nerekhta 65.90 12.50 13.30 0.40 0.00
Kirzhach 47.20 12.70 33.70 1.10 0.00
Sudogda 47.20 14.60 32.80 5.40 0.00
Teza 58.10 4.30 25.70 0.70 0.90
Vorya 43.10 7.80 34.20 0.30 0.60
Polya 53.40 6.00 21.00 2.20 9.40
phytomass are concentrated in the basins of the Neva and the Oka rivers, to the South, the biomass reserves start to decrease, which is the consequence of reduction of the forest area. The most productive are the basins of the Don, the Ural, and the Kuban rivers, the products of the ecosystems in the Volga basin as a whole has an
The obtained values of the soil production potential were compared to the hydrological characteristics of these basins, land use features, and the state of arable lands. It was noted that the high discharge modulus is characteristic of the basins of the northern rivers with small soil production potential (Pechora, Mezen); the river basins with high values of soil production potential are characterized by low or average values of the discharge modulus (Dnepr, Oka, Kuban). The most agriculturally developed is the basin of the Don River; here, the agricultural load has reached high level, over 60 % of the territory has been plowed, although the potential of natural ecosystems and agricultural ecosystems is not the highest, which may pose a threat of disruption in the functioning of this basin. In the basin of the Kuban River, the high soil production potential of the ecosystem corresponds to good state of arable lands, high productivity, and good agricultural development of the territory.
The dynamics of the soil production potential by the NDVI index (by MODIS images) for the key river basins between years 2000 and 2014 is shown in the table (Table 3. The dynamics of NDVI of the key river basins located in the European territory of the Russian Federation).
Assessment of the spatial-temporal variability of soil biological productivity in the basin of the Oka River with the use of NDVI
On the example of the basin of the Oka River, the spatio-temporal variability of the vegetation index was assessed, depending on the soil and the environmental conditions. Only the
status of natural ecosystems was analyzed (without agrocenoses, settlements and other anthropogenic objects).
Images of medium resolution (from the “Meteor” satellite) were used for general assessment of the vegetation in the basin of the Oka River and its dynamics; this medium resolution was used for recognizing objects by using the autonomous classification. The boundaries of the soil-ecological zones were interposed on the images. Visually, the differences in their landscape structure are well seen (Figure 3).
The analysis of the satellite images showed that, in general, the vegetation index of the forests in this territory is almost constant from mid-June to late July, and remains at a rather high level (the value is 0.44). In this period, coniferous and mixed forests are at the peak of vegetation, leaves feature high content of chlorophyll, so the red part of the spectrum absorbs more sunlight, and the near-infrared range shows high reflectivity, which also corresponds to high value of the NDVI index. Grass-shrubby and grassy vegetation shows a decrease in the NDVI values by the end of July, which indicates a decrease in the chlorophyll content, and accordingly, reduction in production, and wilting of plants.
It should be noted that the values of the NDVI vegetation index on soils of the three zone types are different. The diagrams show the NDVI value for the main types of natural vegetation in the three soil-ecological zones during June and July.
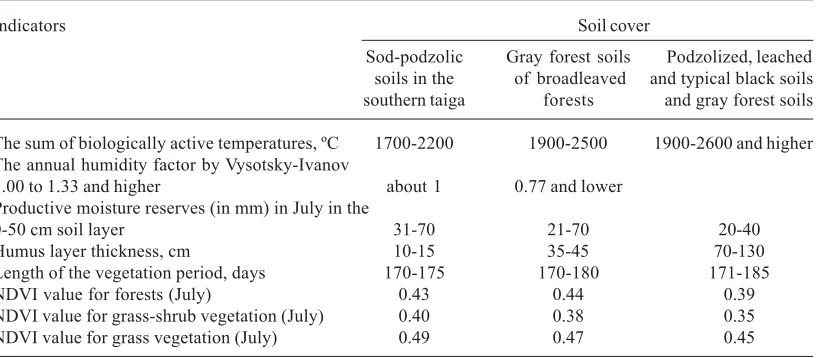
Table 6. Climatic features, indicators of soil fertility, and vegetation indices of the basin of the Oka River
Indicators Soil cover
Sod-podzolic Gray forest soils Podzolized, leached soils in the of broadleaved and typical black soils southern taiga forests and gray forest soils
The sum of biologically active temperatures, ºC 1700-2200 1900-2500 1900-2600 and higher The annual humidity factor by Vysotsky-Ivanov
1.00 to 1.33 and higher about 1 0.77 and lower
Productive moisture reserves (in mm) in July in the
0-50 cm soil layer 31-70 21-70 20-40
Humus layer thickness, cm 10-15 35-45 70-130
Length of the vegetation period, days 170-175 170-180 171-185
NDVI value for forests (July) 0.43 0.44 0.39
NDVI value for grass-shrub vegetation (July) 0.40 0.38 0.35
Fig. 1. The landscapes and catchment basins (black contours) of the European part of Russia
Analysis of the spatial-temporal variability of soil biological productivity potential of the key river basin (the Klyazma River) and small river basins formed by its tributaries
For the purpose of overall assessment of the soil biological productivity of the basin of the Klyazma River and its tributaries (including both natural ecosystems and agrocenoses), we obtained the following indicators: phytomass reserve, phytomass production, the Soil-Ecological Index (SEI), and yield (Tables 4, 5).
High values of the specific phytomass in natural ecosystems are characteristic of basins of the Kirzhach and the Sherna rivers, etc., and the smallest values - in the basins of the Luh and the Koloksha rivers. The specific phytomass in the basin of the Koloksha River is insignificant, since the main part of the acreage is arable land and meadows, which do not accumulate a lot of
phytomass. Low values of specific phytomass reserve in the basin of the Luh River are caused by the depressed state of the forest vegetation in swamped and humid regions.
By the indicator of specific phytomass in terms of the entire area of the river basin, they were divided into five classes:
a) b)
c)
Fig. 2. Satellite images of the basins of the Samara (a), the Mezen (b), and the Voronezh (c) rivers
1. Very low: the basin of the Luh River (69.87 t/ha), the Koloksha River (51.0 t/ha). 2. Low: the Suvorosh River (82.33 t/ha), the
Vorya River (93.68 t/ha).
3. Medium: the basins of the Polya River
(107.71 t/ha), the Sherna River (112.0 t/ha), the Peksha River (106.0 t/ha), the Nerl River (109.6 t/ha), the Sudogda River (120.25 t/ ha).
4. High: the basins of the Uvod River (133.68 t/ha), the Nerekhta River (143.37 t/ha), the Kirzhach River (146 t/ha), the Teza River (135.75 t/ha).
5. Very high: the basin of the Tara River (172.36 t/ha).
6. High specific values of the phytomass
reserves are characteristic of the basins of the rivers where large forest areas are mixed with low shares of the agricultural land in the structure of the land use.
7. The highest value of natural ecosystems’
products is typical for the basin of the Koloksha River (13.33 t/ha per year), and the lowest one - for the basin of the Polya River (7.32 t/ha per year). The former contains a large share of the area covered with highly productive meadow lands (about 20%), while in the latter (the basin of the Polya River), meadow vegetation occupies only 6% of the territory, and about 9% of the territory is occupied by low productive swamp vegetation.
8. For the purpose of comparative evaluation by specific productivity of the basin as a whole, they were divided into five classes: 9. Very low: the basin of the Nerl River (4.87 t/ ha per year), the basin of the Vorya River (45.7 t/ha per year).
10. Low: the basins of the Koloksha River (5.93 t/ha per year), the Kirzhach River (of 5.81 t/ ha per year), the Polya River (5.51 t/ha per year).
Fig. 4. Initial biological productivity of the basin of the Oka River
0 0.1 0.2 0.3 0.4 0.5 0.6
conifer forests mixed forests grass vegetation
the Sherna River basin the Koloksha River basin
11. Medium: the basins of the Uvod River (6.77 t/ha per year), the Suvorosh River (6.44 t/ha per year), the Sudogda River (6.26 t/ha per year), the Teza River (6.7 t/ha per year). 12. High: the basins of the Tara River (7.62 t/ha
per year), the Sherna River (7.4 t/ha per year), the Kirzhach River (11.38 t/ha per year). 13. Very high: the basins of the Peksha River
(8.04 t/ha per year), the Luh River (8.41 t/ha per year), the Nerekhta River (7.93 t/ha per year).
14. The highest rates of phytomass production in the whole river basin are detected in the basins of the Luh and the Peksha rivers; they are characterized by presence of large areas with highly productive meadow vegetation and a small share of agricultural land. This category does not include the basin of the Koloksha River, which, as shown above, features the highest production of natural ecosystems, since in this basin, more than half of the area is occupied by cultivated land, the product of which is not taken into account for defining the overall indicators of the basin, since it has anthropogenic origin and is taken away from the fields in course of harvesting.
For the purpose of comparing the state of arable land located in the basin of the Klyazma River, the Soil Ecological Index and the yield of grain crops were used. According to the average SEI, all basins were divided into 5 classes: 1. Very low: the basin of the Teza River (41),
the Sudogda River (41.6).
2. Low: the basins of the Kirzhach River (50.1), the Tara River (48.7), the Suvorosh River (47.8), the Luh River (49), the Peksha River (46.4), the Sherna River (46.3).
3. Medium: the basins of the Uvod River (53.5), the Nerekhta River (52.3), the Vorya River (52), the Polya River (52).
4. High: this category contains no river basins. 5. Very high: the basins of the Koloksha River
(61.7), the Nerl River (65.5).
The highest rates of SEI are characteristic for the basins located in the territory of the Vladimir high plains, where the basis of the soil cover is gray forest soils (the basins of the Koloksha and the Nerl rivers). Lower values of SEI are observed in the arable lands located on sod-podzolic soils,
and the lowest SEI is observed in the basin of the Teza River.
By the yield of grain crops, the basins were also divided into 5 classes:
1. Very low: the basins of the Sherna River (13.27 hw/ha), the Suvorosh River (13.8 hw/ ha), the Tara River (13.92 hw/ha), the Sudogda River(13.01 hw/ha), the Kirzhach River(14.34 hw/ha).
2. Low: the basins of the Peksha River (15.9 hw/ha), the Luh River (16.31 hw/ha). 3. Medium: the basins of the Uvod River (18.8
hw/ha), the Nerekhta River (17.66 hw/ha). 4. High: the basins of the Teza River (21.2 kg/
ha), the Vorya River (21.2 hw/ha), the Polya River (21.2 hw/ha).
5. Very high: the basins of the Koloksha River (23.43 hw/ha), the Nerl River (23.62 hw/ha). The highest yields are typical for the basins of the Koloksha and the Nerl rivers. This fact is caused by the predominance of arable fertile land of gray forest soils in the soil cover. Low yields are characteristic of the basins of the Sudogda River (13.01 hw/ha) and the Sherna River (13.27 hw/ha) with less fertile sod-podzolic soils.
The PEI to yield ratio does not always show correlation of these indicators, since the soil ecological index is a calculated value, it characterizes the potential of the soil, while the yield is the result, the total value, and it is influenced by many factors, including the following: the use of fertilizers and pesticides, quality of the seeds, tillage, timely sowing, etc.
With the use of the above parameters, we calculated the soil production potential in the basin of the Klyazma River. Its highest values are
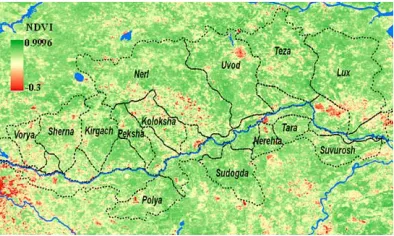
Fig. 6. NDVI distribution in the basins of tributaries of the Klyazma River (MODIS,
observed in the basins of the Nerekhta and the Nerl rivers. The landscape of the basin of the Nerl River is larger and more diverse. Here the agricultural lands are confined mostly to the gray forest soils and feature high SEI and yield, but the productivity of natural ecosystems is not high, which is made up by accumulation of a large phytomass reserve in the forests on sod-podzolic soils. On the contrary, the basin of the Nerekhta River is characterized by the small area and low agricultural load. High values of soil production potential are ensured by high specific indicators that characterize accumulation of phytomass and productivity.
Several basins are characterized by low soil production potential (Luh, Tara, Suvorosh). In such basins, one of the indicators is, as a rule, very low. So, in the basin of the Suvorosh River, the yield of cereals is one of the lowest in the region, although the SEI is medium, therefore, the capacities of the agricultural lands not being used in full.
DISCUSSION
The use of the NDVI vegetation index for assessing the state of the soil and vegetation cover of agricultural landscapes
In using the remote sensing data for analyzing the state of the vegetation, a variety of vegetation indices is often used, which characterizes the spectral reflectance of vegetation objects, which, in turn, depends on several factors (Korolyuk, Shcherbenko (2003); Shahramanyan (2003)). Spectral reflectance is a sensitive indicator for comprehensive assessment of the state of vegetation state and productivity. It is known that the better the condition of vegetation (which is usually manifested by increased chlorophyll content) is and the higher the density of the vegetation cover is, the more it absorbs light in the red region of the spectrum and the better it reflects it in the near infrared region. At the end of the vegetation period, when the leaves turn yellow due to chlorophyll destruction, the share of reflected radiation in the red spectral range increases, and in the infrared region it remains unchanged.
Besides, we believe that this index also characterizes condition of soil. Firstly, it is obvious
that the state of vegetation directly depends on the characteristics of the soil. Therefore, the physico-chemical parameters of the soil indirectly determine the indices of the spectral reflectivity of ecosystems, including NDVI. Secondly, the practice of measuring shows that the indicators of reflectance, beside the species composition of vegetation, its density and condition, depend on the color of the soil under sparse vegetation (Davis et al., (1983)).
The NDVI index is moderately sensitive to changes in the soil background, except for the cases when the vegetation cover density is less than 30%. The analysis of the spectra shows that reflection in the near infrared area and the NDVI naturally responds to the changes in vegetation and soils. It is known that black soils stand out sharply by high values of reflectance in the nearest infrared zone. It has been shown that with a high degree of reliability (accuracy about 80%) black soils may be separated (Konyushkova, Vyshivkin (2009)).
One of the most important characteristics of dry soils reflectance is increased reflectivity with increasing the wavelength, especially in the visible and the near infrared ranges of the spectrum. However, soil is a comprehensive mixture of mineral and organic substances with various physical and chemical properties that may affect its absorption and reflectivity. The content of moisture, the amount of the organic matter, iron oxides, content of clay, sand and dust, characteristics of the surface roughness – all these greatly affect the spectral reflectance of soil (Davis et al., (1983)). This means that soil moisture affects the whole range in the whole, and, therefore, the relation between the spectral channels, for example, red and infrared, does not depend on soil moisture and soil moisture does not significantly affect NDVI.
the near-infrared (0.7 to 1.0 μm) region, there is a sharp differentiation of the spectral reflectance curves (Davis et al (1983)), which, in case of increasing the content of organic matter and iron, will undoubtedly result in higher NDVI values.
Consequently, the NDVI can be used as a generic, on-the-spot and monitoring indicator of the soil production potential defined with the use of remote method.
Monitoring the dynamics of the state of vegetative ground cover of the key areas in the river basins located in the European territory of the Russian Federation
The analysis of the dynamics of soil production capacity by the NDVI indicator (using the MODIS images) for the key river basins over the period between 2000 and 2014 (Table 3) shows that the most dynamically changing river basins were the ones of the Samara, the Voronezh and the Sal rivers, which are dominated by the steppe vegetation, and large areas are occupied by farmlands. In these river basins, the soil production potential (assessed by NDVI) decreased by 2014, as compared to 2000. A relatively stable state is characteristic for the river basins of the Mezen, the Onega and the Oka rivers, the indicator of the NDVI dynamics is not high, fluctuations of the vegetation index were observed during the analyzed period, but no significant changes in the index, and consequently, in the soil production potential were observed.
Assessment of the spatial-temporal variability of soil biological productivity in the basin of the Oka River with the use of NDVI
Assessment of the spatial-temporal variability of soil productive capacity by the NDVI indicator made it possible to determine its characteristics in various soil-ecological zones. The vegetation index of arboreous and grass-shrub vegetation is higher in the area of sod-podzolic soils in the southern taiga, and lower on the gray forest soils and even lower - on black earths.
Differences in the dynamics of this indicator over the summer have been detected. So, the most significant changes were observed in the state of herbaceous vegetation: in the early summer, its vegetation index is the same in all areas, and by the end of July, the productivity decreases, but the most dramatic drop of the vegetation index is characteristic of black earths: it dropped here from
0.55 to 0.46.
Next, we compared the obtained values of NDVI with the climatic data, the indicators of soil fertility and productivity, which had been obtained by the in-situ research methods (Dobrovolsky, Urusevskaya (2004); Kolomyts (2005)) (Table 6. Figure 4). In the South-easterly direction, the amount of biologically active temperatures and the length of the growing season increase, but moisture reduces, which is testified by increasing radiation dryness index of Budyko, the decrease in the Ivanov’s annual hydration rate, and reduction of productive moisture reserves. The primary biological production of the landscapes, despite a considerable increase in the humus content, decreases from 13.0 to 9.5 t/ha per year).
Despite the fact that sod-podzolic soils in the basin of the Oka River feature the lowest fertility, in the fairly humid and warm climate production the potential of vegetation is maximum, as shown by high values of NDVI.
The area of gray forest soils is the area of transition from the humid to the arid climate; plants start experiencing lack of moisture that is necessary for normal functioning, which results in decreasing vegetation index.
The climate zone of black soils is characterized by even a greater increase in biologically active temperatures, reduction of productive moisture reserves. All these factors, despite significant humus content in the soil, reduce the intensity of production processes and the NDVI value here is the smallest among all soil-ecological zones.
In the area of sod-podzolic soils, forest soils that are not typical for it are found. In particular, they form the basis of the soil cover of the Vladimir high plains that occupy the basin of the Koloksha River (a left tributary of the Klyazma River). We have compared the values of the vegetation index in the basin of the Koloksha River to its values in the basin of the Sherna River (also a left tributary of the Klyazma River), which is characterized by the soil cover typical for this zone dominated by sod-podzolic soils. To do so, we used “Landsat” ETM+ high resolution multizonal space images (June 30).
basins of the Koloksha and Sherna rivers). In the basin of the Koloksha River, the state of all vegetation types on gray forest soils by the vegetation index is higher than that on sod-podzolic soils in the basin of the Sherna River. At the same time, as it has been shown, the area of gray forest soils located to the South is characterized by lower values of the vegetation index, as compared to sod-podzolic soils. We explain this by the fact that in the former soil-ecological zone, the moisture conditions are more favorable, therefore the production potential of gray forest soils is higher, while in the latter, lack of moisture is a limiting factor which prevents full realization of soil fertility into plant products.
Thus, within a single soil-ecological zone without significant differences in climatic parameters, the vegetation index and plant productivity depend mainly on the characteristics of the soil cover, whereas in different soil-ecological zones, the production potential becomes decisively influenced by climatic factors and, mainly, moisturization of the area.
Monitoring of the state of soil-vegetation cover of the small basins of the Klyazma River by remote data
Data analysis by the weighted average NDVI (MODIS) (Table 4, Figure 6). NDVI distribution in the basins of tributaries of the Klyazma River (MODIS, 250 m resolution, 12.07.2014) for the entire area of the small basins of the Klyazma River for the period between 2000 and 2014 showed that despite fluctuations in its value, significant changes in the condition of soil and vegetation had occurred within the specified period. In the basin of the Klyazma River, a group of small river basins (basins of the Sudogda, the Kirzhach, the Peksha rivers) may be outlined, which for the period between 2000 and 2014 had the maximum and stable values of the soil-production capacity (by NDVI). Some basins with high soil-productive potential are, by average data, characterized by instability of this indicator over years (the basins of the Tara, the Luh and the Nerekhta rivers).
The basin of the Luh River, one of the most abundant left tributaries of the Klyazma River, was chosen as an example for analyzing spatial variability of soil-productive potential within the boundaries of a small River basin on remote sensing. Two parts of this basin are different in the
peculiarities of the soil cover and vegetation, which is reflected in the NDVI values.
The area of the basin is divided into two parts with soil districts: the Ivanovo (with sod-podzolic sandy and sandy loam soils on the binomial deposits) and the Gorky (with sod-podzolic illuvial-ferrian and sod- and peat and peat-podzolic-gumbo sandy soils on ancient alluvial and fluvioglacial deposits), the boundary of which is clearly seen on satellite images. They show severe waterlogging and over-humidification of the territory of the Gorky district. The soil districts of the basin of the Luh River are significantly different in the land use structure and the nature of anthropogenic load. The majority of farmlands in the basin are in the Ivanovo district, while the Gorky district mostly contains peat deposits and peat mines.
The heterogeneity of natural conditions in the basin of the Luh River results in spatial variability of the NDVI vegetation index that is used to assess the spatial variability of the soil-productive potential. Basing on the obtained data (Landsat ETM+, 4 may 2001), the soil production potential of the Gorky district as a whole is lower (NDVI over 0.18) than the one in the Ivanovo district (NDVI over 0.22). These differences are primarily associated with various states of the forests and grasslands of the two soil regions (the Ivanovo and the Gorky ones).
In the Gorky district, the vegetation index of forest vegetation is very low, pine forests grow here on over-moisturized and swamped areas, they are in depressed state, are characterized by low productivity, and do not accumulate considerable phytomass. On the contrary, for the meadow vegetation there are more favorable conditions than those in the Ivanovo district, and its NDVI is higher. Attention should be paid to the fact that the difference in the production capacity of forests in the two soil districts is more substantial than in the herbaceous vegetation.
the basin is formed by the good state of meadow vegetation, and it is especially true for over-humidified part of the basin confined to the Gorky soil district.
CONCLUSION
For the purpose of monitoring the state of soil and vegetation in river basins, we propose to use soil production potential in combination with the vegetation index (NDVI) defined by the remote sensing data. The soil production potential generalizes many years’ data about the productivity of vegetation, the accumulation of phytomass and the factors that affect the activity of production processes.
We have performed monitoring of the soil and vegetation cover in the river basins of various orders by the in-situ data with the use of the soil production potential and remote data (NDVI).
Evaluation of the soil production potential of 12 major river basins of the 1st order in the European part of Russia revealed that the highest values were characteristic of the ecosystems in the basins of the Dnepr, the Kuban and the Volga rivers, but in the latter case this indicator is significant, mainly due to the basin of the Oka River. The analysis of the individual parameters of the soil production potential showed that the largest reserves of phytomass were concentrated in the basins of the Neva and the Oka rivers.
On the example of the basin of the Oka River, the spatio-temporal variability of the soil production potential was assessed by NDVI, depending on the soil and environmental conditions. It has been shown that within a single soil-ecological zone without significant differences in climatic parameters, the vegetation index and plant productivity depend mainly on the characteristics of the soil cover, whereas in different soil-ecological zones, the production potential becomes decisively influenced by climatic factors and, mainly, moisturization of the area.
Assessment of the soil production potential in the basin of the Klyazma River revealed river basins with high values (those of the Nerekhta and the Nerl rivers) and with low values (those of the Luh, the Tara, and the Suvorosh rivers), and the factors that define this parameter. For example, the basin of the Nerl River is larger and more diverse
in the landscape. Here the agricultural lands are confined mostly to the gray forest soils and feature high SEI and yield, but the productivity of natural ecosystems is not high, which is made up by the accumulation of a large phytomass reserve in the forests on sod-podzolic soils.
Analysis of the NDVI (MODIS) dynamics for the entire area of the small basins of the Klyazma River for the period between 2000 and 2014 showed that despite fluctuations in its value within the specified period, no significant changes had occurred in the condition of soil and vegetation. In the basin of the Klyazma River, a group of river basins, which are characterized by stability of this indicator and its high values, was found.
Further research will be planned in order proceed to unification of calculation of soil production potential of river basins of various orders, and to mathematical modeling and predicting the state of soil and vegetation cover in river basins.
ACKNOWLEDGMENTS
The scientific publication has been prepared within the framework of the state assignment of the Vladimir State University No. 37.2108.2014/K for works in the sphere of scientific activities.
REFERENCES
1. Armand, A.D., Self-organization and self-regulation of geographical systems. Moscow:
Nauka,1988; 260 .
2. Bazilevich, N.I., Biological productivity of ecosystems in Northern Eurasia. Moscow:
Nauka, 1993; 293.
3. Bazilevich, N.I., Grebenshikov, O.S., & Tishkov, A.A., Geographical regularities of ecosystems structure and functioning. Moscow: Nauka, 1986; 298.
4. Bartalev, S.A., & Loupian, E.A., Satellite monitoring of boreal ecosystems. Nature, 2005;
9: 44-53.
5. Davis, S.M. et al., Remote sensing. Quantitative approach. Moscow: Nedra, 1983; 415.
the Central Russian plain. Moscow: Editing
House of the Moscow University, 2005; 293. 8. Dobrovolsky, G.V., & Urusevskaya, I.S., The
map of soil-and-ecological zoning of the East European plain, scale 1:2500000. The Faculty
of Soil Science, the Moscow State University n.a. M. V. Lomonosov, Department of Soil Geography, 1997.
9. Dobrovolsky, G.V., & Urusevskaya, I.S., Soil geography. Moscow: Publishing house of the
Moscow State University, Publishing house “Kolos”, 2004; 460.
10. Isachenko, A.G., Intensity of functioning and geosystems productivity. News of the Russian Academy of Sciences, geographical series, 1990;
5:5-17.
11. Kolomyts, E.G., Boreal ecotone and geographical zonality: Atlas - monograph. Moscow: Nauka, 2005; 390.
12. Konyushkova, M.V., & Vyshivkin, A.A., Relation between Quickbird space images and vegetation, soils and soil salinity (North Caspian Sea region, the region of the Dzhanybek RAS research station). The Volga Journal of Ecology,
2009; 1:35-46.
13. Korolyuk, T.V., & Shcherbenko, E.V., Recognition of soil cover in the forest-steppe landscapes by the materials of multiseasonal multispectral survey. Soil Science, 2003; 3: 275-278.
14. Kumacheva, V.D., & Nazarenko, O.G., Assessing productivity of steppe vegetation in agricultural landscapes with various anthropogenic load.
Ecology and Soil Biology: Proceedings of the International conference, Rostov-On-Don, 21-22 April, 2005: to the 90th anniversary of the Rostov State University. Rostov-On-Don:
Rostizdat, 2005; 251-255.
15. Lyuri, D.I., Long-term dynamics of forest-steppe landscapes productivity: 200 years history and forecast. Environmental and social-economic aspects of Russia’s development in the conditions of global changes in natural environment and climate. Moscow: GEOS, 1997; 43-62.
16. Mishon, V.M., The Voronezh River and its basin: resources and water and environmental issues Voronezh: VSU. 2000; 294.
17. Nikitin, E.D., The role of soils in the life of the nature. Moscow, 1982; 48.
18. Productivity of ecosystems in Northern Eurasia.
Retrieved from http://biodat.ru/db/prod/ index.htm
19. Rachkulik, V.I., & Sitnikova, M.V., Reflective properties and the state of the vegetation cover. Leningrad: Gidrometeoizdat, 1981; 287.
20. Mordukhai-Boltovsky, D.D. (Ed.), The USSR surface water resources: Hydrological information., The Don region. Leningrad: Gidrometeoizdat, 1964; 7: 267.
21. Romanovsky, M.G., Mamaev, V.V., & Zhirenko, N.G., Ecosystems power fluctuations. Ecosystems of the Tellerman forest. Moscow: RAS Institute of the Forest Science, 2004; 191-211.
22. Surin, V.G., & Shubina, M.À., Monitoring of the state of natural and technogenic complexes by satellite images. Optichesky Zhournal, 2006; 73(4): 88-92.
23. Shahramanyan, M.A., New information technologies in ensuring national security of Russia. Moscow: The Russian Civil Defense and Emergency Situations Research Institute, 2003; 398.
24. Shishov, L.L., Durmanov, D.N., Karmanov, I.I., & Efremov, V.V., Theoretical foundations and ways of improving soil fertility. Moscow: Agropromizdat, 1991; 304.
25. Besk, P., Goetz Scott Satellite observation of high northern latitude vegetation productivity changes between 1982 and 2008: ecological variability and regional difference.
Environmental Research Letters, 6, doi10.1088/
1748-9326/6/4/045501 (10pp),stacks.iop.org/ ERL/6/045501, 2011.
26. Carlson, T., & Ripley, D., On the relation between NDVI, fractional vegetation cover and leaf area index. Remote Sensing of Environment,
1997; 69:241-252.
27. Ding, Y., Zhao, K., Zheng, X., Jiang, T., Temporal dynamics of spatial heterogeneity over cropland quantifiedby time-series NDVI, near infrared and red reflectance of Landsat 8 OLI imagery.
International Journal of Applied Earth Observation and Geoinformation, 2014; 30:
139-145. http://dx.doi.org/10.1016/j.jag.2014. 01.009
28. Jia, K., Liang, S., Zhangc, L., Wei, X., Yao, Y., & Xie, X., Forest cover classification using Landsat ETM+ data and time seriesMODIS NDVI data.
International Journal of Applied Earth Observation and Geoinformation, 2014; 33: 32– 38 http://dx.doi.org/10.1016/j.jag.2014.04.015. 29. Gamon, J., Huemmrich, F., Stone, R., & Tweedie,
C., Spatial and temporal variation in primary production (NDVI) of coastal Alaskan tundra: decreased vegetation growth following earlier snowmelt. Remote Sensing of Environment, 2013;
129:144-153.
2008: Implications for regional vegetation growth. Remote Sensing of Environment, 2012;
121: 472-487, doi:10.1016/j.rse.2012.02.014
31. Osem, Y., Perevolotsky, A., & Kigel, J., Site productivity and plant size explain the response of annual species to grazing exclusion in a Mediterranean semi-acid rangeland. J. Ecol.,
2004; 92(2):297-309.
32. Rodrigues, A., Marçal André, R.S., & Cunha, M., Identification of potential land cover changes on a continental scale using NDVI time-series from SPOT VEGETATION. International Journal of Remote Sensing, 2013; 34(22): 8028– 8050, http://dx.doi.org/10.1080/01431161. 2013.828184
33. Trifonova, T.A., Shirkin, L.A., & Mishchenko, N.V., Simulation of stationary states of a phitocenosis – soil system based on the example of the Klyaz’ma river basin. Eurasian Soil Science, 2012; 45(8): 793-801.
34. Trifonova, T.A., Mishchenko, N.V., Shirkin, L.A., & Krasnoshchekov, A.N., The land productivity potential of small river basins.
American-Eurasian Journal of Sustainable Agriculture, 2014; 8(6): 11-16.