VOLUME 14 | ISSUE 2 | 2019 | 315
Regression analysis model applied to age-group
swimmers: 50m race component times analysis
ESTHER MORALES ORTIZ 1 , RAÚL ARELLANO COLOMINA
Faculty of Sport Sciences, University of Granada, Spain
ABSTRACT
This investigation aimed to develop a regression model of the Race Component evolution in a large sample of regional age-group Spanish swimmers in 50 m freestyle. Subjects were 280 regional swimmers selected of different club (with an age range of 9 to 22 year) and the swimmers were divided into a five competitive categories. The time spent starting (ST), the time spent stroking (STT1 - STT2), the time spent turning (TT) and the time spent finishing (FT) were used for analysis. Inverse function approximation of the partials times by aging and was carried out. Furthermore, the analysis regression of partials times and event time for age and genders were calculated respectively. It seems that the times of swimmer studied have a tendency to resemble of internationals swimmer´s times. The estimation formula applied was different time according to gender. The crossing age in the swimming partials times were about 12-14 years old. At this age begin to differentiate the performed and swim times between boys and girls. Keywords: Performance development; Competition analysis; Technique testing; Freestyle.
1Corresponding author. Department of Physical Education and Sport, Faculty of Sport Sciences, University of Granada. Carretera de Alfacar s/n. C.P: 18011, Granada, Spain.
E-mail: [email protected]
Submitted for publication April 2018 Accepted for publication September 2018 PublishedJune 2019 (in press October 2018)
JOURNAL OF HUMAN SPORT & EXERCISE ISSN 1988-5202 © Faculty of Education. University of Alicante
doi:10.14198/jhse.2019.142.05
Cite this article as:
316 | 2019 | ISSUE 2 | VOLUME 14 © 2019 University of Alicante
INTRODUCTION
The swimmer´s time obtained after performing a competitive event can be considered as important information to help the coaching process that follows the competitive performance. The dynamic process of training needs as much information as possible from that performance. This information will help the coach to monitor the training program.
The performance of swimmer in competition was determined by total time from the output signal until the end of race(Absaliamov & Timakovoy 1990, Arellano 1991, Manson 1999). Hay, Guimaraes & Grimston (1983) abandoned this global perspective of swim to conceive them not as a whole, but as the series of several Race Component (RC). RC data must be considered when analysing swimming performances during international swimming competitions (see www.swim.ee). The times spent starting (ST), stroking (STT), turning (TT) and finishing (FT) are the RC (Pai, Hay, Wilson 1984). Over time there has been different ways of doing analysis of competition. Sánchez & Arellano (2001) make review of the parameters of competition analysis, the component phases, the different distances of way as reference and authors who use. This study presents an overview of the parameters used in the analysis of the competitive swimming, including the times for start, swimming and retuns, as well as cycle length and frequencies, all of which can be considered elements which provide the swimmer and coach with useful information at certain points in the training cycle. The methodologies analysed are different both from the point of view the location of the cameras and from that time space references. Many studies have been done using competition analysis and different reference systems. To improve the swimmer testing efficiency, this analysis also has to include the results of swimming tests made during a training season or several training seasons. Swimming training has to be oriented to improve all the RC, but the lack of a specific model makes it difficult to know which were the strongest and weakest race components of any individual. The coach must train the swimmer according to swimming time and age. The 50m freestyle performances should improve with age in each period of growth in parallel with the RC.
Some studies have been published where regression equations were applied in the analysis of RC obtained in different competitions (Absaliamov & Timakovoy 1990, Arellano , Brown et al. 1996, Nomura 2006). Johnson et al. (2009) presented a study with the analyzed of progression of American swimming records from 1962 to 2007 with a special attention to gender differences. The current study analyzed historical performance data in order to contribute to the understanding of the development of elite athletes. Data for elite adult and youth swimmers from 1962 to 2007 were employed to identify changes in American swimming records and in the performances of elite American youth swimmers. Over this period, 11 of the 12 men's and women's American records analyzed are improving at an ever slowing rate (Johnson et al., 2009). This trend parallels the resultant analyses herein from elite youth swimmers, suggesting a possible limit to reaching elite athletic performance. Unique gender differences by event for both elite adult and youth swimmers were also revealed. So, Mezzaroba and Machado (2014) also determine the influence of age, anthropometry, and distance on stroke parameters of 10- to 17-y-old swimmers. Results show how the genotype plays a role in elite athletic performance. The study aim was to develop a regression model of the Race Component evolution in a large sample of regional age-group Spanish swimmers in 50 m freestyle.
METHOD
VOLUME 14 | ISSUE 2 | 2019 | 317
Table 1. Group distribution according to age and gender and anthropometric data
COMPETITIVE CATEGORY N Means (s.d.) Weight (kg) Means (s.d.) Height (cm Arm spam (cm) Means (s.d.)
G1 M = 93 F = 51 32.38 (7.24) 32.96 (6.70) 135.55 (7.52) 135.19 (7.59) 137.60 (8.17) 137.36 (7.97) G2 M = 70 F = 51 41.55 (8.44) 45.43 (8.94) 147.35 (7.70) 153.57 (8.97) 149.47 (8.04) 155.68 (9.47) G3 M = 33 F = 50 49.98 (7.57) 52.89 (7.80) 158.70 (5.67) 160.63 (6.47) 164.42 (6.65) 165.06 (7.45) G4 M = 30 F = 35 63.36 (9.57) 52.01 (8.01) 170.68 (7.55) 162.84 (5.33) 175.53 (9.68) 165.91 (8.65) G5 M = 27 F = 29 66.76 (10.67) 58.01 (9.01) 173.58 (7.10) 166.84 (6.33) 179.44 (10.07) 170.91 (8.65)
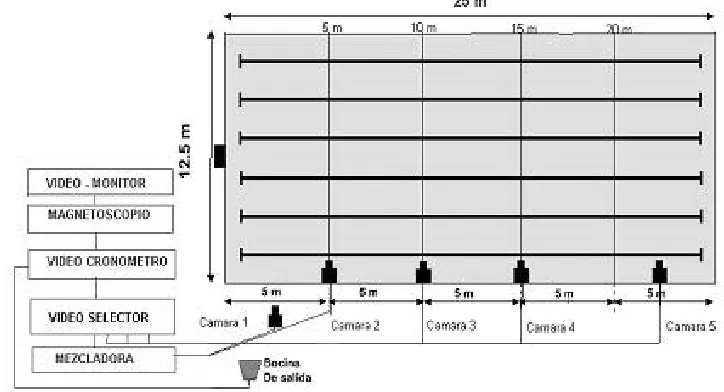
The procedures that have been used to record the times obtained by swimmers during the performance test of 50 m freestyle in 25m swimming pool were: a) references were put on the swimming pool at the distances selected (5, 10, 15 and 20 m) to know when the head crossed this line; b) the 50m trials were recorded by five video cameras connected to a mini DV video recorder through a video-timer and video selector; c) the images from the first two video cameras were mixed to see the over- and under- water phases of the start in the same frame (until 5m); d) third and fourth cameras were used to measure the 10 and 15 m time; the fifth camera was placed at the end of the swimming pool for video recording the turning phase (20 and 25 m) and; e) all the images from the cameras were recorded at a distance of 8 m from the perpendicular plane of the
swimmer’s displacement (see figure 1).
Figure 1. Picture with the references and video cameras set-up on the swimming pool
318 | 2019 | ISSUE 2 | VOLUME 14 © 2019 University of Alicante to record the swimmer´s position in each of the pre-set distance. Each RC time with related to the final time and expressed as a percentage.
The regression analysis was developed using the SPSS 17.0 statistical software. The Kolmogorov-Smirnov test applied showed the normal distribution of the sample. Inverse function approximation of the RC times (ST, STT, TT, FT) by age (AGE) and gender (GEN) was carried out. The type of generic equation obtained was:
(1 )
b
y a a GEN b GEN
AGE
= + + − (Eq. 1)
The estimation formula of time from age and gender was as follows:
1 Men 1
2 Woman 2
b
y a
AGE b
y a
AGE
= +
= +
(Eq. 2)
Furthermore, the regression analysis and inverse function for every partial time was calculated respectively. All swimmers completed, prior to participation in the study, informed consent form. This statement described the purpose, procedures, benefits, risks, discomforts, and precautions of the program. Also are described the alternative procedures available to you, as well as your right to withdraw from the study at any time. The subjects were informing of the test, filled out theirs personal data sheet and signed it. Anonymity was ensured and confidentiality of study participants. The ethics committee of the University of Granada gave its favourable report to the investigation, was collected with the number 635.
RESULTS
The regression analysis was used to discover the trend and model of evolution of partial times according to age and gender. The T-test for independent samples explains the difference between genders for each partial time (Table 2).
Table 2. T-test for independent samples according to gender in each percentage of partial times
Var. Means Difference E.T T (gl) P
% ST Male.
Female. 26.280 26.832 -0.55 0.08 -6.44 (767)
● 0.001***
% STT1 Male.
Female. 10.291 10.346 -0.05 0.05 -1.01 (725)
● 0.313
% TT Male.
Female. 30.575 30.339 0.23 0.11 2.12 (788) 0.034** % STT2 Male.
Female. 22.340 22.153 0.18 0.10 1.76 (760)
● 0.079
% FT Male.
VOLUME 14 | ISSUE 2 | 2019 | 319
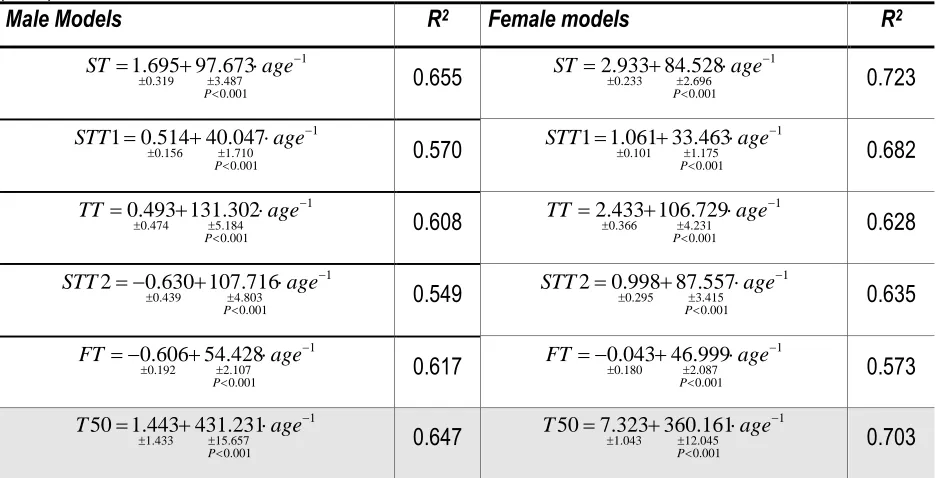
The type of equations obtained for gender in each partial time and event time can be observed in Table 3. Table 3. Model of regression analysis of the partial time (ST. STT1. TT. STT2 FT) by age (AGE) and gender (GEN)
Male Models R2 Female models R2
1
0.319 3.487 0.001
1.695 97.673
P
ST age−
= + 0.655 1
0.233 2.696 0.001
2.933 84.528
P
ST age−
= + 0.723
1
0.156 1.710 0.001
1 0.514 40.047
P
STT age−
= + 0.570 1
0.101 1.175 0.001
1 1.061 33.463
P
STT age−
= + 0.682
1
0.474 5.184 0.001
0.493 131.302
P
TT age−
= + 0.608 1
0.366 4.231 0.001
2.433 106.729
P
TT age−
= + 0.628
1
0.439 4.803 0.001
2 0.630 107.716
P
STT age−
= − + 0.549 1
0.295 3.415 0.001
2 0.998 87.557
P
STT age−
= + 0.635
1
0.192 2.107 0.001
0.606 54.428
P
FT age−
= − + 0.617 1
0.180 2.087 0.001
0.043 46.999
P
FT age−
= − + 0.573
1
1.433 15.657 0.001
50 1.443 431.231
P
T age−
= + 0.647 1
1.043 12.045 0.001
50 7.323 360.161
P
T age−
= + 0.703
The graphs of male and female models were put on top of each other. The crossing age point for each partial time was calculated. The equation obtained was:
1 Male 1 1 2 1 2 2 Female 2 b y a
age b b
a a
b age age
y a age = + + = + = + (Eq. 3) 2 1 of cut 1 2 b b age a a − = −
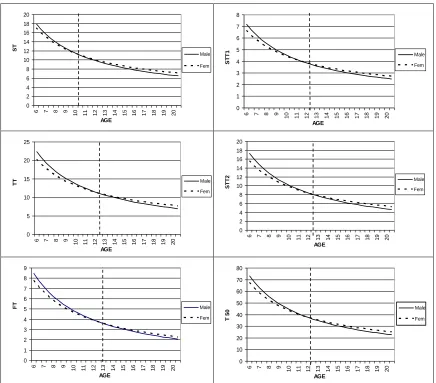
320 | 2019 | ISSUE 2 | VOLUME 14 © 2019 University of Alicante Figure 2. Crossing age point for each partial time.
This shows differences in the development. Also, is a referent point that gives information about when the boys begin to perform better than girls.
DISCUSSION
Swimming time improves from 5 through 20 years of age in boys and girls. This improvement is different between both genders. As was expected, the temporal analysis in a 50m freestyle test improves with age in the period of growth.
Our data confirm the result found in the literature about motor performent study and the changes in the genders performance (Malina & Bouchard 1991). These authors make a study focused on changes in the quantitative aspects of strength and motor performance – that is, attained levels of performance in a variety of specific task during growth. In all of them (time and running velocity, vertical jump, strength , etc) can be seen a parallel performance improvement until 10-12 years in boys and girls. After this age, male growth spurt occurs later and is of a larger magnitude. Boys have improved faster than girls and have better results as in the studies by Sokolovas et al. (2001). Ours results also reflected this trend, but throughout the process
0 2 4 6 8 10 12 14 16 18 20
6 7 8 9 10 11 12 13 14 15 16 17 18 19 20
AGE ST Male Fem 0 1 2 3 4 5 6 7 8
6 7 8 9
10 11 12 13 14 15 16 17 18 19 20
AGE ST T 1 Male Fem 0 5 10 15 20 25
6 7 8 9
10 11 12 13 14 15 16 17 18 19 20
AGE TT Male Fem 0 2 4 6 8 10 12 14 16 18 20
6 7 8 9
10 11 12 13 14 15 16 17 18 19 20
AGE ST T 2 Male Fem 0 1 2 3 4 5 6 7 8 9
6 7 8 9
10 11 12 13 14 15 16 17 18 19 20
AGE FT Male Fem 0 10 20 30 40 50 60 70 80
6 7 8 9
10 11 12 13 14 15 16 17 18 19 20
AGE
T
5
0 Male
VOLUME 14 | ISSUE 2 | 2019 | 321
until 10 years the girls have lower times. This may be due to the great influence of the anthropometric characteristic as it defends by Sokolovas and Herr (2002) who examine the relationships among workload distribution and swimming time with anthropometric and biological maturation of young swimmers. They conclude adding that the age at peak performance depends on gender, swimming event, and rate of individual maturation. Age at peak performance for women is approximately 2-4 years younger than men. This supports what Thompson and Haljand (1997) reported that non-swimming elements accounted for 31-38% of the overall time difference in finishing time (establish the non-swimming elements are related to performance).
The results obtained in percentages of RC times were different between genders and males had lower results than females. The data obtained in the percentage of TT were about 30%. Thayer and Hay (1984) stated that turns comprised up to 21% (for distances of 100 yards) to 37% (for distances of 50 yards) in elite swimmer. Mason and Cossor (2001) defined 33% of total race time in short course competitions. These different should be to the level of competition and growth, with age tends to resemble the percentages of high-level swimmers. The processes of growth and maturation are associated with considerable changes in body size. The alteration in body size reported 40% increase between the ages of 8 to 18 years (Malina & Bouchard, 1991).
Respect to regression equation for 50 m freestyle event, we found the inverse function by age and gender in contract to others studies which the best fit was a third-order polynomial equation (Johnson et al. 2009). They found as in our equations that after 20 years are improving at an ever slowing rate. The data follow the same trend as those obtained in the study of Costa et al.(2011) by retrospective analyses of performance of elite-standard male swimmers.
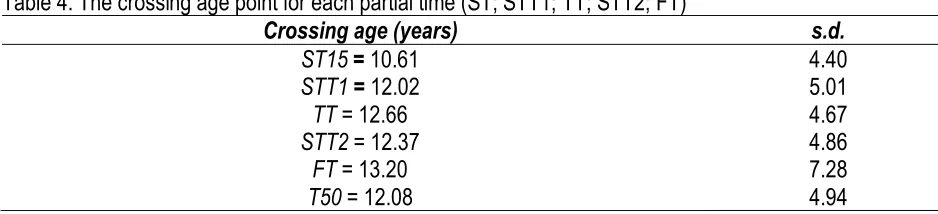
The evolution of RC times follows inverse models in both genders that are parallel but cross over. The times of girls are better than the times of boys until crossing age, which is about 12-14 years old. The standard deviation of each of the variables is estimated by Delta method for variance estimated of function of random variables (see table 4). At this age Taylor et al. (2003) and Hellard et al. (2003) found significant increase in swimming speed at 50m and a significant increase in strength. At the age of 10-14 years old begin to differentiate the performed and swim times between boys and girls, our data are consistent with the development process described by authors such as Malina & Bouchard (1991), Wilke & Madsen (1986), Navarro et al. (2003), Armstrong & Welsman(2005). These results confirm the relationship between growth, anthropometric and strength development and swimming efficiency.
Table 4. The crossing age point for each partial time (ST; STT1; TT; STT2; FT)
Crossing age (years) s.d.
ST15 = 10.61 4.40
STT1 = 12.02 5.01
TT = 12.66 4.67
STT2 = 12.37 4.86
FT = 13.20 7.28
T50 = 12.08 4.94
When observing individuals’ mean career improvement according to the models obtained, the mean
percentage of improvement decreases as those individuals reach adulthood. For each season that passes by, swimmers get closer to their peak personal performance. The best performances are usually achieved
322 | 2019 | ISSUE 2 | VOLUME 14 © 2019 University of Alicante et al. (2010) reported that the age for peak performance was 18.9+1.5 years. Platonov(2005) also reported
male swimmers’ maximal individual performance to be between 18 and 19 years for short distance specialists
(50 m, 100 m, and 200 m) and between 17 and 18 years for long-distance specialists (400 m and 1500 m). For world-class swimmers, it has been reported that age 15–16 the age to achieve the best individual performance in longdistance events (Malina & Bouchard 1991, Sokolovas 1998).
A practical implication for practitioners (e.g. swimming coaches) is that early success should be avoided. Coaches must focus on educating swimmers based on growth and maturation cycles. For that purpose, they should help early maturing individuals keep their success in perspective and ensure later maturing individuals are involved until the age of 16 years. Beginning at age 16, swimmers are close to their best personal performance and the prediction of adult competitive ability increases strongly. Through established models coach can make the progression of the swimmer, having as a reference the times of the models obtained. This will provide appropriate progression. These data may be complementary in future research with other evolutionary factors such as strength, flexibility, etc or reaction time, start speed and factors that affect swimming performance.
CONCLUSIONS
Race components change with the development of many physical fitness factors. With growth, the times of the swimmers studied have a tendency to come closer to the times of international swimmers. The regression models show us the evolution of the Race Component in regional age-group Spanish swimmers in 50 m freestyle. Temporal analysis has the same generic equation for boys and girls but there are two different models according to gender. The inverse function of the partial time by age and gender was the better approximation carried out in this training test of 50m freestyle. Age at peak performance for women is approximately 2-4 years younger than men. The times of girls are better than those of boys until the crossing age of about 12-14 years old. At this age begin to differentiate the swim times between boys and girls. Only the start time showed an earlier differentiation.
DECLARATION OF CONFLICTING INTERESTS
The author(s) declared no potential conflicts of interest with respect to the research, authorship, and/or publication of this article.
FUNDING
This project DEP 2014-59707-P “SWIM: Specific Water Innovative Measurements applied to the
development of International Swimmers in Short Swimming Events (50 and 100M) has been financed by the Spanish Ministry of Economy, Industry and Competitiveness [Spanish Agency of Research] and European Regional Development Fund (ERDF).
ACKNOWLEDGEMENTS
Esther Morales would like to thank the University of Granada for the grant that enabled her to carry out this research. She would also like to thank the Physical Education and Sports Department and the Research
Group “CTS-527: Physical Activity and Sports in Aquatic Environment” of the University of Granada for the
VOLUME 14 | ISSUE 2 | 2019 | 323 REFERENCES
Absaliamov, Timakovoy. (1990). Aseguramiento Científico de la Competición. (A.I. Zvonarev, Trans.).(1 ed.). (Vol.1). Moscow: Vneshtorgizdat.
Arellano R. (1991). Análisis Estadístico Básico de los Resultados Obtenidos en los Campus de Promesas Realizados en Cartagena. Consejo Superior de Deportes - Federación Española de Natación.
Arellano R, Brown P, Cappaert J, Nelson R C. (1996). Application of regression equations in the analysis of 50 and 100 m swimming races of 1992 Olympic Games. Joao Abrantes (Ed.).XIV International Symposium on Biomechanics in Sports. (pp. 274-276). Lisbon, Portugal.
Armstrong N & Welsman J. (2005). "Essay. Physiology of the child athlete." Medicine and Sport 366 (December): S44-S45.
Costa M, Marinho D A, Bragada J A, Silva A J, Barbosa T M. (2011). Stability of elite freestyle performance from childhood to adulthood. J. Sports Sci., August 2011; 29(11): 1183–1189. https://doi.org/10.1080/02640414.2011.587196
Hay J G, Guimaraes A C S, Grimston S K. (1983). A Quantitative Look at Swimming Biomechanics. In J.G. Hay (Ed), Starting, Stroking & Turning (A Compilation of Research on the Biomechanics of swimming, The University of Iowa, 1983-86) (pp.76-82). Iowa: Biomechanics Laboratory, Department of Exercise Science.
Hellard P, Caudal N, et al. (2003). Training, anthropometrics and performance relationships in French male swimmers of three age categories for 200m events. Biomechanics and medicine in swimming IX. J.C. Chatard. Saint-Etienne, Université de Saint-Etienne: 457-562.
Hopkins W G, Pike J C, & Nottle C. (2010). Overall trends and individual trajectories of swimming performance in a decade of New Zealand National Championships. In P. L. Kjendlie, R. K. Stallman, & J. Cabri (Eds.), Proceedings of the XIth International Symposium on Biomechanics and Medicine in Swimming (p. 72). Oslo: Norwegian School of Sport Science.
Johnson M B, Edmonds W A, Jain S and Cavazos J. (2009). Analyses of Elite Swimming Performances and their respective between-gender differences over time. Journal of Quantitative Analysis in Sports, Vol. 5, 4, 1-18. https://doi.org/10.2202/1559-0410.1186
Malina R. M. and Bouchard C. (1991). Growth, maturation and physical activity. Champaign, IL, Human Kinetics Publishers.
Manson B R. (1999). "Biomechanical Race Analysis." ASCA World Clinic: 99-114.
Mason B R and Cossor J M (2001) "Swim turn performances at the Sidney 2000 Olympic Games". Swimming section of the XIX International Symposium on Biomechanics in Sports June 26th, 2001 at the University of San Francisco.
Mezzaroba P V, Machado F A. (2014) Effect of Age, Anthropometry, and Distance in Stroke Parameters of Young Swimmers. Int J Sports Physiol Perform. 2014 Jul;9(4):702-6. https://doi.org/10.1123/ijspp.2013-0278
Navarro F, Oca A & Castañón J. (2003). El entrenamiento del nadador joven. Gymnos. Madrid. Armstrong N & Welsman J. (2005). "Essay. Physiology of the child athlete." Medicine and Sport 366 (December): S44-S45.
Nomura T. (2006). Estimation of the lap-time of 200m freestyle from age and the event time. Revista portuguesa de ciências do desporto. Vol. 6, Supl. 2. (pp. 239-241).
Pai Y-C, Hay J G, Wilson B D. (1984). Stroking Techniques of Elite Swimmers. J. Sports Sci. (2), 225-239. https://doi.org/10.1080/02640418408729719
324 | 2019 | ISSUE 2 | VOLUME 14 © 2019 University of Alicante Sánchez J A, Arellano R. (2001). El análisis de la competición en natación: estudio de la situación actual,
variables y metodología. Análisis biomecánico de la técnica en natación: Programa de control del deportista de alto nivel. R. Arellano and A. Ferro. Madrid, Consejo Superior de Deportes - Ministerio de Educación y Ciencia. 32: 9-50.
Smith D J. (2003). A framework for understanding the training process leading to elite performance. J. Sports Med., 33, 1103–1126. https://doi.org/10.2165/00007256-200333150-00003
Sokolovas G. (1998). Biological maturation of swimmers. In KL Keskinen, PV Komi, AP Hollander (Eds.), Proceedings of the VIIIth International Symposium on Biomechanics and Medicine in Swimming (pp. 315–319). Finland.
Sokolovas G, Riewald S, et al. (2001). "Undestanding physical growth and physiological development of young swimmers and the impact on training and performance." Coaches Quarterly. The Science and Art of Coaching. 7(3): 1-7.
Sokolovas G and Herr L. (2002). "Long-term training in swimming." Coaches Quarterly. The Science and Art of Coaching.USA Swimming 8(nº 2): 15-25.
Taylor S, Maclaren D et al. (2003). The effects of age, maturation and growth on tethered swimming performance. Biomechanics and medicine in swimming IX. J.C. Chatard. Saint-Etienne, Université de Saint-Etienne: 185-190.
Thayer A L and Hay J C. (1984). Motivating Start and Turn Improvement. Swimming Technique, Feb/Apr; 17-20.
Thompsom K G, Haljand R. (1997). "The secrets of competitive breastroke swimming" Swimming Time. Nov.:26-28.
Wilke K & Madsen Ø. (1986). Coaching the young swimmer. London, Pelham Books.