IJSRSET2184117 | Received : 25 Nov 2018 | Accepted : 05 Dec 2018 | November-December-2018 [ 4 (11) : 131-136 ]
Themed Section : Engineering and Technology DOI : https://doi.org/10.32628/IJSRSET2184117
131
The use of Body Surface Index as a Better Clinical Health
indicators Compare to Body Mass Index and Body Surface Area
for Clinical Application
I. Shirazu1, Theophilus. A. Sackey1,2, Elvis K. Tiburu3, Y. B. Mensah4, A. Forson5 1Ghana Atomic Energy Commission, Kwabenya-Accra, Ghana
2 National Centre for Radiotherapy and Nuclear Medicine Department, Accra, Ghana
3Department of Biomedical Engineering, University of Ghana, Legon-Accra, Ghana
4Department of Radiology, K’Bu Teaching Hospital, Ghana
4Department of Radiology, Cocoa Clinic, Ghana
ABSTRACT
The relationship between body height and body weight has been described by using various terms. Notable among them is the body mass index, body surface area, body shape index and body surface index. In clinical setting the first descriptive parameter is the BMI scale, which provides information about whether an individual body weight is proportionate to the body height. Since the development of BMI, two other body parameters have been developed in an attempt to determine the relationship between body height and weight. These are the body surface area (BSA) and body surface index (BSI). Generally, these body parameters are described as clinical health indicators that described how healthy an individual body response to the other internal organs. The aim of the study is to discuss the use of BSI as a better clinical health indicator for preclinical assessment of body-organ/tissue relationship. Hence organ health condition as against other body composition. In addition the study is `also to determine the best body parameter the best predict other parameters for clinical application. The model parameters are presented as; modeled height and weight; modelled BSI and BSA, BSI and BMI and modeled BSA and BMI. The models are presented as clinical application software for comfortable working process and designed as GUI and CAD for use in clinical application.
Keywords : BSA, BSI, BMI, CAD, NPP
I. INTRODUCTION
This study discusses the benefits of using body surface index in relation to other world known body parameters such as height, weight and BMI. Even though the height, weight and BMI has been used over the years as part of preclinical assessment of patients in clinical practice for diagnoses, However, due to more scientific discoveries a lot more is require to adequately
representing the total body composition for clinical applications.
Furthermore, the height and weight are described as the building unit of all these parameters. However, it depends on its mathematical formulation. The BMI is described as the ratio of the weight and the square of the height, described mathematically as;
Furthermore, knowledge of body indices is significant for clinical assessment of organ/tissue composition hence tissue/organ health (Garland, 2014; Glodny, et al., 2009; Emamian, Nielsen, Pedersen & Ytte, 1993; Troell, Berg, Johansson & Wikstad, 1984; Wald, 1937). This is because, organ volume changes throughout human development from fetus through to maturity and to elderly, therefore, the evaluation of the organ development, as compare with human body parameters is crucial. This enables the hypothesis that the function of the various organ meets the metabolic requirements of the whole organism, which are best described by other factors including body parameters (height, weight, BMI, BSA and BSI).
Body Parameters
Since the development of BMI, two other body parameters have been developed in an attempt to determine the relationship between body height and weight. These are the body surface area (BSA) and body surface index (BSI). To evaluate the surface region of a human body in relation to height and weight, the term body surface area was invented. It is specified as an estimated value that shows the relationship between the average body sizes to the height and normally increases with increasing age. The estimated body surface area of a human body is a measured total surface area of human body (Du Bois & Du Bois, 1916). Several scientists and authors have designed formulas to determine the body parameters and the relationship with the organ dimensions, this has contributed significantly to the understanding and solution to human health (Ferreira & Duarte, 2014; Sardinha, Silva, Minderico & Teixeira, 2006; Verbraecken, Van de Heyning, De Backer & Van Gaal, 2006; Shuter, 2000; Current, 1997; Mosteller, 1987; Haycock, Schwartz & Wisotsky, 1978; Gehan & George, 1970; Fujimoto, Watanabe, Sakamoto, Yukawa & Morimoto, 1968; Boyd, 1935).
All of these are broadly stated in the frame:
, (2) where, M is mass (kg), H is height (cm). All parameter values derived from various studies gave reasonably
similar results. The mean body surface area varied based on age and gender. Generally, the average BSA estimated value of an adult male is 1.9 m2, while the
average body surface area for an adult female is approximately 1.6 m2. Furthermore, the average body
surface area for younger children largely varied with age in the range of 1.07 m2 and 1.14 m2 between ages
10 to 16 years (IAEA, 1989).
This study make used of the most widely used BSA calculated formulae is the DuBois formula expressed as:
(3)
Its important to note that with the DuBois formula expressed above the BSA is defined in meters (m), the height (h) in cm and the weight (w) measured in kg. Furthermore, BSA in relation to the body weight describes a new parameter called body surface index (BSI) which is a more precise indicator than both the BMI and the BSA. It is estimated by dividing the body weight by the calculated square root of its BSA, mathematically expressed as:
√ (4)
OBJECTIVE
The aim of the study is to discuss the use of BSI as a better clinical health indicator for preclinical assessment of body-organ/tissue relationship. Hence organ health condition as against other body composition. In addition the study is `also to determine the best body parameter the best predict other parameters for clinical application.
II. MATERIALS AND METHODOLOGY
by the height squared as shown in equation 1. In centers where the BMI machine was not available, an improvised height measuring system and a weighing scale were used. Additionally, both the body surface index and the body surface area were calculated using a designed application software based on equation 3 and 4. Clinical these parameter were measured as pre-imaging tools as part of the clinical assessment of patients before imaging. The pre-imaging data collection process involved the collection of basic patients’ information such as patient ID, gender, age, height, weight, and patients’ comments, BMI, BSI and BSI before imaging in all the hospitals.
The model parameters are presented as body parameters, made up of the relationship BSI and BSA on one hand and BSI and BMI. Additionally, the relationship between BSA and BMI was also determine and a comparison between the summary of the modelled result done. Finally the equation predictors of the various equations were done and results used as a reference determinant.
III. RESULTS
The results of the data were presents based on age and gender variation, as shown in Table 1 below.
Table 1: Measured values of body parameters.
Modelled Body Parameters
The results of the models are presented as clinical application software for comfortable working process and designed as GUI and CAD for use in clinical application shirazu et al [9].
This section present the graphical relationship between BSI and other body parameters. It also shows the model equations for both male and female BSI in relation to BSA and BMI parameters. Below are the modelled regression analysis.
REGRESSION ANALYSIS
Section A: BSI-M Vrs BSA-M Model Summary
SD R-sq R-sq(pred) P-Value 4.06 97.99% 97.95% 0.003
Regression Equation
BSI-M = 20.25 + 9.45 BSA-M (5)
Plots for BSI-M versus BSA-M
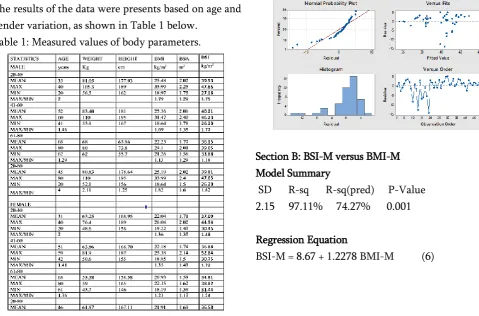
Section B: BSI-M versus BMI-M Model Summary
SD R-sq R-sq(pred) P-Value 2.15 97.11% 74.27% 0.001
Regression Equation
Plots for BSI-M versus BMI-M
Section C: BSI-F versus BSA-F Model Summary
SD R-sq R-sq(pred) P-Value 3.34 99.56% 99.70% 0.000
Regression Equation
BSI-F = 30.45 + 3.87 BSA-F (7)
Plots for BSI-F versus BSA-F
Section D: BSI-F versus BMI-F Model Summary
SD R-sq R-sq(pred) P-Value 3.30 95.91% 96.03% 0.002
Regression Equation
BSI-F = 26.03 + 0.497 BMI-F (8)
Plots for BSI-F versus BMI-F
Section E: BSI-M versus BSI-F
Model Summary
SD R-sq R-sq(pred) P-Value 1.46 98.25% 99.00% 0.000
Regression Equation
BSI-M = 45.13 - 0.149 BSI-F (9)
Plots for BSI-M versus BSI-F
IV. Discussion of Results
Section A discusses the modelled relationship between male BSI against BSA with a P-value of 0.003, Standard deviation of 4.06, R-sq and predictor R-sq value of 98% accuracy. This are summarized under modelled summary with a modelled regression equation (5) and Normal Probability Plot (NPP).
value of 99% accuracy. This are summarized under modelled summary with a modelled regression equation (6) and Normal Probability Plot (NPP).
Section C discusses the modelled relationship between female BSI against BSA with a P-value of 0.000, Standard deviation of 3.34, R-sq and predictor R-sq value of 99% accuracy. This are summarized under modelled summary with a modelled regression equation (7) and Normal Probability Plot (NPP).
Section D discusses the modelled relationship between female BSI against BMI with a P-value of 0.002, Standard deviation of 3.3, R-sq and predictor R-sq value of 96% accuracy. This are summarized under modelled summary with a modelled regression equation (8) and Normal Probability Plot (NPP).
Section E discusses the modelled relationship between male and female BSI with a P-value of 0.000, Standard deviation of 1.46, R-sq and predictor R-sq value of 99% accuracy. This are summarized under modelled summary with a modelled regression equation (9) and Normal Probability Plot (NPP).
Generally, to evaluate the relationship between body fat/muscles weight and body height BMI is used. However, where the clinical question is to be answered in term of the surface region of a human body in relation to height and weight, BSA and BSI are used. In recent times BSA is seen as an improvement of BMI because it account for the total body surface area in relation to the height and weight of the individual. Whilst the BSI is seen as an improvement of the BSA as it account for both body surface area in addition to the height and weight of the individual. In Ghana, BMI is determined to be 25.19 and 21.91, BSA was estimated to be 2.02 and 1.69 while BSI was determine to be 39.81 and 36.58 by Shirazu et al, as BSA for male and female respectively.
Indeed, BSA and BSI, which is significantly used to perform the following clinical services; for instance BSA and BSI is used to estimate the renal clearance (RC), as RC usually divided by either BSA or BSI to gain an appreciation of the true glomerular filtration rate (GFR). In addition the cardiac index is a measure of cardiac output divided by the BSA, giving a better approximation of the effective cardiac output. BSI on the other hand, is used to estimate weight in relation to BSA. The BMI, BSA and BSI define and show the relationship between the average body size to the height and normal increases with increasing age (Ferreira & Duarte, 2014).
It is of interest to note that from this study Body surface index is used to better describe both the BSA and BMI. These conclusions were drawn based on the excellent equation predictors of the modelled equations. That is, the predict relationship based on the linear relationship shows that, BSI can better be used to predict both BMI and BSA.
Furthermore, in literature, the metabolic requirements are correlated with the body parameters (BMI, BSA, BSI), which has a direct relationship between internal organs and other body parts as discussed by Shiraz al et [8].
V. Disclaimer
This is a follow up studies to the work I did in 2016 and published in 2017 as part of determination of standard reference values of body indices in Ghana. The said paper was published as part of my PhD thesis with University of Cape coast.
VI.
REFERENCES
[1]. Mosteller, R. D. (1987). Simplified calculation of body-surface area. N English Journal of Medicine, 317(17), 1098.
independently of body mass Index. PLoS ONE, 7(7). 23.
[3]. International Atomic Energy Agency. (1998). Compilation of anatomical, physiological and metabolic characteristics for a reference Asian man Vol. 1: Data summary and conclusions and vol. 2 country reports, results of a coordinated research programmes 1988-1993. Vienna: IAEA. [4]. Charles, D. (2006). Doctors expose BMI
shortcomings. London: Evening Standard. [5]. Du Bois, D., & Du Bois, E. F. (1916). A formula
to estimate the approximate surface area if height and weight be known. ArchInt Med., 17(6), 863–871.
[6]. International Atomic Energy Agency. (1988). Report of the project formulation meeting: Co-ordinated research project, compilation of anatomical, physiological and metabolic characteristics for a reference Asian Man. Mito. Vienna: IAEA.
[7]. Haycock, G. B., Schwartz, G. J., & Wisotsky, D. H. (1978). Geometric method for measuring body surface area: A height-weight formula validated in infants, children and adults. J Pediatric, 2(93), 62–66
[8]. Frempong, G. A. (2013). Perceived body weight and actual Body Mass Index (BMI) among urban poor communities in Accra, Ghana. Unpublished doctor of philosophy dissertation, University of Ghana, Legon.
[9]. Issahaku Shirazu, Yaw B. Mensah, Cyril Schandorf, S. Y. Mensah. Determination of standard reference body indices for clinical application in Ghana. “International Journal of Scientific & Technology Research (IJSTR)” Print IJSTR Volume 6 - Issue 2, February 2017 Edition - ISSN 2277-8616
[10]. Fujimoto, S., Watanabe, T., Sakamoto, A., Yukawa, K., & Morimoto, K. (1968). Studies on the physical surface area of Japanese. 18. Calculation Formulae in three stages over all ages. Nihon Eiseigaku Zasshi. 5, 443–450.
[11]. Ferreira, F., & Duarte, J. A. (2014). Accuracy of body mass index, waist circumference and body surface index to characterize overweight and obesity in adolescents. Arch exer Health and Dis., 4(3), 299-306.
[12]. Eknoyan, G. (2008). The average man and indices of obesity. Journals of Medicine & Health, Nephrology Dialysis Transplantation, 23(1). 47-51.
[13]. Current, J. D. (1997). A linear equation for estimating the body surface area in infants and children. Int J Anesth., 2(2), 344-356.