www.ijaera.org 2016, IJAERA - All Rights Reserved 470
Investigating the Effect of Welding Parameters
on Weld Bead Geometry in Submerged Arc
Welding by using Response Surface
Methodology
Ajay Saini1, Arashdeep Singh2
1Research Scholar, Department of Mechanical Engineering, Desh Bhagat Engineering College,
Mandi Gobindgarh, India
2Assistant Professor, Department of Mechanical Engineering, DBEC, Desh Bhagat University,
Mandi Gobindgarh, India
Abstract: In the present work an attempt has been made to investigate the effect of welding
parameter on bead geometry in submerged arc welding by using response surface methodology. The quality of weld depends on bead geometry of the weld which in turn depends on the process variables. The welding parameter or process parameter are Current (I), Voltage (V), Arc Travel Speed (S) and Tip distance (N), used for investigate the effect on Bead width (W), Penetration (P), Reinforcement (H), Weld penetration shape factor (WPSF), Weld reinforcement form factor (WRFF). Four factor five levels Central composite rotatable design matrix has been used in Response Surface Methodology for achieving and developing the required qualities of weld bead and mathematical models. The models developed have been checked for their adequacy and significance by using analysis of variance technique. Mild Steel used as specimen material for this investigation. It was found that penetration increases with current, decreases with Arc Travel Speed and Tip distance and remains constant with voltage. Reinforcement was found to increase with current and decrease with voltage, Arc Travel Speed and Tip distance. Weld bead width was found to increase with current, voltage, Tip Distance and decrease with Arc Travel Speed. Weld penetration shape factor was found to increase with voltage, Tip distance and decrease with welding current and Arc Travel Speed. Weld reinforcement form factor was found to increase with voltage, Tip distance and decrease with Arc Travel Speed and remains constant with welding current. The Main and Interaction effect of different parameters involved has been presented in graphical form.
Keywords: Submerged Arc Welding; Response Surface Methodology; Process Parameters; Bead Geometry
I. INTRODUCTION
www.ijaera.org 2016, IJAERA - All Rights Reserved 471
the literature it was found that researchers have take many attempts to predict the process parameter of SAW to obtain smooth and better quality of weld bead geometry. The information regarding the welding process parameter which affect or influence the b ead geometry is important because it can be applied in saw process for high productivity and cost effectiveness [1-12]. The control of weld bead was become necessary because mechanical strength of weld is affected by the weld bead geometry. The present trend in manufacturing industries is the use of automated welding processes to obtain high production rates and high precision. Hence study and control of weld bead geometry is very much essential. For this the relationship between the welding parameter and bead geometry parameter is to be established. This can be achieved by developing the mathematical models by RSM. For this a four factors five levels Central composite rotatable design matrix was used to achieve the required information about the direct and interaction effect on the output parameter. The adequacy and significance of the final models have been checked by the ANOVA [13].
II. METHODOLOGY ANDEXPERIMENTATION
Response Surface Methodology with a four factor five levels Central composite rotatable design matrix used to investigate the effects of welding parameters on weld bead geometry in SAW. Response Surface Methodology was developed by Box and Wilson (1951). This is a combination of statistical and mathematical methods that are useful for modeling and analyzing of process or product. Welding current, voltage, Arc Travel Speed, Tip Distance are selected as the process parameters and their working ranges are shown in Table 1.
Table1. Process parameters and their working ranges
Sr. No.
Parameters Levels
(-2)
Levels (-1)
Levels (0)
Levels (+1)
Levels (+2)
1 Welding current, I (Ampere) 330 370 410 450 490 2 Voltage, V (volt) 28 30 32 34 36 3 Arc travel speed, S (m/hr) 22 25 28 31 34 4 Tip Distance, N (mm) 10 12.5 15 17.5 20
Central Composite rotatable design matrix allowed 31 experimental run which comprises a full replication of 24 (=16) factorial design plus seven center points and eight star points. The basic
www.ijaera.org 2016, IJAERA - All Rights Reserved 472
Table 2. Design Matrix with Response Values for Weld Bead Geometry Parameters
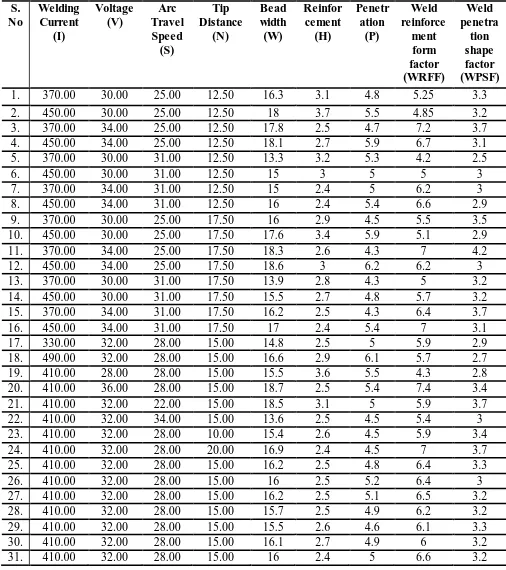
S. No Welding Current (I) Voltage (V) Arc Travel Speed (S) Tip Distance (N) Bead width (W) Reinfor cement (H) Penetr ation (P) Weld reinforce ment form factor (WRFF) Weld penetra tion shape factor (WPSF)
1. 370.00 30.00 25.00 12.50 16.3 3.1 4.8 5.25 3.3 2. 450.00 30.00 25.00 12.50 18 3.7 5.5 4.85 3.2 3. 370.00 34.00 25.00 12.50 17.8 2.5 4.7 7.2 3.7 4. 450.00 34.00 25.00 12.50 18.1 2.7 5.9 6.7 3.1 5. 370.00 30.00 31.00 12.50 13.3 3.2 5.3 4.2 2.5 6. 450.00 30.00 31.00 12.50 15 3 5 5 3 7. 370.00 34.00 31.00 12.50 15 2.4 5 6.2 3 8. 450.00 34.00 31.00 12.50 16 2.4 5.4 6.6 2.9 9. 370.00 30.00 25.00 17.50 16 2.9 4.5 5.5 3.5 10. 450.00 30.00 25.00 17.50 17.6 3.4 5.9 5.1 2.9 11. 370.00 34.00 25.00 17.50 18.3 2.6 4.3 7 4.2 12. 450.00 34.00 25.00 17.50 18.6 3 6.2 6.2 3 13. 370.00 30.00 31.00 17.50 13.9 2.8 4.3 5 3.2 14. 450.00 30.00 31.00 17.50 15.5 2.7 4.8 5.7 3.2 15. 370.00 34.00 31.00 17.50 16.2 2.5 4.3 6.4 3.7 16. 450.00 34.00 31.00 17.50 17 2.4 5.4 7 3.1 17. 330.00 32.00 28.00 15.00 14.8 2.5 5 5.9 2.9 18. 490.00 32.00 28.00 15.00 16.6 2.9 6.1 5.7 2.7 19. 410.00 28.00 28.00 15.00 15.5 3.6 5.5 4.3 2.8 20. 410.00 36.00 28.00 15.00 18.7 2.5 5.4 7.4 3.4 21. 410.00 32.00 22.00 15.00 18.5 3.1 5 5.9 3.7 22. 410.00 32.00 34.00 15.00 13.6 2.5 4.5 5.4 3 23. 410.00 32.00 28.00 10.00 15.4 2.6 4.5 5.9 3.4 24. 410.00 32.00 28.00 20.00 16.9 2.4 4.5 7 3.7 25. 410.00 32.00 28.00 15.00 16.2 2.5 4.8 6.4 3.3 26. 410.00 32.00 28.00 15.00 16 2.5 5.2 6.4 3 27. 410.00 32.00 28.00 15.00 16.2 2.5 5.1 6.5 3.2 28. 410.00 32.00 28.00 15.00 15.7 2.5 4.9 6.2 3.2 29. 410.00 32.00 28.00 15.00 15.5 2.6 4.6 6.1 3.3 30. 410.00 32.00 28.00 15.00 16.1 2.7 4.9 6 3.2 31. 410.00 32.00 28.00 15.00 16 2.4 5 6.6 3.2
III RESULTS ANDDISCUSSION
www.ijaera.org 2016, IJAERA - All Rights Reserved 473
model were obtained for the response characteristics, viz. Bead width (W), Penetration (P), Reinforcement (H), Weld penetration shape factor (WPSF), Weld reinforcement form factor (WRFF). These regression equations were developed using the experimental data (Table 4.2) and were plotted to investigate the effect of process variables on response characteristic. The analysis of variance (ANOVA) was performed to statistically analyze the results. The Final response su rface reduced Quadratic models (using Backward Elimination Regression) is given below
W = +70.59711+0.11812* I-3.68956* V-0.77222* S-1.71000* N+0.076261* V2-0.00328125* I * V+0.035000* V * N+0.025000 * S * N (1) H = +54.04186+0.0052111* I-2.71587* V-0.093613* S-0.69833* N+0.0000336602* I2+0.035339* V2 +0.00876182* S2-0.00109375 * I * S+0.021250* V * N (2)
P = +58.13390-0.10765* I-2.92435* V+0.93906* S+0.14663* N+0.000101812* I2+0.034475* V2-0.015936*N2 +0.00179688* I * V-0.00182292* I * S+0.0018125 * I *
N-0.015833* S * N (3) WRFF = -47.17925+0.00590703* I+2.86622* V-0.18779* S+0.37167* N-0.0000890126* I2-0.032480* V2 -0.019991 * S2+0.00239583* I * S-0.026250* V * N+0.019167 * S * N (4)
WPSF = -12.29150+0.088872 * I+0.80130* V-0.99729 * S-0.21305* N-0.0000590924* I2+0.00477246*S2 +0.014872* N2-0.00179688* I * V+0.00119729* I * S-0.0013125* I * N+0.012500* S * N (5)
A Checking the Significance and Adequacy of the Models
To test the goodness of the fit and validation of the developed models, adequacy was determined by the analysis of variance technique (ANOVA). The analysis of variance test was performed to evaluate the statistical significance of the fitted quadratic models. In addition to this, the goodness of fit of the fitted quadratic model was also evaluated through lack of fit test. The "Prob > F" for all these tests was found in excess of 0.05, meaning that the lack of fit is insignificant. All the fitted models are reduced Quadratic models (using Backward Elimination Regression) for the Bead width (W), Penetration (P), Reinforcement ( H), Weld penetration shape factor (WPSF), Weld reinforcement form factor (WRFF).These Models are significant, since for all the responses, the Prob. > F are observed to be less than 0.0001. In other words, there is only a 0.01% chance that "Model F-Value" larger than those reported in Tables-4.3 could occur due to noise. The values of "Prob > F" less than 0.05 observed for some factors involved in model equations, indicate that the contribution of these terms to the model is significant. O n the other hand, the value of "Prob > F" greater than 0.10 indicates that the impact of model terms are not significant. All the not Significant Models terms are omitted. The response surface models for the Bead width (W), Penetration (P), Reinforcement (h), Weld penetration shape factor (WPSF), Weld reinforcement form factor (WRFF) are show in Table 3.
The coefficients of correlation (R2) for all the models are observed in excess of 0.92 which
inspire confidence in the developed models. The predicted and adjusted R2 values for all the response
www.ijaera.org 2016, IJAERA - All Rights Reserved 474
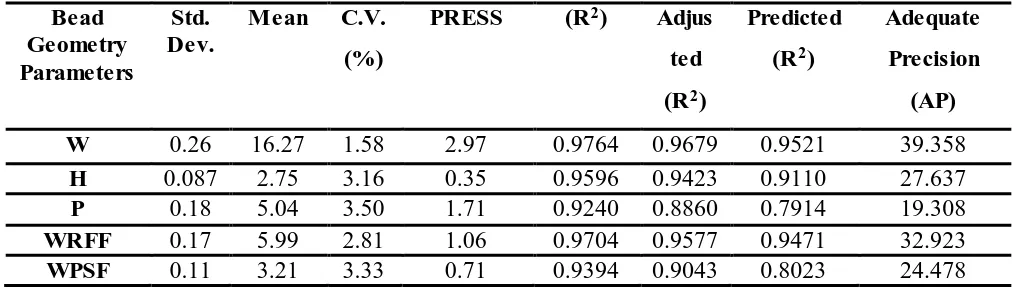
small value of Prediction error sum of square PRESS is adorable because this calculate how well the model predicts the response in new experiment. Model summary statistics for bead geometry Parameters are shown in Table 4.
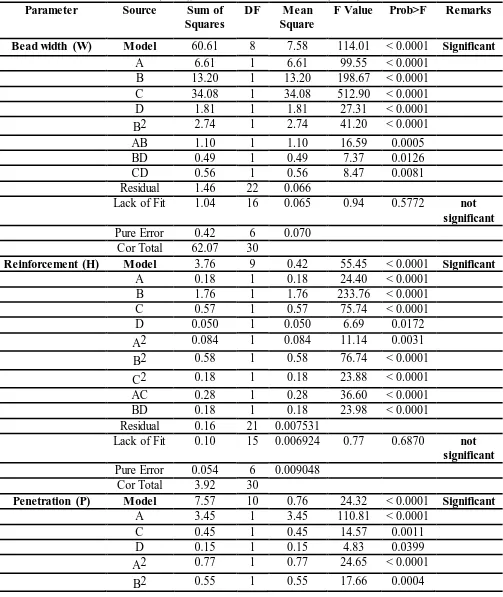
Table 3. Anova for response surface of Bead width (W), Penetration (P), Reinforcement (h), Weld penetration shape factor (WPSF), Weld reinforcement form factor (W RFF)
Parameter Source Sum of
Squares
DF Mean
Square
F Value Prob>F Remarks
Bead width (W) Model 60.61 8 7.58 114.01 < 0.0001 Significant
A 6.61 1 6.61 99.55 < 0.0001 B 13.20 1 13.20 198.67 < 0.0001 C 34.08 1 34.08 512.90 < 0.0001 D 1.81 1 1.81 27.31 < 0.0001 B2 2.74 1 2.74 41.20 < 0.0001 AB 1.10 1 1.10 16.59 0.0005 BD 0.49 1 0.49 7.37 0.0126 CD 0.56 1 0.56 8.47 0.0081 Residual 1.46 22 0.066
Lack of Fit 1.04 16 0.065 0.94 0.5772 not significant
Pure Error 0.42 6 0.070 Cor Total 62.07 30
Reinforcement (H) Model 3.76 9 0.42 55.45 < 0.0001 Significant
A 0.18 1 0.18 24.40 < 0.0001 B 1.76 1 1.76 233.76 < 0.0001 C 0.57 1 0.57 75.74 < 0.0001 D 0.050 1 0.050 6.69 0.0172 A2 0.084 1 0.084 11.14 0.0031 B2 0.58 1 0.58 76.74 < 0.0001 C2 0.18 1 0.18 23.88 < 0.0001 AC 0.28 1 0.28 36.60 < 0.0001 BD 0.18 1 0.18 23.98 < 0.0001 Residual 0.16 21 0.007531
Lack of Fit 0.10 15 0.006924 0.77 0.6870 not significant
Pure Error 0.054 6 0.009048 Cor Total 3.92 30
Penetration (P) Model 7.57 10 0.76 24.32 < 0.0001 Significant
www.ijaera.org 2016, IJAERA - All Rights Reserved 475
D2 0.29 1 0.29 9.21 0.0065 AB 0.33 1 0.33 10.62 0.0039 AC 0.77 1 0.77 24.59 < 0.0001 AD 0.53 1 0.53 16.88 0.0005 CD 0.23 1 0.23 7.25 0.0140 Residual 0.62 20 0.031
Lack of Fit 0.39 14 0.028 0.71 0.7208 not significant
Pure Error 0.23 6 0.039 Cor Total 8.20 30
WRFF Model 19.51 9 2.17 76.41 < 0.0001 Significant
B 14.88 1 14.88 524.49 < 0.0001 C 0.30 1 0.30 10.70 0.0036 D 0.70 1 0.70 24.68 < 0.0001 A2 0.59 1 0.59 20.67 0.0002 B2 0.49 1 0.49 17.20 0.0005 C2 0.94 1 0.94 32.99 < 0.0001 AC 1.32 1 1.32 46.60 < 0.0001 BD 0.28 1 0.28 9.71 0.0052 CD 0.33 1 0.33 11.65 0.0026 Residual 0.60 21 0.028
Lack of Fit 0.31 15 0.020 0.43 0.9156 not significant
Pure Error 0.29 6 0.048 Cor Total 20.11 30
WPSF Model 3.37 11 0.31 26.77 < 0.0001 Significant
A 0.40 1 0.40 34.99 < 0.0001 B 0.40 1 0.40 34.99 < 0.0001 C 0.57 1 0.57 49.84 < 0.0001 D 0.30 1 0.30 26.54 < 0.0001 A2 0.26 1 0.26 22.59 0.0001 C2 0.053 1 0.053 4.66 0.0438 D2 0.25 1 0.25 21.84 0.0002 AB 0.33 1 0.33 28.89 < 0.0001 AC 0.33 1 0.33 28.89 < 0.0001 AD 0.28 1 0.28 24.08 < 0.0001 CD 0.14 1 0.14 12.29 0.0024 Residual 0.22 19 0.011
Lack of Fit 0.16 13 0.012 1.21 0.4299 not significant
www.ijaera.org 2016, IJAERA - All Rights Reserved 476
Table 4. Model summary statistics for bead geometry Parameters
Bead Geometry Parameters
Std. Dev.
Mean C.V.
(%)
PRESS (R2) Adjus
ted
(R2)
Predicted
(R2)
Adequate
Precision
(AP)
W 0.26 16.27 1.58 2.97 0.9764 0.9679 0.9521 39.358
H 0.087 2.75 3.16 0.35 0.9596 0.9423 0.9110 27.637
P 0.18 5.04 3.50 1.71 0.9240 0.8860 0.7914 19.308
WRFF 0.17 5.99 2.81 1.06 0.9704 0.9577 0.9471 32.923
WPSF 0.11 3.21 3.33 0.71 0.9394 0.9043 0.8023 24.478
IV MAIN AND INTERACTION EFFECT OF WELDING PARAMETERS ON WELD BEAD GEOMETRY
A Effect of welding Parameters on Bead Width (W)
Fig.1 shows that the effects of welding Parameters A (Current), B (Voltage), C (Arc Travel Speed), D (Tip Distance) on Bead width. It is observed from the Figure 1 that Bead width, increases with increase of Current, Voltage, Tip Distance but decrease with increase of Arc Travel Speed. The increase in welding current increase the heat input, it results increase in weld bead width. Due to increase in heat input and weight of the weld metal deposited, bead width increase.
Bead width increase due to the increase in arc length with the increase in open circuit voltage, which in turn results in expansion of the arc cone at its base and more melting of work piece.
Weld bead width decreases steadily with the increase in Arc Travel speed. This is due to the fact that when speed increases, the thermal energy passes to the base plate from the arc or line power per unit length of the weld and less filler metal is accumulated per unit length of weld, resulting in thinner and narrower weld bead. Hence, at lower travel speeds, the weld bead is bigger in mass, whereas at higher travel speeds, it is lesser in mass. If speed decreases, the bead becomes broad, flatter and smoother. The combined effect of these factors results in decrease in bead width with the increase in Arc Travel Speed.
As the arc length increase, spreads the arc cone at its base and the metal fusion rate increases slightly at higher value of Tip Distance, so that the value of the Weld bead width increase with the increase of Tip Distance.
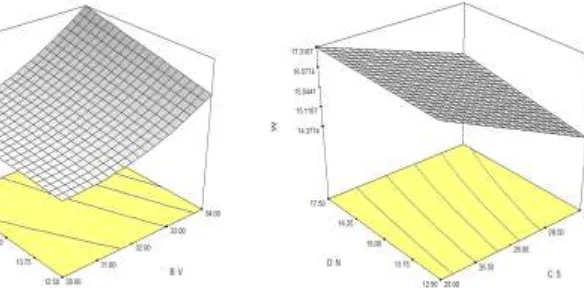
Figure 1(a) shows the interaction effect of welding current and Voltage on bead width. It is clear from Figure that at higher value of voltage (+1 level), when current increases then bead width increases from 16.81 mm to 17.34 mm. Again from figure at lower value of voltage (-1 level), when current increases then bead width increases from 14.80 mm to 16.38 mm.
Figure 1(b) shows the interaction effect of Voltage and Tip distance on bead width. It is clear from Figure at higher value of Tip distance (+1 level), when voltage increases then bead width increases from 15.69 mm to 17.52 mm. Again from figure at lower value of Tip distance (-1 level), when voltage increases then bead width increases from 15.49 mm to 16.62 mm.
www.ijaera.org 2016, IJAERA - All Rights Reserved 477
Figure 1: Effect of Welding Parameters on Bead Width (W) Figure 1(a): Response Surface due to Interactive effect of welding current and Voltage on bead width
Figure 1(b): Response Surface due to Interactive effect Figure 1(c): Response Surface due to Interactive effect of Voltage and Tip Distance on bead width of Arc Travel speed and Tip Distance on bead width
B Effect of welding Parameters on Reinforcement (H)
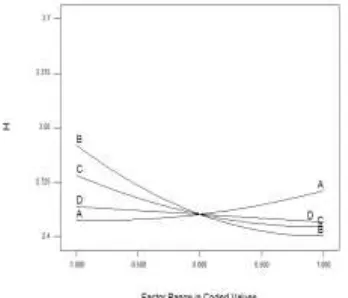
Fig. 2 shows that the effects of welding Parameters A (Current), B (Voltage), C (Arc Travel Speed), D (Tip Distance) on Reinforcement. It is observed from the Figure 2 that Reinforcement increases with increase of Current and decrease with increase in Vo ltage, Tip Distance and Arc Travel Speed.
The increase in reinforcement with increase in welding current is because of the higher melting rate. As higher melting rate cause some part of the filler wire to get deposited on to the weld in the form of reinforcement.
As the increase in voltage the bead width increase causes corresponding reduction in reinforcement.
The decrease in heat input, metal deposition rate and digging power of the arc with the increase in Arc Travel Speed resulting in decrease in weld metal reinforcement.
Due to the reduced heat input, reinforcement decrease as Tip Distance increases.
www.ijaera.org 2016, IJAERA - All Rights Reserved 478
of Arc Travel Speed (+1 level), when current increases then reinforcement slightly decreases from 2.55 mm to 2.46 mm.
Figure 2(b) shows the interaction effect of Voltage and Tip Distance on Reinforcement. It is clear from Figure at lower value of Tip Distance (-1 level), when voltage increase then reinforcement decreases from 3.09 mm to 2.34 mm. Again from figure at higher value of Tip Distance (+1 level), when voltage increases then reinforcement decreases from 2.79 mm to 2.46 mm.
Figure 2: Effect of Welding Parameters on Figure 2(a): Response Surface due to Interactive effect Reinforcement (H) of Current and Arc Travel Speed on Reinforcement
Figure 2(b): Response Surface due to Interactive effect Figure 3: Effect of Welding Parameters of voltage and Tip distance on Reinforcement on Penetration (P)
C Effect of welding Parameters on Penetration (P)
Fig. 3 shows that the effects of welding Parameters A (Current), B (Voltage), C (Arc Travel Speed), D (Tip Distance) on Penetration. Figure 3 depicts that the Voltage has least impact on penetration. It is observed from the Figure 3 that Penetration increases with increase of Current and decrease with increase in Tip Distance and Arc Travel Speed.
Increase in current gives rise to enhanced line power per unit length of the weld and higher current density, causing maximum volume of the base material to melt and hence increase in penetration.
The decrease in metal deposition rate, heat input and digging power of the arc with the increase in Arc Travel Speed, resulting decrease in weld metal penetration.
www.ijaera.org 2016, IJAERA - All Rights Reserved 479
Figure 3(a) shows the interaction effect of Voltage and Current on Penetration. It is clear from Figure at lower value of voltage (-1 level), when current increase then penetration increases from 4.95 mm to 5.42 mm. Again from figure at higher value of voltage (+1 level), when current increases then penetration increases from 4.66 mm to 5.70 mm.
Figure 3(b) shows the interaction effect of Arc Travel Speed and Current on Penetration. It is clear from Figure at lower value of Arc Travel Speed (-1 level), when current increase then penetration increases from 4.58 mm to 5.78 mm. Again from figure we get at higher value of Arc Travel Speed (+1 level), when current increases then penetration increases from 4.75 mm to 5.07 mm.
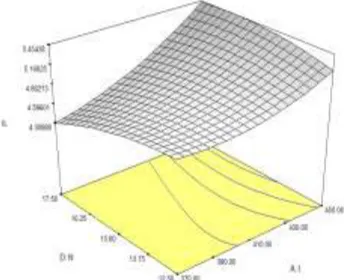
Figure 3(c) shows the interaction effect of Tip Distance and Current on Penetration. It is clear from Figure at lower value of Tip Distance (-1 level), when current increase then penetration increases from 4.83 mm to 5.22 mm. Again from figure at higher value of Tip Distance (+1 level), when current increases then penetration increases from 4.30 mm to 5.43 mm.
Figure 3(d) shows the interaction effect of Arc Travel Speed and Tip Distance on Penetration. It is clear from Figure at lower value of Tip Distance (-1 level), when Arc Travel Speed increase then penetration slightly decreases from 4.88 mm to 4.84 mm. Again from figure at higher value of Tip Distance (+1 level), when Arc Travel Speed increases then penetration decreases from 4.96 mm to 4.45 mm.
Figure 3(a): Response Surface due to Interactive effect Figure 3(b): Response Surface due to Interactive effect of current and voltage on Penetration of current and Arc Travel Speed on Penetration
www.ijaera.org 2016, IJAERA - All Rights Reserved 480
Figure 4 Effect of Welding Parameters Figure 4(a): Response Surface due to Interactive effect on Weld Reinforcement Form Factor (WRFF) of current and Arc Travel Speed on WRFF
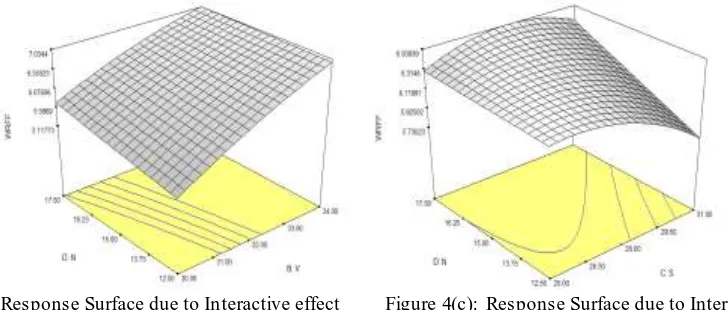
Figure 4(b): Response Surface due to Interactive effect Figure 4(c): Response Surface due to Interactive effect of voltage and Tip Distance on WRFF of Arc Travel Speed and Tip Distance on WRFF D Effect of welding Parameters on Weld Reinforcement Form Factor (WRFF)
Fig. 4 shows that the effects of welding Parameters A (Current), B (Voltage), C (Arc Travel Speed), D (Tip Distance) on WRFF. Figure 4 depicts that the current has least impact on WRFF. It is observed from the Figure 4 that WRFF increases with increase of voltage, Tip Distance a nd decrease with increase in Arc Travel Speed.
WRFF Increase due to bead width increase almost steadily but reinforcement decreases with the increase of voltage so WRFF increase as voltage increase.
Due to the less heat input and minimum metal deposition rate, the size of weld pool decrease and hence WRFF reduce with increase in Arc Travel Speed.
With the increase in Tip Distance, the Bead width and the Reinforcement increase and decrease respectively. So the WRFF increases with the increase in the Tip Distance.
Figure 4(a) shows the interaction effect of Arc Travel Speed and Current on WRFF. It is clear from Figure at lower value of Arc Travel Speed (-1 level), when current increase then WRFF decreases from 6.41 mm to 5.83 mm. Again from figure at higher value of Arc Travel Speed (+1 level), when current increases then WRFF increases from 5.61 mm to 6.18 mm.
www.ijaera.org 2016, IJAERA - All Rights Reserved 481
from 5.72 mm to 7.03 mm. Again from figure at lower value of Tip Distance (-1 level), when Voltage increase then WRFF increases from 5.11 mm to 6.95 mm.
Figure 4(c) shows the interaction effect of Arc Travel Speed and Tip Distance on WRFF. It is clear from Figure at higher value of Tip Distance (+1 level), when Arc Travel Speed increase then WRFF slightly increases from 6.29 mm to 6.35 mm. Again from figure at lower value of Tip Distance (-1 level), when Arc Travel Speed increases then WRFF decreases from 6.24 mm to 5.73 mm.
Figure 5: Effect of Welding Parameters on Figure 5(a): Response Surface due to Interactive effect Weld Penetration Shape Factor (WPSF) of current and voltage on WPSF
Figure 5(b): Response Surface due to Interactive effect Figure 5(c): Response Surface due to Interactive effect of current and Arc Travel Speed on WPSF of current and Tip Distance o n WPSF
www.ijaera.org 2016, IJAERA - All Rights Reserved 482
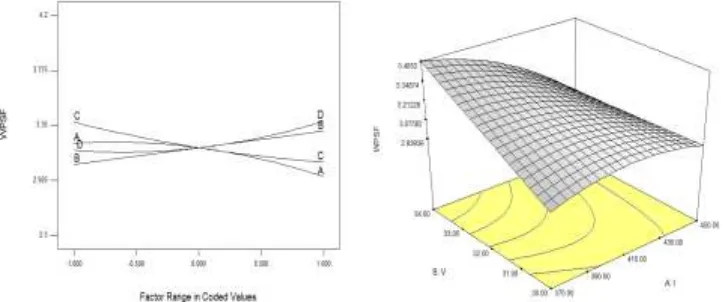
E Effect of welding Parameters on Weld Penetration Shape Factor (WPSF)
Fig. 5 shows that the effects of welding Parameters A (Current), B (Voltage), C (Arc Travel Speed), D (Tip Distance) on WPSF. It is observed from the Figure 5 that WPSF increases with increase of voltage, Tip Distance and decrease with increase in Current and Arc Travel Speed. WPSF decrease as the current increase because rate of increase of Penetration is more than that of bead width with increase of current.
WPSF Increase due to bead width increase almost steadily but Penetration depicts very less impact on Voltage so WPSF increase as voltage increase.
Due to less heat input and minimum metal deposition rate, the size of weld pool decrease and hence WPSF reduce with increase in Arc Travel Speed.
With the increase in Tip Distance, the Bead width and the penetration increase and decrease respectively. So the WPSF increases with the increase in the Tip Distance.
Figure 5(a) shows the interaction effect of Welding Current and Voltage on WPSF. It is clear from Figure at higher value of voltage (+1 level), when current increases then WPSF decreases from 3.48 mm to 2.93 mm. Again from figure at lower value of voltage (-1 level), when current increase then WPSF slightly increases from 2.93 mm to 2.96 mm.
Figure 5(b) shows the interaction effect of Welding Current and Arc Travel Speed on WPSF. It is clear from Figure at lower value of Arc Travel Speed (-1 level), when current increase then WPSF decreases from 3.55 mm to 3.00 mm. Again from figure at higher value of Arc Travel Speed (+1 level), when current increases then WPSF slightly increases from 2.95 mm to 2.98 mm.
Figure 5(c) shows the interaction effect of Welding current and Tip Distance on WPSF. It is clear from Figure at higher value of Tip Distance (+1 level), when current increase then WPSF decreases from 3.54 mm to 3.02 mm. Again from figure at Lower value of Tip Distance (-1 level) when current increases then WPSF is constant.
Figure 5(d) shows the interaction effect of Arc Travel Speed and Tip Distance on WPSF. It is clear from Figure at higher value of Tip Distance (+1 level), when Arc Travel Speed increase then WPSF decreases from 3.48 mm to 3.36 mm. Again from figure we at Lower value of Tip Distance (-1 level), when current increases from then WPSF decreases from 3.44 mm to 2.95 mm.
V CONCLUSION
The Following conclusions were arrived at from the above investigation.
The models developed can be employed for obtaining the desired weld bead dimensions.
Response surface methodology can be employed easily for developing mathematical models for expressing important weld bead dimensions and shape relationships within the optimal range of process control variables for SAW.
As the Welding Current (I) increases the Bead width (W) increases from 15.50 mm to 16.55 mm, Penetration (P) increases from 4.66 mm to 5.42 mm, Reinforcement (H) increases from 2.49 mm to 2.67 mm but Weld penetration shape factor (WPSF) decreases from 3.21 mm to 2.95 mm and Weld reinforcement form factor (WRFF) remains constant.
As the Welding Voltage (V) increases the Bead width (W) increases from 15.59 mm to 17.07 mm, Weld penetration shape factor (WPSF) increases from 3.04 mm to 3.30 mm, Weld reinforcement form factor (WRFF) increases from 5.41 mm to 6.99 mm and Reinforcement (H) decreases from 2.94 mm to 2.40 mm but Penetration remains constant.
www.ijaera.org 2016, IJAERA - All Rights Reserved 483
2.76 mm to 2.45 mm, Weld penetration shape factor (WPSF) decreases from 3.37 mm to 3.06 mm, Weld reinforcement form factor (WRFF) decreases from 6.26 mm to 6.04 mm.
As the Tip Distance (N) increases the Bead width (W) increases from 15.75 mm to 16.30 mm, Weld penetration shape factor (WPSF) increases from 3.15 mm to 3.38 mm, Weld reinforcement form factor (WRFF) increases from 6.16 mm to 6.50 mm but Penetration (P) decrease from 4.86 mm to 4.70 mm and Reinforcement (H) decrease from 2.57 mm to 2.48 mm.
Interaction effect of two different parameter on weld bead geometry and response surface due to interactive effect of two different parameter on weld bead geometry is shown by graphs.
VI REFERENCES
[1] N. Murugan, R.S. Parmar, S.K. Sud (1993). Effect of Submerged arc Process variables on dilution and bead geometry in single wire surfacing. Journal of Material Processing Technology, Vol-37, pp. 761 to 781.
[2] N. Murugan, R.S. Parmar, (1997). Effect of Welding conditions on Micro structure and properties of type 3161 stainless steel Submerged Arc Cladding. AWS, Welding Journal, Vol-76, pp. 210s to 219s.
[3] V. Gunraj, N. Murugan (1999). Application of response surface methodology for predicting weld quality in submerged arc welding of pipes. Journal of Material Processing Technology, Vol-88, pp-266 to 275.
[4] V. Gunraj, N. Murugan (2002). Prediction And Optimization of weld bead volume for submerged arc process- part-2. AWS, Welding Journal, Vol-81, pp-331s to 338s.
[5] V. Gunaraj and N. Murugan, (2005). Prediction and control of weld bead geometry and shape relationship in submerged arc welding of pipes. Journal of Materials Processing Technology, vol. 168, pp. 478–487.
[6] N Murugan and V. Gunaraj (2005). Prediction and control of weld bead geometry and shape relationships in submerged arc welding of pipes. J Mater Process Tech; vol.168, pp. 478–487.
[7] P. Kanjilal, T.K. Pal and S.K. Majumdar, (2006). Combined effect of flux and welding parameters on chemical composition and mechanical properties of submerged arc weld metal. Journal of Materials Processing Technology, Vol.171, pp. 223-231.
[8] DC. Montgomery (2008). Design and analysis of experiments. New York: Wiley.
[9] Deepak Kumar Choudhary, Sandeep Jindal, N.P.Mehta (2011). To Study the effect of welding parameters on weld bead geometry in SAW welding process. Elixir Mech. Engg. Vol.40, pp. 5519-5524.
[10] Sandeep Jindal, Chhibber R and Mehta NP (2013). Investigation on flux design for submerged arc welding of high-strength low-alloy steel. Proc IMechE, Part B: J Engineering Manufacture; vol.227, pp. 383–395.
[11] Vijay Kumar Panwar and Deepak Kumar Choudhary (2013) . Application of Two-Level Half Factorial Design Technique for Developing Mathematical Models of Bead Penetration and Bead Reinforcement in SAW Process. IJIRSET, Vol. 2, Issue 6, pp. 33-38.
[12] Mohit Sharma, Deepak Gupta and Karun (2014). Submerged Arc Welding: A Review. IJCET, Vol.4, no.3, pp. 1814-1817.
[13] Pardeep Kumar & S.R.Chauhan (2016). An Investigation on Cutting Forces and Surface Roughness during Hard Turning of AISI H13 Die Tool Steel with CBN Inserts using RSM. “International Journal of Advanced Engineering Research and Applications”, Vol.– 1, Issue – 9, pp. 345-356.