Single cell transcriptome profiling revealed
differences in gene expression during oocyte
maturation in Haimen white goats
X.Y. Yin, G.H. Cheng, H.Y. Guo, Q. Wang, Y.J. Li and H. Zhang
Key Laboratory for Animal Genetics and Molecular Breeding of Jiangsu Province, College of Animal Science and Technology, Yangzhou University, Yangzhou, Jiangsu Province, China
Corresponding author: Y.J. Li E-mail: [email protected]
Genet. Mol. Res. 16 (1): gmr16019564 Received December 6, 2016
Accepted February 10, 2017 Published March 15, 2017
DOI http://dx.doi.org/10.4238/gmr16019564
Copyright © 2017 The Authors. This is an open-access article distributed under the terms of the Creative Commons Attribution ShareAlike (CC BY-SA) 4.0 License.
ABSTRACT. Juvenile in vitro embryo transfer is an important animal reproductive technology that can shorten the generation interval of livestock, explore the reproductive potential of dams with excellent
genetic traits, accelerate genetic progress and production efficiency of
the herd, and provide a wealth of genetic resources for livestock breeding. However, oocytes from kids do not develop as well as those from female goats during in vitro maturation. To identify differences during different stages of oocyte maturation, we used single cell transcriptome sequencing to compare gene expression in mature oocytes from kids
and female goats. We identified 1086 differentially expressed genes
in mature oocytes from kids and female goats. Of these, we observed upregulated expression in 355 genes and downregulated expression in 435 genes. The differentially expressed genes were involved in
a total of 245 different pathways; of which 30 were significant (P ≤
0.05). We used real-time quantitative polymerase chain reaction to
screen and verify the expression of five genes specifically involved in
Further study of these genes will be of great importance for improving the reproductive performance of Haimen white goats.
Key words: Single cell RNA-Seq; Oocyte maturation; Female goats; Kids
INTRODUCTION
Juvenile in vitro embryo transfer (JIVET) was first suggested and investigated by
the South Australian Research and Development Institute (Yin and Wang, 2013). JIVET is based on a biological high tech system that, together with other propagation techniques, combines gimmer superovulation and ova collection, in vitro oocyte maturation, in vitro fertilization, in vitro embryo culture, and embryo transplantation (Yin and Wang, 2013). During the JIVET process, a large number of oocytes harvested from kid ovaries are fertilized in vitro followed by transfer to surrogate female goats (Morton, 2008). The JIVET method is conducive to shortening the generation interval of livestock. Haimen white goats need 10-12 months to develop into adults. This aids exploration of the reproductive potential of kids
with excellent genetic traits, acceleration of the genetic progress and production efficiency
of the herd, and provides a wealth of genetic resources for livestock breeding (Armstrong et al., 1997). Furthermore, JIVET can be a solution to the shortage of embryo sources for large-scale livestock embryo transfers and can reduce the high costs of embryo production in practice. Thus, JIVET promotes embryo production and transplantation for commercial purposes and provides abundant materials and critical research methods for animal cloning, embryonic stem cell research, transgenosis, egg banking, and other embryo biotechnology areas. Offspring have been successfully produced from 4- to 8-week-old kids (O’Brien et al., 1997; Ledda et al., 1999; Ptak et al., 1999; Kochhar et al., 2002; Kelly et al., 2005), calves (Armstrong et al., 1992), and kids (Izquierdo et al., 2002; Koeman et al., 2003) using JIVET (Gou et al., 2009).
Oocytes from kids do not develop as well as those from mature female goats during in vitro maturation (Hanrahan et al., 1977). Although there was no significant difference in
the cleavage rate of embryos up to the 4-cell stage between kids and female goats, the rate
of cleavage at the 8-cell stage was significantly lower in kids than in female goats. Single
cell transcriptome sequencing is an important method that analyses differentially expressed genes in cells and describes differences in cells from the surface into the gene (Tang et al., 2009; Tang et al., 2010). A comprehensive understanding of protein and regulatory networks is strictly dependent on the complete description of cell transcriptome (Gustincich et al., 2006;
Suzuki and Sugano, 2006). Transcriptomics is an important post-genomic era research field
MATERIAL AND METHODS
Animal subjects
All experimental procedures used in this study were approved by the animal welfare committee at the State Key Laboratory for Agro-Biotechnology of China YangZhou University. We used 4-week-old kids (10 kg) and 15-month-old female goats (40 kg) for our study. The animals were provided with grass and drinking water, and had access an animal exercise pen. We selected 4-week-old kids because the number of growing ovarian follicles has been shown
to increase significantly at this time (Kennedy et al., 1974). We chose 15-month-old female
goats because the body is fully matured at this time. All animals were healthy, showed normal appetite, and had smooth wool.
A surgical procedure performed by a veterinarian was used to remove the ovaries from the goats, and do not need super-row before surgery. The ovaries were brought back to the laboratory where the follicle was opened with a scalpel and liquid was collected in Petri dishes. The oocytes were then aspirated with a pipette and transferred to a culture medium. Oocyte maturation was then performed in a 38.5°C, 5% CO2 incubator. Of the in vitro cultured oocytes, four samples were collected from two unrelated female goats and two kids, respectively. After harvesting, they were frozen immediately in liquid nitrogen until use.
RNA extraction, library preparation, and sequencing
Trace RNA was extracted from the cleaved embryos using a Total RNA kit (Qiagen, Hilden, Germany). Degradation and contamination of the RNA samples were assessed by 1% agarose gel electrophoresis. RNA samples were concentrated using the SMARTer Ultra Low RNA Kit (Takara, Shiga, Japan). The purity and integrity of the RNA was assessed using an RNA Nano 6000 Assay Kit and Bioanalyzer 2100 System (Agilent Technologies, Santa Clara, CA, USA).
From the female goats, a total of 0.7135 µg RNA (0.01427 mg/mL) was collected, whereas 0.6770 µg RNA (0.01354 mg/mL) was collected from the kids. These samples were used as input material for the RNA sample preparations. Total RNA was diluted in diethyl pyrocarbonate water and then denatured at 65°C. The mRNA in the samples was captured
using magnetic beads labeled with oligo(dT). After washing, purified mRNA was eluted from
the beads by heating. The mRNA was chemically digested to obtain 155-bp fragments. First strand cDNA was synthesized by reverse transcription using random hexamers. Second strand cDNA synthesis was carried out using a cDNA synthesis kit (Tiangen, Beijing, China). To blunt the 3'-extruding ends of the cDNA, 3' to 5' exonucleases and polymerases were used. A single A base was added to the 3' end of the cDNA using a thermomixer. Because the 3' end of the linker had a single T base, the cDNA fragment could be joined by A-T pairing, which would prevent mismatch of DNA fragments during the addition of the linkers. The cDNA
fragments were incubated with DNA ligase to add a linker labeled with a fluorescent probe.
An AMPureXP kit (Beckman-Coulter, Brea, CA, USA) was used to separate the fragments from unbound linker fragments. The DNA sequences of both ends were selectively enriched
by polymerase chain reaction (PCR) followed by DNA library amplification. PicoGreen and a fluorescence spectrophotometer were used to quantify the DNA library. An Agilent 2100
After quality control, the transcription library was sequenced using a HiSeqTM 2000 (Illumina, San Diego, CA, USA).
Sequence data quality assessment
FastQC (http://www.bioinformatics.babraham.ac.uk/projects/fastqc/) was used for quality assessment of the original sequence data before data analysis. Low mass fragments were removed during data preprocessing using the NGS QC Toolkit v. 2.3.3 (Hansen et al., 2010) (http://59.163.192.90:8080/ngsqctoolkit/).
The sequencing error rate was determined by calculating the Phred quality score (using the NGS QC Toolkit). The sequencing quality value was calculated using the error probability model of the base recognition process. The sequencing error rate is not only connected with base quality, but is also affected by other factors like the sequencing instrument, sequencing reagents, and sample quality. Under normal circumstances, the sequencing error rate of each base position should be below 0.5%. In transcription group sequencing using the Illumina sequencing platform, the 6 bp random primers used in the reverse transcription of cDNA will cause a preference
for certain nucleotides in the first few positions. This preference issue is independent from the
sequenced species and laboratory issues that affect the homogeneity of the transcription group sequences. In addition, if the content of G, C, A, and T bases was equal for each sequence, and the whole sequencing process was stable, the readout should be a horizontal line, in theory. For
RNA-Seq sequencing, because of the random primer amplification bias and other reasons, there is often large fluctuations in the number of bases for each read before sequencing, while the fluctuations are normal during sequencing (Figures S1, S2 and S3).
Quantification and differential gene expression analysis
The expression level of a gene is directly reflected in the abundance of its transcript.
Abundances were reported in expected fragments per kilobase of transcript per million fragments mapped (FPKM) (Trapnell et al., 2010). FPKM was calculated based on the mapped transcript fragments, transcript length, and sequencing depth. Currently, this is the most commonly used method for estimating gene expression. We used reference genes to measure the abundance of each transcript according to sequence similarity alignment. We then used the software packages Bowtie 2 (Langmead and Salzberg, 2012) (http://bowtie-bio. sourceforge.net/bowtie2/manual.shtml), express
(http://www.rna-seqblog.com/express-a-tool-for-quantification-of-rna-seq-data/), and DESeq (Anders et al., 2012) (http://bioconductor.org/
packages/release/bioc/html/DESeq.html) to compute the negative binomial (NB) distribution
to test for differential gene expression. With NB, significant differences in the number of reads
are tested, estimating the amount of gene expression using the base mean of counts to estimate the value of the expression level.
GO and KEGG enrichment analysis of differentially expressed genes
were evaluated using a hypergeometric distribution testing method. This calculation returns a
significant enrichment P-value; P-values closer to zero indicate that the enriched differentially
expressed genes are more likely annotated to the GO term. The P value is calculated by:
∑
− = − − = 1 0 -1 P m i n Nn iM N i M
(Equation 1)
The enrichment score is calculated as follows:
N M n m score
Enrichment = (Equation 2)
FPKM values (Table 1) were calculated by:
Total exon fragments
FPKM
Mapped reads(millions) exon length(kb)
=
×
(Equation 3)where N represents the number of genes with a GO annotation, n is the number of differentially expressed genes with a GO annotation in N, M is the number of all genes annotated to genes of a particular GO term, and m is the number of differentially expressed genes annotated to a
particular GO term. The GO analysis results can be combined with biological significance to
choose GO genes for follow-up studies.
Table 1. FPKM transcript abundance distribution statistics.
Distribution Female goat Kid
1st quartile 1.05E-44 2.36E-33
3rd quartile 4.7202 4.4654
Standard deviation 290.8737 348.4696
The Kyoto encyclopedia of genes and genomes (KEGG) (http://www.genome.jp/kegg/) is a database of biological systems that integrates genomic, chemical, and systemic functional information (Kanehisa et al., 2008). Using the KEGG database, we performed pathway analysis of
the differentially expressed genes. We also calculated the significance of differentially expressed
gene enrichment using a hypergeometric distribution testing method for each pathway entry.
This calculation returns a significant enrichment P-value; a P-value close to zero indicates that an
enriched differentially expressed gene is in the pathway. Pathway analysis provides results from which we can identify a pathway entry for an enriched differentially expressed gene and look for genes associated with expression changes in a cellular pathway.
Validation of differentially expressed genes by quantitative real-time PCR
The differentially expressed genes identified by the above described methods were
PCR was performed using the 26SYBR Green master mix (Tiangen) on a CFX96 Real-time system (BioRad, Hercules, CA, USA). The reaction was performed using the following
conditions: denaturation at 95°C for 15 min, followed by 40 cycles of amplification (95°C for
10 s and 60°C for 60 s). Relative expression was calculated using the delta-delta-Ct method. The primer sequences are listed in Table S1.
RESULTS
Identification of differentially expressed genes in the mature oocyte transcriptome
In this study, 81,534,098 to 127,183,946 raw reads were generated for each sample (Table S2). Of these, 20,020 (67.9%) and 20,285 (68.8%) expressed genes were identified
in mature oocytes from kids and female goats, respectively (Table S3). There were 18,461 commonly expressed genes between the two groups. The clean transcripts were used for further analysis. Approximately 62.59% of the total reads in each sample were mapped to the sheep genome. The detailed read density on each chromosome can be found in Table S2, whereas the chromosomal distribution of the annotated transcripts are shown in Figure S4.
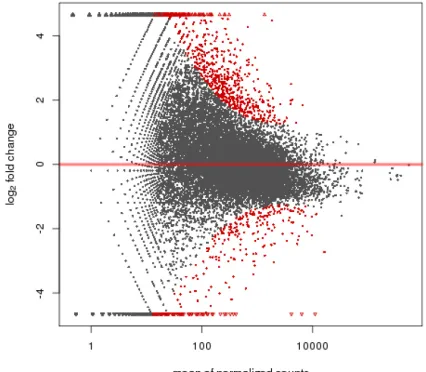
In this study, we analyzed differentially expressed genes, and generated an MA plot to compare expression values (Figure 1). There were 1086 differentially expressed genes,
of which 355 were upregulated (defined as genes that were expressed two times or more in kid oocytes than in female goat oocytes) and 435 were downregulated (defined as genes that
were expressed two times or more in female goat oocytes compared to in kid oocytes). There were 168 differentially expressed genes in the female goat oocyte samples, and 128 in the kid oocyte samples. Of the 1086 differentially expressed genes, 1012 genes were annotated to 3555 GO entries. Of the 3555 entries, 2386 were related to biosynthesis, 473 were related to cellular components, and the remaining 696 were related to molecular functions. The top 20 differentially expressed genes are listed in Figure S5. P values <0.01 indicate highly significant enrichment entries; there were 11 secondary highly significant enrichment entries (Table 2).
MA plot in which the x-axis is the average value of all samples after normalization and the y-axis shows the log2-fold change in expression. Significantly differentially expressed genes (P ≤ 0.05) are indicated in red in Figure 1.
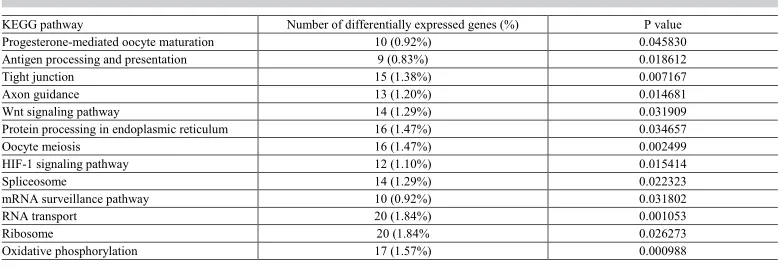
From the enrichment analysis of metabolic pathways, 1086 differentially expressed
genes were found to be involved in 245 cellular pathways; 30 of which were significant at P ≤ 0.05. Excluding some obvious oocyte development-independent pathways, there were 13
pathways remaining (Table 3). The top 20 pathways are shown in Figure S6.
Table 3. Pathway enrichment analysis of differentially expressed genes.
KEGG pathway Number of differentially expressed genes (%) P value
Progesterone-mediated oocyte maturation 10 (0.92%) 0.045830
Antigen processing and presentation 9 (0.83%) 0.018612
Tight junction 15 (1.38%) 0.007167
Axon guidance 13 (1.20%) 0.014681
Wnt signaling pathway 14 (1.29%) 0.031909
Protein processing in endoplasmic reticulum 16 (1.47%) 0.034657
Oocyte meiosis 16 (1.47%) 0.002499
HIF-1 signaling pathway 12 (1.10%) 0.015414
Spliceosome 14 (1.29%) 0.022323
mRNA surveillance pathway 10 (0.92%) 0.031802
RNA transport 20 (1.84%) 0.001053
Ribosome 20 (1.84% 0.026273
Oxidative phosphorylation 17 (1.57%) 0.000988
Table 2. GO enrichment analysis of differentially expressed genes.
Main GO term Second GO term Number of differentially expressed genes (%) P value
Biological process Apoptosis 47 (4.64%) 0.000611
Negative regulation of apoptosis 34 (3.36%) 0.000778
Negative regulation of cell proliferation 24 (2.37%) 0.007007
Cellular component Mitochondrion 86 (8.5%) 0.000011
Nucleoplasm 165 (16.3%) 0.000023
Nucleus 304 (30.04%) 0.00035
Extracellular exosome 147 (14.53%) 0.000892
Lysosomal membrane 23 (2.23%) 0.003302
Molecular function Poly(A) RNA binding 86 (8.5%) 0.000345
RNA binding 43 (4.25%) 0.00056
Nucleotide binding 36 (3.56%) 0.001973
From the enrichment analysis of metabolic pathways with differentially expressed
genes, we identified the oocyte meiotic pathway and the progesterone-mediated oocyte
maturation pathway (Figure S7). Five differentially expressed genes were identified:
MOS, RPS6KA1, CPEB1, ANAPC13, and CDK1. MOS, RPS6KA1, and CPEB1 were downregulated, whereas ANAPC13 and CDK1 were upregulated.
Real-time PCR validation of differential gene expression in mature oocytes from kids
and female goats
female goats. Subsequently, we used MOS expression in mature oocytes from female goats as a standard to compare gene expression between kids and female goats. From this analysis, the relative expression levels of MOS, RPS6KA1, CPEB1, ANAPC13, and CDK1 were estimated
(Table 4). The relative expression levels of MOS and RPS6KA1 were significantly higher in mature oocytes from female goats than those from kids (P ≤ 0.05), the relative expression of CPEB1 was significantly higher in female goats compared to that in kids (P ≤ 0.01), and the relative expression levels of ANAPC13 and CDK1 were significantly lower in mature oocytes from female goats than those from kids (P ≤ 0.05). There was no significant difference in
GAPDH expression in oocytes from female goats and kids.
Table 4. Relative expression comparison between sequencing and fluorescence quantitation (FQ) in mature
oocytes from kids.
The A (female goats) as a standard 1, count the relative gene expression of B (kids).
Gene Accession No. Relative expression by sequencing Relative expression by FQ P value
MOS XM_005689083.1 0.34 0.31 ± 0.18 0.011
RPS6KA1 XM_005676810.1 0.12 0.10 ± 0.04 0.033
CPEB1 XM_005695009.1 0.26 0.27 ± 0.06 0.002
ANAPC13 XM_005675544.1 2.99 3.06 ± 0.15 0.021
CDK1 XM_005699055.1 3.29 3.23 ± 0.27 0.023
GAPDH XM_005680968.1 1.59 1.51 ± 0.25 0.368
DISCUSSION
As the cell cycle progresses, the phenotype of early germ cells undergoes a dynamic change that will deepen into the molecular structure of the cell, such as the transcriptome. Single cell transcriptome sequencing is an important method for investigating the differential gene expression between different oocytes that facilitates the determination of variation between cells (Tang et al., 2009; Tang et al., 2010). In the present study, oocytes from kids and female goats were investigated. We used single cell transcriptome sequencing technology to
analyze genetic differences during oocyte maturation. Of these, 1086 genes were significantly
differentially expressed. These data indicate that the maturation process of oocytes in female goats differs from that in kids, and these differences are likely to lead very useful to current JIVET technology.
Maturation of mammalian oocytes is a complex physiological process involving a large number of regulatory factors, cell structures, and different signaling pathways (Ball et al., 2014; Dang-Nguyen et al., 2014; Prunskaite-Hyyryläinen et al., 2014). For example, the cyclic adenosine monophosphate (cAMP) signaling pathway is necessary for maintaining meiosis, whereas the MAPK signaling pathway plays an important role in meiosis initiation, spindle assembly, and M2 arrest. MAPK activation and deactivation always have the same regular pattern: its activity is always accompanied by chromatin condensation without breakdown of the nuclear membrane, especially between the two meiotic divisions where it prevents agglutination and DNA replication.
Based on our KEGG results, we identified pathways mainly related to RNA transport,
cytoplasm and nucleus in which the number of differentially expressed genes comprised 46.34% of the total (Table 4). It has been reported that the nuclear and cytoplasmic maturation of oocytes is crucial for normal embryonic development after fertilization (Yang et al., 1998). In particular, in nuclear transferred oocytes, cytoplasmic maturation is directly related to the ability of the donor nucleus to completely reprogram and reconstruct the embryo to maintain normal development division (Krisher and Bavister, 1998). Studies have shown that early embryonic development is not controlled by the nucleus, but by the maternal genes in the form of mRNAs and proteins stored in the maternal gene (Evsikov et al., 2006). Maternal genes are transcribed in the process of oocyte development, whereas the transcription of most mRNA begins in the second meiosis of oocytes or after egg fertilization (Crosby et al., 1988). Therefore, the expression of maternal nucleus genes may be critical to goat oocyte maturation.
Among the 1086 differentially expressed genes, we selected five genes (MOS,
RPS6KA1, CPEB1, ANAPC13, and CDK1) closely related to maturity for further investigation. MOS is a key gene involved in meiosis/mitosis conversion, whereas RPS6KA1 promotes mRNA translation (important for cell growth) and protects mitochondrial integrity (important for inhibiting apoptosis). CPEB1 regulates mRNA translation, particularly maternal mRNA translation, and ANAPC13 is involved in cell cycle regulation and the proteolysis pathway.
The stagnation of oocyte meiosis depends on high concentrations of second messenger cAMP (Chen et al., 2012) while the desired cAMP maintaining meiotic stagnant is produced by the oocyte itself (Liu et al., 2013). cAMP dependent protein kinase A inhibits maturation promoting factor (MPF) activity. CDK1 is an important component of the MPF, which plays a crucial role in immature oocyte meiotic resumption (Adhikari et al., 2012). CDK1 controls
the cell cycle and each phase conversion. When these five genes are differentially expressed
simultaneously in goat oocytes, they hinder oocyte maturation, including nuclear maturation and cytoplasmic maturation. Downregulation of MOS inhibits meiosis; downregulation of RPS6KA1 inhibits mRNA translation, which is important to cell growth; downregulation of CPEB1 promotes cell growth and proliferation via regulation of mRNA translation; and ANAPC13 controls cell cycle progression by accelerating proteolysis of cell cycle regulators, slowing the rate of cell growth, which may result in immature cytoplasm.
In summary, our transcriptome analysis of mature oocytes from kids and female
goats using single cell sequencing technology aided identification of five possible key genes
closely related to oocyte maturation: MOS, RPS6KA1, CPEB1, ANAPC13, and CDK1, and
two pathways: oocyte meiosis and progestin-mediated oocyte maturation. We verified our
transcriptome sequencing data with real-time quantitative techniques.
Conflicts of interest
The authors declare no conflict of interest.
ACKNOWLEDGMENTS
The authors would like to acknowledge Xinglog Wang for the guidance and
modifications to the article. Research supported by the Key Natural Science Program of
REFERENCES
Adhikari D, Zheng W, Shen Y, Gorre N, et al. (2012). Cdk1, but not Cdk2, is the sole Cdk that is essential and sufficient to
drive resumption of meiosis in mouse oocytes. Hum. Mol. Genet. 21: 2476-2484. http://dx.doi.org/10.1093/hmg/dds061 Anders S, Reyes A and Huber W (2012). Detecting differential usage of exons from RNA-seq data. Genome Res. 22:
2008-2017. http://dx.doi.org/10.1101/gr.133744.111
Armstrong DT, Holm P, Irvine B, Petersen BA, et al. (1992). Pregnancies and live birth from in vitro fertilization of calf oocytes collected by laparoscopic follicular aspiration. Theriogenology 38: 667-678. http://dx.doi.org/10.1016/0093-691X(92)90029-Q
Armstrong DT, Kotaras PJ and Earl CR (1997). Advances in production of embryos in vitro from juvenile and prepubertal oocytes from the calf and lamb. Reprod. Fertil. Dev. 9: 333-339. http://dx.doi.org/10.1071/R96080
Ball CB, Rodriguez KF, Stumpo DJ, Ribeiro-Neto F, et al. (2014). The RNA-binding protein, ZFP36L2, influences
ovulation and oocyte maturation. PLoS One 9: e97324. http://dx.doi.org/10.1371/journal.pone.0097324
Chen D, Zhang Y, Yi Q, Huang Y, et al. (2012). Regulation of asymmetrical cytokinesis by cAMP during meiosis I in mouse oocytes. PLoS One 7: e29735. http://dx.doi.org/10.1371/journal.pone.0029735
Crosby IM, Gandolfi F and Moor RM (1988). Control of protein synthesis during early cleavage of sheep embryos. J. Reprod. Fertil. 82: 769-775. http://dx.doi.org/10.1530/jrf.0.0820769
Dang-Nguyen TQ, Haraguchi S, Kikuchi K, Somfai T, et al. (2014). Leukemia inhibitory factor promotes porcine oocyte maturation and is accompanied by activation of signal transducer and activator of transcription 3. Mol. Reprod. Dev.
81: 230-239. http://dx.doi.org/10.1002/mrd.22289
Evsikov AV, Graber JH, Brockman JM, Hampl A, et al. (2006). Cracking the egg: molecular dynamics and evolutionary aspects of the transition from the fully grown oocyte to embryo. Genes Dev. 20: 2713-2727. http://dx.doi.org/10.1101/gad.1471006 Gou KM, Guan H, Bai JH, Cui XH, et al. (2009). Field evaluation of juvenile in vitro embryo transfer (JIVET) in sheep.
Anim. Reprod. Sci. 112: 316-324. http://dx.doi.org/10.1016/j.anireprosci.2008.05.008
Gustincich S, Sandelin A, Plessy C, Katayama S, et al. (2006). The complexity of the mammalian transcriptome. J. Physiol. 575: 321-332. http://dx.doi.org/10.1113/jphysiol.2006.115568
Hanrahan JP, Quirke JF and Gosling JP (1977). Genetic and non-genetic effects on plasma LH concentrations in lambs at 4 and 8 weeks of age. J. Reprod. Fertil. 51: 343-349. http://dx.doi.org/10.1530/jrf.0.0510343
Hansen KD, Brenner SE and Dudoit S (2010). Biases in Illumina transcriptome sequencing caused by random hexamer priming. Nucleic Acids Res. 38: e131. http://dx.doi.org/10.1093/nar/gkq224
Izquierdo D, Villamediana P, López-Bejar M and Paramio MT (2002). Effect of in vitro and in vivo culture on embryo development from prepubertal goat IVM-IVF oocytes. Theriogenology 57: 1431-1441. http://dx.doi.org/10.1016/ S0093-691X(02)00647-7
Jääger K, Islam S, Zajac P, Linnarsson S, et al. (2012). RNA-seq analysis reveals different dynamics of differentiation of human dermis- and adipose-derived stromal stem cells. PLoS One 7: e38833. http://dx.doi.org/10.1371/journal. pone.0038833
Kanehisa M, Araki M, Goto S, Hattori M, et al. (2008). KEGG for linking genomes to life and the environment. Nucleic Acids Res. 36: D480-D484. http://dx.doi.org/10.1093/nar/gkm882
Kelly JM, Kleemann DO and Walker SK (2005). Enhanced efficiency in the production of offspring from 4- to 8-week-old
lambs. Theriogenology 63: 1876-1890. http://dx.doi.org/10.1016/j.theriogenology.2004.09.010
Kennedy JP, Worthington CA and Cole ER (1974). The post-natal development of the ovary and uterus of the Merino lamb. J. Reprod. Fertil. 36: 275-282. http://dx.doi.org/10.1530/jrf.0.0360275
Kochhar HP, Wu B, Morris LH, Buckrell BC, et al. (2002). Maturation status, protein synthesis and developmental competence of oocytes derived from lambs and ewes. Reprod. Domest. Anim. 37: 19-25. http://dx.doi.org/10.1046/ j.1439-0531.2002.00326.x
Koeman J, Keefer CL, Baldassarre H and Downey BR (2003). Developmental competence of prepubertal and adult goat
oocytes cultured in semi-defined media following laparoscopic recovery. Theriogenology 60: 879-889. http://dx.doi. org/10.1016/S0093-691X(03)00090-6
Krisher RL and Bavister BD (1998). Responses of oocytes and embryos to the culture environment. Theriogenology 49: 103-114. http://dx.doi.org/10.1016/S0093-691X(97)00405-6
Langmead B and Salzberg SL (2012). Fast gapped-read alignment with Bowtie 2. Nat. Methods 9: 357-359. http://dx.doi. org/10.1038/nmeth.1923
Ledda S, Bogliolo L, Leoni G and Naitana S (1999). Production and lambing rate of blastocysts derived from in vitro
Li S, Wang C, Yu W, Zhao S, et al. (2012). Identification of genes related to white and black plumage formation by
RNA-Seq from white and black feather bulbs in ducks. PLoS One 7: e36592. http://dx.doi.org/10.1371/journal.pone.0036592 Liu L, Kong N, Xia G and Zhang M (2013). Molecular control of oocyte meiotic arrest and resumption. Reprod. Fertil.
Dev. 25: 463-471.
Morton KM (2008). Developmental capabilities of embryos produced in vitro from prepubertal lamb oocytes. Reprod. Domest. Anim. 43 (Suppl 2): 137-143. http://dx.doi.org/10.1111/j.1439-0531.2008.01153.x
O’Brien JK, Catt SL, Ireland KA, Maxwell WM, et al. (1997). In vitro and in vivo developmental capacity of oocytes from prepubertal and adult sheep. Theriogenology 47: 1433-1443. http://dx.doi.org/10.1016/S0093-691X(97)00134-9 Prunskaite-Hyyryläinen R, Shan J, Railo A, Heinonen KM, et al. (2014). Wnt4, a pleiotropic signal for controlling cell
polarity, basement membrane integrity, and antimüllerian hormone expression during oocyte maturation in the female follicle. FASEB J. 28: 1568-1581. http://dx.doi.org/10.1096/fj.13-233247
Ptak G, Loi P, Dattena M, Tischner M, et al. (1999). Offspring from one-month-old lambs: studies on the developmental capability of prepubertal oocytes. Biol. Reprod. 61: 1568-1574. http://dx.doi.org/10.1095/biolreprod61.6.1568 Sangwan RS, Tripathi S, Singh J, Narnoliya LK, et al. (2013). De novo sequencing and assembly of Centella asiatica
leaf transcriptome for mapping of structural, functional and regulatory genes with special reference to secondary metabolism. Gene 525: 58-76. http://dx.doi.org/10.1016/j.gene.2013.04.057
Suzuki Y and Sugano S (2006). Transcriptome analyses of human genes and applications for proteome analyses. Curr. Protein Pept. Sci. 7: 147-163. http://dx.doi.org/10.2174/138920306776359795
Tang F, Barbacioru C, Wang Y, Nordman E, et al. (2009). mRNA-Seq whole-transcriptome analysis of a single cell. Nat. Methods 6: 377-382. http://dx.doi.org/10.1038/nmeth.1315
Tang F, Barbacioru C, Nordman E, Li B, et al. (2010). RNA-Seq analysis to capture the transcriptome landscape of a single cell. Nat. Protoc. 5: 516-535. http://dx.doi.org/10.1038/nprot.2009.236
Tang F, Lao K and Surani MA (2011). Development and applications of single-cell transcriptome analysis. Nat. Methods
8 (Suppl): S6-S11.
Trapnell C, Williams BA, Pertea G, Mortazavi A, et al. (2010). Transcript assembly and quantification by RNA-Seq
reveals unannotated transcripts and isoform switching during cell differentiation. Nat. Biotechnol. 28: 511-515. http://dx.doi.org/10.1038/nbt.1621
Yang X, Kubota C, Suzuki H, Taneja M, et al. (1998). Control of oocyte maturation in cows--biological factors.
Theriogenology 49: 471-482. http://dx.doi.org/10.1016/S0093-691X(97)00419-6
Yin F and Wang LM (2013). Superovulation and in vitro production of embryo technology in lambs. Prog. Vet. Med 12: 190-194.
Young MD, Wakefield MJ, Smyth GK and Oshlack A (2010). Gene ontology analysis for RNA-seq: accounting for
selection bias. Genome Biol. 11: R14. http://dx.doi.org/10.1186/gb-2010-11-2-r14
Supplementary material
Table S1. Primer sequences.
Table S2. Comparison statistics results of reference genes.
Table S3. The comparision statistics results of reference genes.
Figure S1. Quality scores across all bases (Illumina 1.5 encoding). The abscissa represents position in read and the vertical axis is the quality value. The red line is the mass median value, the blue line is the mass average value and the on-off box line represents for the mass extreme value.
Figure S2. Sequence content across all bases. The abscissa represents position in read and the ordinate represents single-base percentage. Different colors represent different bases.
Figure S3. Different colors to match different species, and different size of the area indicates the number of reads comparison to the species.
Figure S5. Take GO (sub-BP, CC, MF) enrichment analysis top20 (in accordance with the difference between the number of each entry sorting genes) drawing entries.
Figure S6. Take KEGG enrichment analysis top20 (in accordance with the difference between the number of each
entry sorting genes) entries for drawing. The figure, the abscissa is the number of genes, the vertical axis represents
the name of passage.