►Additional material is published online only. To view please visit the journal online (http:// dx. doi. org/ 10. 1136/ openhrt- 2018- 000961).
To cite: Boralkar KA, Kobayashi Y, Moneghetti KJ, et al. Improving risk stratification in heart failure with preserved ejection fraction by combining two validated risk scores. Open Heart 2019;6:e000961. doi:10.1136/ openhrt-2018-000961
Received 7 November 2018 Accepted 18 March 2019
For numbered affiliations see end of article.
Correspondence to
Dr Francois Haddad; fhaddad@ stanford. edu
Improving risk stratification in heart
failure with preserved ejection fraction
by combining two validated risk scores
Kalyani Anil Boralkar,1 Yukari Kobayashi,1 Kegan J Moneghetti,1
Vedant S Pargaonkar,1 Mirela Tuzovic,1 Gomathi Krishnan,1 Matthew T Wheeler,2
Dipanjan Banerjee,1 Tatiana Kuznetsova,3 Benjamin D Horne, 4 Kirk U Knowlton,5
Paul A Heidenreich,1 Francois Haddad1
© Author(s) (or their employer(s)) 2019. Re-use permitted under CC BY-NC. No commercial re-use. See rights and permissions. Published by BMJ.
AbstrAct
Introduction The Intermountain Risk Score (IMRS) was developed and validated to predict short-term and long-term mortality in hospitalised patients using demographics and commonly available laboratory data. In this study, we sought to determine whether the IMRS also predicts all-cause mortality in patients hospitalised with heart failure with preserved ejection fraction (HFpEF) and whether it is complementary to the Get with the Guidelines Heart Failure (GWTG-HF) risk score or N-terminal pro-B-type natriuretic peptide (NT-proBNP).
Methods and results We used the Stanford Translational Research Integrated Database Environment to identify 3847 adult patients with a diagnosis of HFpEF between January 1998 and December 2016. Of these, 580 were hospitalised with a primary diagnosis of acute HFpEF. Mean age was 76±16 years, the majority being female (58%), with a high prevalence of diabetes mellitus (36%) and a history of coronary artery disease (60%). Over a median follow-up of 2.0 years, 140 (24%) patients died. On multivariable analysis, the IMRS and GWTG-HF risk score were independently associated with all-cause mortality (standardised HRs IMRS (1.55 (95% CI 1.27 to 1.93)); GWTG-HF (1.60 (95% CI 1.27 to 2.01))). Combining the two scores, improved the net reclassification over GWTG-HF alone by 36.2%. In patients with available NT-proBNP (n=341), NT-proBNP improved the net reclassification of each score by 46.2% (IMRS) and 36.3% (GWTG-HF).
Conclusion IMRS and GWTG-HF risk scores, along with NT-proBNP, play a complementary role in predicting outcome in patients hospitalised with HFpEF.
IntroduCtIon
Heart failure with preserved ejection frac-tion (HFpEF) represents the most common cause of heart failure (HF) hospitalisation in the ageing population.1–4 HFpEF is
associ-ated with multimorbidity including coronary artery disease (CAD), systemic hypertension, diabetes mellitus (DM) and atrial fibrillation (Afib).5–7 The mortality varies between series
with mortality rates reported between 20% and 30% at 5 years.8–10 Identifying predictors
of outcome in hospitalised patients with HF led to the development of several clinical risk scores.11–15 The Intermountain Risk Score
(IMRS) was developed to predict 30-day, 1-year and 5-year mortality using age-ad-justed and sex-adage-ad-justed weights based on commonly available laboratory data such as complete blood count (CBC) including red cell distribution width (RDW) and basic
Key questions
What is already known about this subject?
► Heart failure with preserved ejection fraction (HFpEF) is a major burden on our healthcare system associated with significant morbidity and mortality. Several risk scores using routinely available mark-ers have been developed for risk stratification in HFpEF. The Intermountain Risk Score (IMRS) was de-veloped to predict 30-day, 1-year and 5-year mor-tality using age-adjusted and sex-adjusted weights, based on commonly available laboratory data such as complete blood count including red cell distribu-tion width (RDW) and basic metabolic profile. The Get With The Guidelines-Heart Failure (GWTG-HF) risk score was derived and validated in accordance with the American Heart Association’s GWTG-HF module to predict in-hospital mortality in patients hospitalised with heart failure (HF) with reduced or preserved ejection fraction. N-terminal pro B-type natriuretic peptide (NT-proBNP) is a useful prognos-tic biomarker in patients with HFpEF.
What does this study add?
► This study adds evidence that people with inter-mediate risk by the GWTG-HF risk score can be reclassified to a higher risk level using risk infor-mation from IMRS. Thus, combining two scores can aid better risk stratification of patients with HFpEF. For this to have an impact on clinical management, we have to implement a different strategy. At this time, since there is no specific therapeutics for high-risk patients, the practical implication would be a closer monitoring and management of early stage decompensation.
on September 12, 2020 by guest. Protected by copyright.
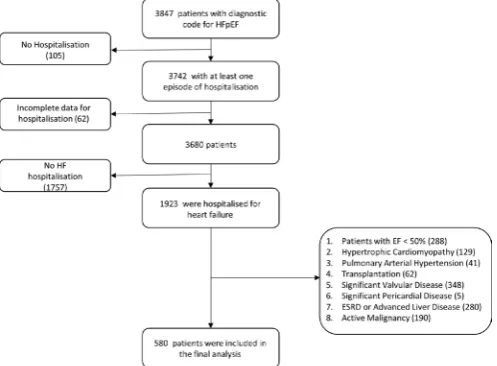
Figure 1 Schematic representation of population with inclusion and exclusion criteria. EF, ejection fraction; ESRD, end-stage renal disease; HF, heart failure; HFpEF, heart failure with preserved ejection fraction.
Key questions
How might this impact on clinical practice?
► Several centres are using clinical risk scores to guide pathways of care following discharge. Established risk scores including the GWTG-HF risk score and the IMRS play a complementary role in predicting outcomes in patients hospitalised with HFpEF. Using these two risk scores can therefore ensure better risk stratifica-tion in patients with HFpEF. This will allow closer monitoring and follow-up of higher risk patients and may therefore be useful in planning post discharge care. In addition, combining two validat-ed risk scores, can prove to be valuable in designing prospective studies. Our study also identifies the direction to develop novel risk scores that incorporate NT-proBNP and other commonly available biomarkers such as RDW that could further improve and simplify pathway of care in heart failure management.
metabolic profile (BMP).16 The IMRS was developed in a hospitalised population with a smaller proportion of patients having a diagnosis of HF.16 It was later validated to predict mortality in the general population,16 cardiac catheterisation patients16 and lower risk individuals free of cardiovascular disease17 and to predict HF incidence in cardiac patients initially free of HF.12 17 The Get With The Guidelines-Heart Failure (GWTG-HF) risk score was derived and validated in accordance with the Amer-ican Heart Association’s GWTG-HF module to predict in-hospital mortality in patients hospitalised with HF with reduced or preserved ejection fraction.11 18–20 Among biomarkers, B-type natriuretic peptide has been shown to be complementary to GWTG-HF score in predicting in-hospital mortality; it has also been shown to predict long-term outcome in patients with HF.21 22
Although both the IMRS and GWTG-HF risk score are built on routinely available clinical and laboratory parameters (online supplemental table 1), several param-eters considered are specific to a particular score. For
example, compared with the GWTG-HF risk score, the IMRS considers comprehensive CBC markers including RDW, haemoglobin concentration and white cell count (WCC). Similarly, GWTG-HF risk score considers more cardiac specific parameters such as heart rate and blood pressure as well as race, which was not considered in the IMRS due to the low prevalence of African-Americans in the derivation cohort. For this study, we hypothesised that the IMRS would predict all-cause mortality specifically in patients hospitalised with HFpEF; in addition, we further hypothesised that it would be complementary to the GWTG-HF risk score or N-terminal pro B-type natriuretic peptide (NT-proBNP). We also sought to better delin-eate the relationship between variables using correlation network analysis.
MetHods study population
Using the Stanford Translational Research Integrated Database Environment,23 we identified 3847 adult
patients with a diagnostic code for acute HFpEF (Interna-tional Classification of Diseases, Ninth Revision (ICD-9) code 428.3) between January 1998 and December 2016. We also queried less specific ICD-9 codes such as 428.0, 428.1 and 428.9 excluding patients with a diagnosis of 428.2 or 428.4 (systolic HF component). Of the identi-fied patients, we only selected patients who underwent an echocardiogram within the year of hospitalisation to verify the accurate evaluation of ejection fraction. Of these patients, 1923 had an admission for acute HF. We excluded patients with left ventricular ejection fraction (LVEF) <50% (n=288), hypertrophic cardiomyopathy (n=129), pulmonary arterial hypertension (n=41), heart transplantation (n=62), severe valvular heart disease (n=348), pericardial heart disease (n=5), end-stage renal disease and advanced liver disease (n=280) or active cancer (n=190). Finally, 580 patients met the inclusion and exclusion criteria and were included in the analysis (figure 1).
Clinical data collection
Clinical data were curated using medical chart review by two physicians (KAB and FH). Data collected included demographics (age, gender and race/ethnicity), vital signs (heart rate, blood pressure, respiratory rate and oxygen saturation), body mass index (BMI), comorbid conditions including DM, systemic hypertension, chronic obstructive pulmonary disease, CAD and Afib. Laboratory values including CBC with differential, BMP, NT-proBNP (Roche diagnostics, Mannheim, Germany) and medica-tion list were recorded. LVEF was collected by reviewing the most recent echocardiography report available from the date of admission. We selected the first admission for HFpEF available in the chart with complete clinical data. Although the data collected ranged over many years, the laboratory methods of estimating the values were consistent.
on September 12, 2020 by guest. Protected by copyright.
http://openheart.bmj.com/
risk score calculation
Calculation of the IMRS (1-year mortality weightings) and the GWTG-HF risk score have been published previously.11 14 17 22 Variables included in the scores are
summarised in online supplementary table 1. In order to assess each of the HF risk scores’ ability to discriminate outcome, we divided risk scores into tertiles.
Primary outcome
The primary outcome was defined as all-cause mortality. The US Social Security Death Index was used to ascertain the mortality status of each patient as of February 2014, and the time of the event was determined from whichever was later. Accuracy of the status was also confirmed using chart review and care everywhere network (Epic Systems Corporation, Verona, Wisconsin, USA). Data were not available on specific cardiovascular mortality rates. We did however carefully screen each chart to exclude active cancer, end-stage renal or liver disease.
statistical analyses
Normality of the data was tested using Kolmogor-ov-Smirnov test and verified using histogram plots. Normally distributed quantitative data were expressed as mean±SD, and non-normally distributed data were expressed as median (IQRs); qualitative variables were presented as numbers and percentages. Variables’ asso-ciation with outcome was assessed using univariable Cox proportional hazard analysis. Variables with p<0.20 on univariable analyses were included in multivariable stepwise Cox proportional hazard analysis to identify independent factors associated with outcome. HRs were adjusted for SD. Model fit was tested using likelihood ratio test and Wald test. Survival curves were plotted using the method of Kaplan and Meier. The incremental value of different scores to predict events was assessed using the integrated as well as discrimination improvement and the net reclassification improvement as described by Pencina et al.24 Receiver-operating characteristics curve
(ROC) analyses were also performed to determine the ability of the risk scores to distinguish outcome and to assess whether adding NT-proBNP to the risk scores improved the ability compared with the model of the risk score alone. To assess the incremental value of indi-vidual scores and NT-proBNP on ROC analyses for 3-year outcome, the scores were Z transformed and the change in area under curve (AUC) was assessed by summation of the individual Z scores. A p value <0.05 was considered statistically significant. We used SPSS V.22 and NCSS V.11 (NCSS, Kaysville, Utah, USA) for statistical analyses.
To analyse the complex relationship between vari-ables, correlation network analysis was used. A scale-free correlation network analysis was used to display the association between variables considered in the HF risk scores. First, a correlation matrix was developed using RStudio Version 1.0.136 2009–2016 RStudio, Inc., then these data were presented visually with a prefuse force directed layout correlation network using Cytoscape
3.4.025 26; nodes representing measured parameters, while
edges representing strength of the pull between a node and its connected neighbours as estimated by statistically significant Pearson’s r values (p<0.001). Analyses were performed using MedCalc version 15.8 (MedCalc Soft-ware, Ostend, Belgium) and RStudio Version 1.0.136— VC 2009–2016 (RStudio, Inc) with corrplot: Visualisation of a Correlation Matrix (v0.77, 2016).27
results
Population characteristics
The mean age of the population was 76±16 years with 334 (58%) female and a significant proportion of patients with DM (36%), a history of systemic hypertension (97%) or a previous history of Afib (58%) (table 1). The median duration of hospitalisation was 4 (IQR 2–9) days. Vital signs and laboratory values are presented in table 1.
IMrs and GWtG-HF risk score
The IMRS and the GWTG-HF risk scores for the popu-lation were normally distributed with a mean value of 40.9±8.1 and 15.4±3.6, respectively (figure 2). There was a moderate association between the IMRS and the GWTG-HF risk score (R2=0.28, p<0.001).
outcome prediction using IMrs and GWtG-HF risk score for all-cause mortality
Over the median follow-up of 1.96 (0.24–4.62) years, 140 patients died (24.1%). On univariable Cox proportional hazard analysis of all-cause mortality, IMRS (HR 1.98; 95% CI 1.65 to 2.36; p<0.001), GWTG-HF (HR 2.01; 95% CI 1.73 to 2.33; p<0.001), age (HR 1.84; 95% CI 1.36 to 2.47; p<0.001), CAD (HR 1.41; 95% CI 0.99 to 2.01; p=0.05), Afib (HR 1.74; 95% CI 1.21 to 2.50; p=0.003), BMI (HR 0.75; 95% CI 0.60 to 0.87; p=0.002), heart rate (HR 1.22; 95% CI 1.01 to 1.49; p=0.001), haematocrit (HR 0.78; 95% CI 0.65 to 0.94; p=0.009), mean corpuscular haemo-globin concentration (MCHC) (HR 0.77; 95% CI 0.66 to 0.89; p=0.001), RDW (HR 1.38; 95% CI 1.22 to 1.52; p<0.001), serum sodium (HR 0.80; 95% CI 0.70 to 0.94; p=0.008), blood urea nitrogen (BUN) (HR 1.42; 95% CI 1.19 to 2.69; p<0.001), serum creatinine (HR 1.16; 95% CI 1.07 to 1.28; p<0.001), serum potassium (HR 1.21; 95% CI 1.06 to 1.39; p=0.005) and log NT-proBNP (HR 1.78; 95% CI 1.45 to 2.19; p<0.001) emerged as signifi-cant correlates (online supplementary table 2). On multi-variable Cox proportional hazards analysis that included the risk scores (table 2A), IMRS and GWTG-HF risk score were independent correlates of all-cause mortality with a log likelihood ratio of −760.90 (figure 2). When the scores were excluded from the multivariable Cox model, age, CAD, heart rate, mean corpuscular volume (MCV), MCHC, RDW, sodium and BUN were independent corre-lates of all-cause mortality with a log likelihood ratio of −742.17 (table 2B). Combining the two scores improved the net reclassification over GWTG-HF alone by 36.2% (table 2C). There was a trend for the AUC for 3-year
on September 12, 2020 by guest. Protected by copyright.
Table 1 Clinical characteristics of patient population
Characteristics n=580
Age, years 76±15.5
Female sex, n (%) 334 (57.6)
Race, n (%)
Caucasian 446 (76.9)
Asian 78 (13.4)
African-American 37 (6.4)
Other 19 (3.3)
Comorbidities
Diabetes mellitus, n (%) 206 (35.5) Prior diagnosis of hypertension, n (%) 561 (96.7)
Hyperlipidaemia, n (%) 369 (63.6)
Coronary artery disease, n (%) 345 (59.5) History of atrial fibrillation, n (%) 336 (57.9) Chronic obstructive pulmonary disease, n (%) 177 (30.5)
History of smoking, n (%) 216 (37.2)
LVEF, % 58.3±5.0
Systolic blood pressure on admission (mm Hg) 135±25 Heart rate on admission, bpm 83±20
Respiratory rate, per min 19±4
BMI, kg/m2 28.5±7
WCC 10.4±5.6
Haemoglobin, g/L 118.5±21
Anaemia, n (%) 335 (57.7)
Haematocrit, % 35.5±6.0
Mean corpuscular haemoglobin concentration, g/dL 33.4±1.1
NT-proBNP, pg/mL (n=341) 2145 (955.5–5133.5) NT-proBNP <300 pg/mL, n (%) 28 (8.2)
NT-proBNP 300–1000 pg/mL, n (%) 58 (17) NT-proBNP >1000 pg/mL, n (%) 255 (74.8) Medications on admission
ACE-I/ARB, n (%) 253 (43.6)
Spironolactone, n (%) 30 (5.2)
Diuretics on admission, n (%) 340 (58.6)
Beta blockers, n (%) 337 (58.1)
Statins, n (%) 310 (53.4)
Anaemia defined as haemoglobin < 135 g/L (male) and haemoglobin < 120 g/L (female).
ACE-I/ARB, ACE inhibitor/ angiotensin II receptor blocker; BMI, body mass index; LVEF, left ventricular ejection fraction; NT-proBNP, N-terminal pro-B-type natriuretic peptide; WCC, white cell count.
Figure 2 Histograms for HF risk scores and Kaplan-Meier survival curves for HF risk scores by tertiles; normally distributed histogram for IMRS and Kaplan-Meier survival curve for IMRS according to tertiles. Normally distributed histogram for GWTG-HF risk score and Kaplan-Meier survival curve for HF risk score according to tertiles. GWTG-HF, Get With The Guidelines-Heart Failure; GWTG-HF, heart failure; IMRS, Intermountain Risk Score.
outcome 0.72 versus 0.69, respectively, for individual scores (p=0.08).
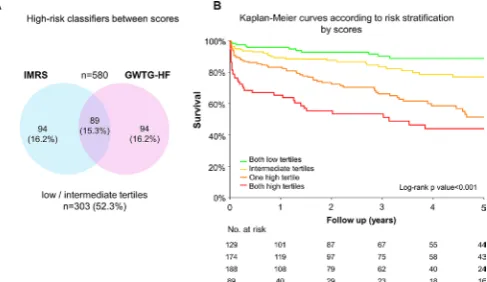
To evaluate the potential contribution of the scores using categorical classification, we decided to assess the complementarity of the scores using tertile of each score which could be easier for clinical implementation. Eighty-nine (15.3%) patients were in the higher tertiles by both the scores, 188 (32.4%), were in the higher tertiles by only one score, while 129 (22.2%) patients were in the
lower tertiles by both the scores (figure 3). Patients in higher tertile strata had adverse outcome compared with those in lower tertile strata (HR 2.06; 95% CI 1.72 to 2.46; p<0.001)(figure 3).
subgroup analysis of patients with nt-proBnP
The NT-proBNP value was available in 341 (58.8%) patients with a median value of 2145 (955.5–5133.5) pg/ mL. Log NT-proBNP was normally distributed with a mean value of 3.3±0.6 (online supplementary figure 1). Among those patients, 28 (8.2%) patients had NT-proBNP value <300 pg/mL, 58 (17%) had NT-proBNP value between 300 pg/mL and 1000 pg/mL and 255 (74.8%) had values>1000 pg/mL. Of the patients with NT-proBNP <300 pg/mL, evidence of HF was documented on phys-ical examination and chest radiograph.
In the subgroup of patients with NT-proBNP (n=341), patients with log NT-proBNP in the higher tertile had an adverse outcome as compared with the patients in the lower tertile (online supplementary figure 1). On multivariable Cox proportional hazard analysis, IMRS, GWTG-HF risk score and log NT-proBNP were inde-pendently associated with overall all-cause mortality with a log likelihood ratio of −573.90 (table 2A). When the scores were excluded from the multivariable model, age, heart rate, MCV, MCHC, RDW, sodium and BUN and log NT-proBNP were independently associated with overall all-cause mortality with a log likelihood ratio of −562.80 (table 2B). In patients with NT-proBNP, NT-proBNP improved the net reclassification of each score by 46.2% (IMRS) and 36.3% (GWTG-HF). Addition of NT-proBNP also improved the AUC for 3-year outcome of both the scores (0.69 vs 0.64, p=0.02 for both scores).
on September 12, 2020 by guest. Protected by copyright.
http://openheart.bmj.com/
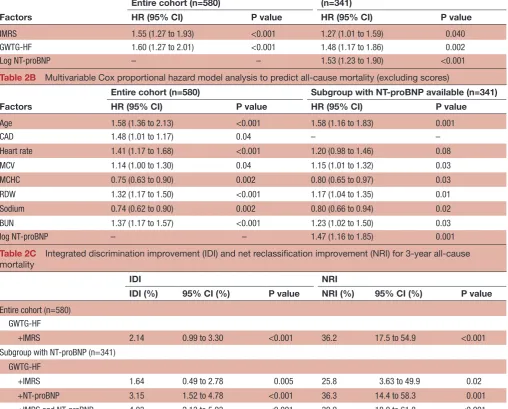
Table 2A Multivariable Cox proportional hazard model analysis to predict all-cause mortality
Factors
Entire cohort (n=580) Subgroup with NT-proBNP available (n=341)
HR (95% CI) P value HR (95% CI) P value
IMRS 1.55 (1.27 to 1.93) <0.001 1.27 (1.01 to 1.59) 0.040
GWTG-HF 1.60 (1.27 to 2.01) <0.001 1.48 (1.17 to 1.86) 0.002
Log NT-proBNP – – 1.53 (1.23 to 1.90) <0.001
Table 2B Multivariable Cox proportional hazard model analysis to predict all-cause mortality (excluding scores)
Factors
Entire cohort (n=580) Subgroup with NT-proBNP available (n=341)
HR (95% CI) P value HR (95% CI) P value
Age 1.58 (1.36 to 2.13) <0.001 1.58 (1.16 to 1.83) 0.001
CAD 1.48 (1.01 to 1.17) 0.04 – –
Heart rate 1.41 (1.17 to 1.68) <0.001 1.20 (0.98 to 1.46) 0.08
MCV 1.14 (1.00 to 1.30) 0.04 1.15 (1.01 to 1.32) 0.03
MCHC 0.75 (0.63 to 0.90) 0.002 0.80 (0.65 to 0.97) 0.03
RDW 1.32 (1.17 to 1.50) <0.001 1.17 (1.04 to 1.35) 0.01
Sodium 0.74 (0.62 to 0.90) 0.002 0.80 (0.66 to 0.94) 0.02
BUN 1.37 (1.17 to 1.57) <0.001 1.23 (1.02 to 1.50) 0.03
log NT-proBNP – – 1.47 (1.16 to 1.85) 0.001
Table 2C Integrated discrimination improvement (IDI) and net reclassification improvement (NRI) for 3-year all-cause mortality
IDI NRI
IDI (%) 95% CI (%) P value NRI (%) 95% CI (%) P value
Entire cohort (n=580) GWTG-HF
+IMRS 2.14 0.99 to 3.30 <0.001 36.2 17.5 to 54.9 <0.001
Subgroup with NT-proBNP (n=341) GWTG-HF
+IMRS 1.64 0.49 to 2.78 0.005 25.8 3.63 to 49.9 0.02
+NT-proBNP 3.15 1.52 to 4.78 <0.001 36.3 14.4 to 58.3 0.001
+IMRS and NT-proBNP 4.03 2.13 to 5.93 <0.001 39.9 18.0 to 61.8 <0.001
IMRS
+NT-proBNP 3.26 1.62 to 4.90 <0.001 46.2 24.4 to 68.0 <0.001
Variables included in the analysis were IMRS, GWTG-HF risk score, CAD, history of atrial fibrillation, BMI, haemoglobin and log NT-proBNP. HRs normalised for SD. Log likelihood ratio −760.90 for entire cohort; log likelihood ratio −573.90 for subgroup with NT-proBNP available Variables included in the analysis were age, CAD, diabetes mellitus, atrial fibrillation, heart rate, BMI, WCC, haemoglobin, haematocrit,MCV, MCHC, RDW, platelet, sodium, BUN, creatinine, potassium; HRs normalised for SD. Log likelihood ratio −742.17 for entire cohort;
loglikelihood ratio −562.80 for subgroup with NT-proBNP available.
The IDI is the difference between the discrimination slopes of basic models and basic models extended with a predictor variable. The discrimination slope is the difference in predicted probabilities (%) between subjects with and without event. The NRI reflects the improvement in discriminative power by adding a predictor variable to a Cox model already including one of the tested scores (IMRS or GWTG-HF).
GWTG-HF, Get With the Guidelines – Heart Failure; IMRS, Intermountain Risk Score; NT-proBNP, N-terminal pro-B-type natriuretic peptide.
To better understand the complementarity between scores and NT-proBNP, we visualised their relationship using a correlation network highlighting the factors considered and retained in each score (figure 4). NT-proBNP, age, BUN and creatinine were well connected to other factors playing a central role within network. There was a moderate correlation between age and both Afib and NT-proBNP, as well as a close correlation and
proximity of haematological measures (haemoglobin, RDW and haematocrit). Outside these variables, there appeared to be sparse relationships between parameters.
dIsCussIon
The main finding of this study is that the IMRS, devel-oped in a general hospitalised cohort using commonly
on September 12, 2020 by guest. Protected by copyright.
Figure 3 High-risk classifiers between scores and Kaplan-Meier survival curves according to risk stratification by scores: (A) high-risk classifiers between scores representing patients with higher score tertile based on each score; (B) Kaplan-Meier survival curves according to risk stratification by score tertiles according to the two scores (only high tertiles, at least one high tertile, only low tertiles or at least an intermediate tertile). GWTG-HF, Get With The Guidelines-Heart Failure; IMRS, Intermountain Risk Score.
Figure 4 Network analysis. (A) Correlation network analysis of the variables (clinical and laboratory factors) considered and retained in the scores using perfuse force directed layout; variables more strongly associated together. (B) Variables not strongly associated together in the network analysis. AFIB, atrial fibrillation; BMI, body mass index; BUN, blood urea nitrogen; CA, calcium; CAD, coronary artery disease; CO2, bicarbonate; COPD, chronic obstructive pulmonary disease; CREAT, serum creatinine; DM, diabetes mellitus; GLUC, blood glucose; HB, haemoglobin; HCT, haematocrit; HLD, hyperlipidaemia; HR, heart rate; K, potassium; LVEF, left ventricular ejection fraction; MCHC, mean corpuscular haemoglobin concentration; MCV, mean corpuscular volume; O2, oxygen saturation; PLT, platelet; RDW, red cell distribution width; RR, respiratory rate; SBP, systolic blood pressure; SMK, smoking; WBC, white blood cell count.
available standardised objective laboratory parameters, was associated with all-cause mortality in patients with HFpEF with a similar predictive ability as the HF-spe-cific GWTG-HF risk score. Furthermore, in combination, these two scores (ie, IMRS and GWTG-HF risk score) are complementary in predicting all-cause mortality, providing additional risk prediction when evaluated together. Consistent with previous studies, we have also validated the ability of NT-proBNP to reclassify long-term mortality risk of patients hospitalised with acute HFpEF in complement to clinical scores.
HFpEF is a growing cause of morbidity and mortality in older adults.1–4 Several series have reported a mortality
ranging from 15% to 30% at 5 years.8–10 Our population
is representative of these series, with a mortality rate of 24% over a median follow-up of 2 years. We have also observed a high prevalence of co-morbidities including DM, CAD, CKD and Afib in our population. This study shows that patients with an intermediate risk by the GWTG-HF risk score can be reclassified as high risk using IMRS. For better impact on clinical management, a novel strategy is warranted. Since there are no clinical guide-line supported specific therapeutics available for high-risk population, the practical implication would be to use these risk scores for close monitoring and management of early stage decompensation in this subpopulation.
The GWTG-HF risk score was validated in patients with acute HF including reduced and preserved ejec-tion fracejec-tion.22 28 Central to this score are age, race,
markers of renal function, heart rate and systolic BP. While GWTG-HF risk score was developed to predict in-hospital mortality, we demonstrate in our study that it also predicts long-term survival in patients with HFpEF. Compared with GWTG-HF risk score, the IMRS considers more comprehensive laboratory based markers such as RDW and WCC count that have also been shown to be
predictive of outcome in HF.29 RDW, which emerged
as strong correlate of mortality in our study, was also recently shown to predict mortality in acute HF with both HFrEF and HFpEF as well as in atherosclerosis.30–32 In
a study by Imai et al in which 278 consecutive patients with acute decompensated HFpEF were enrolled, RDW emerged as an independent predictor of poor outcome due to non-cardiac events.32 Thus, more CBC markers
such as RDW should be integrated in HF risk scores. As outlined by our univariable analysis, age is a strong factor that drives outcome in both scores. An interesting ques-tion would be if a new combined risk score can improve risk stratification and outcome in this patient population.
NT-proBNP improved the net reclassification of both scores. BNP or NT-proBNP have been used as a supportive diagnostic criteria for HFpEF as recently reviewed by Santaguida et al.33–36 BNP has previously been shown to
improve the net reclassification for in-hospital mortality when added to GWTG-HF score, although the net reclas-sification was lower as it addressed in-hospital mortality.22
Among other biomarkers, troponin (including higher sensitivity troponin) has been shown to be associated with adverse in-hospital and postdischarge outcomes in patients with acutely decompensated HFpEF.37 While
on September 12, 2020 by guest. Protected by copyright.
http://openheart.bmj.com/
biomarkers such as ST-2, galectin-3, growth differentiating factor-15 (GDF-15) have also been predictive of outcome in HFpEF,38–40 their incremental value to well-validated
and simple clinical scores remains to be proven. In addi-tion to clinical and laboratory data, several investigators have assessed the importance of echocardiographic parameters in patients with HFpEF such as haemody-namic parameters namely right ventricular systolic pres-sure41 and deformation imaging parameters focusing
on left ventricle42 or left atrium.43 To evaluate the
incre-mental role of these parameters to the risk scores is the subject of ongoing research.
As is being implemented in several centres, clinical risk scores are being automatically generated using elec-tronic medical records. Several centres are using these scores to guide pathways of care following discharge.44
We therefore envision that incorporating multiple risk scores should not be an added burden on care and could help identify features of risk captured by complementary scores. Our study also identifies the direction to develop novel risk scores that incorporate NT-proBNP and other commonly available biomarkers such as RDW, which could further improve and simplify pathway of care in HF management.
limitations
The present study should be interpreted in the context of its limitations. First, this is a retrospective single-centre cohort study with relatively smaller sample size, and there-fore, validation is required. The study cohort, however, is representative of the recent trials and registries and the data, and each chart was carefully reviewed. Second, we did not collect data to calculate the scores for patients with HF and reduced ejection fraction to compare with HFpEF. Other biomarkers such as GDF-15 were not meas-ured in our cohort. It will be interesting, though chal-lenging, to see the incremental value of other biomarkers in addition to NT-proBNP to risk models derived from other cohorts. We did not include rehospitalisation as a secondary end-point as patients were followed at different institutions during the study period leading to incomplete data collection. Finally, we only used variables available on admission and future studies to investigate whether improvement of factors related to these scores or BNP have an impact on longer outcome.
ConClusIon
Established risk scores including the broadly applicable IMRS and the HF-specific GWTG-HF risk score, along with NT-proBNP, play an important complementary role in predicting outcomes in patients hospitalised with HFpEF and could lead to the development of new inte-grated clinical scores using data that are already collected as a part of standard clinical HF care.
Author affiliations
1Cardiovascular Institute, Stanford University School of Medicine, Stanford, California, USA
2Department of Medicine, Division of Cardiovascular Medicine, Stanford University School of Medicine, Stanford, California, USA
3Research Unit Hypertension and Cardiovascular Epidemiology KU Leuven, Department of Cardiovascular Sciences, University of Leuven, Leuven, Belgium 4Intermountain Heart Institute, Intermountain Medical Center, Salt Lake City, Utah, USA
5Cardiovascular Diseases, Intermountain Medical Center, Murray, Utah, USA
Acknowledgements This work was supported by the Intermountain-Stanford Collaboration Initiative and the Philips Royal Research Grant of Heart Failure with Preserved Ejection Fraction. We also would like to acknowledge the Srinivasan research fund.
Contributors All authors take responsibility for all aspects of the reliability and freedom from bias of the data presented and their discussed interpretation. Competing interests None declared.
Patient consent for publication Not required.
Provenance and peer review Not commissioned; externally peer reviewed. data availability statement No additional data are available.
open access This is an Open Access article distributed in accordance with the Creative Commons Attribution Non Commercial (CC BY-NC 4.0) license, which permits others to distribute, remix, adapt, build upon this work non-commercially, and license their derivative works on different terms, provided the original work is properly cited, appropriate credit is given, any changes made indicated, and the use is non-commercial. See: http:// creativecommons. org/ licenses/ by- nc/ 4. 0/.
RefeRences
1. Upadhya B, Kitzman DW. Heart failure with preserved ejection fraction in older adults. Heart Fail Clin 2017;13:485–502. 2. Sanderson JE. Factors related to outcome in heart failure with a
preserved (or normal) left ventricular ejection fraction. Eur Heart J Qual Care Clin Outcomes 2016;2:153–63.
3. Dunlay SM, Roger VL, Redfield MM. Epidemiology of heart failure with preserved ejection fraction. Nat Rev Cardiol 2017;14:591–602. 4. Steinberg BA, Zhao X, Heidenreich PA, et al. Trends in patients
hospitalized with heart failure and preserved left ventricular ejection fraction: prevalence, therapies, and outcomes. Circulation
2012;126:65–75.
5. Choudhury L, Gheorghiade M, Bonow RO. Coronary artery disease in patients with heart failure and preserved systolic function. Am J Cardiol 2002;89:719–22.
6. Levy D, Larson MG, Vasan RS, et al. The progression from hypertension to congestive heart failure. JAMA 1996;275:1557–62. 7. van Heerebeek L, Hamdani N, Handoko ML, et al. Diastolic stiffness
of the failing diabetic heart: importance of fibrosis, advanced glycation end products, and myocyte resting tension. Circulation
2008;117:43–51.
8. Owan TE, Hodge DO, Herges RM, et al. Trends in prevalence and outcome of heart failure with preserved ejection fraction. N Engl J Med 2006;355:251–9.
9. Chan MMY, Lam CSP. How do patients with heart failure with preserved ejection fraction die? Eur J Heart Fail 2013;15:604–13. 10. Ambrosy AP, Fonarow GC, Butler J, et al. The global health and
economic burden of hospitalizations for heart failure: lessons learned from hospitalized heart failure registries. J Am Coll Cardiol
2014;63:1123–33.
11. Peterson PN, Rumsfeld JS, Liang L, et al. A validated risk score for in-hospital mortality in patients with heart failure from the American Heart Association Get With the guidelines program. Circ Cardiovasc Qual Outcomes 2010;3:25–32.
12. Horne BD, May HT, Kfoury AG, et al. The intermountain risk score (including the red cell distribution width) predicts heart failure and other morbidity endpoints. Eur J Heart Fail 2010;12:1203–13. 13. Levy WC, Mozaffarian D, Linker DT, et al. The Seattle heart
failure model: prediction of survival in heart failure. Circulation
2006;113:1424–33.
14. Pocock SJ, Ariti CA, McMurray JJV, et al. Predicting survival in heart failure: a risk score based on 39 372 patients from 30 studies. Eur Heart J 2013;34:1404–13.
15. Lee DS, Austin PC, Rouleau JL, et al. Predicting mortality among patients hospitalized for heart failure: derivation and validation of a clinical model. JAMA 2003;290:2581–7.
16. Horne BD, May HT, Muhlestein JB, et al. Exceptional mortality prediction by risk scores from common laboratory tests. Am J Med
2009;122:550–8.
on September 12, 2020 by guest. Protected by copyright.
17. Horne BD, Anderson JL, Muhlestein JB, et al. Complete blood count risk score and its components, including RDW, are associated with mortality in the JUPITER trial. Eur J Prev Cardiol 2015;22:519–26. 18. Smaha LA, American Heart Association. The American Heart
Association Get With the guidelines program. Am Heart J 2004;148(5 Suppl):S46–S48.
19. Hong Y, LaBresh KA. Overview of the American Heart Association "Get with the Guidelines" programs: coronary heart disease, stroke, and heart failure. Crit Pathw Cardiol 2006;5:179–86.
20. Heidenreich PA, Hernandez AF, Yancy CW, et al. Get With the guidelines program participation, process of care, and outcome for Medicare patients hospitalized with heart failure. Circ Cardiovasc Qual Outcomes 2012;5:37–43.
21. Scrutinio D, Ammirati E, Passantino A, et al. Predicting short-term mortality in advanced decompensated heart failure - role of the updated acute decompensated heart failure/N-terminal pro-B-type natriuretic Peptide risk score. Circ J 2015;79:1076–83.
22. Shiraishi Y, Kohsaka S, Abe T, et al. Validation of the Get With the Guideline-Heart failure risk score in Japanese patients and the potential improvement of its discrimination ability by the inclusion of B-type natriuretic peptide level. Am Heart J 2016;171:33–9. 23. Lowe HJ, Ferris TA, Hernandez PM, et al. STRIDE--An integrated
standards-based translational research informatics platform. AMIA Annu Symp Proc 2009;2009:391–5.
24. Pencina MJ, D'Agostino RB, Steyerberg EW. Extensions of net reclassification improvement calculations to measure usefulness of new biomarkers. Stat Med 2011;30:11–21.
25. Shannon P, Markiel A, Ozier O, et al. Cytoscape: a software environment for integrated models of biomolecular interaction networks. Genome Res 2003;13:2498–504.
26. Fruchterman TMJ, Reingold EM. Graph drawing by force-directed placement. Softw: Pract. Exper. 1991;21:1129–64.
27. Moneghetti KJ, Giraldeau G, Wheeler MT, et al. Incremental value of right heart metrics and exercise performance to well-validated risk scores in dilated cardiomyopathy. Eur Heart J Cardiovasc Imaging
2018;19:916–25.
28. Lagu T, Pekow PS, Shieh M-S, et al. Validation and comparison of seven mortality prediction models for hospitalized patients with acute decompensated heart failure. Circ Heart Fail 2016;9. 29. Horne BD, Anderson JL, John JM, et al. Which white blood cell
subtypes predict increased cardiovascular risk? J Am Coll Cardiol
2005;45:1638–43.
30. Felker GM, Allen LA, Pocock SJ, et al. Red cell distribution width as a novel prognostic marker in heart failure: data from the CHARM program and the Duke Databank. J Am Coll Cardiol 2007;50:40–7. 31. Sotiropoulos K, Yerly P, Monney P, et al. Red cell distribution width
and mortality in acute heart failure patients with preserved and reduced ejection fraction. ESC Heart Fail 2016;3:198–204.
32. Imai R, Uemura Y, Okumura T, et al. Impact of red blood cell distribution width on non-cardiac mortality in patients with acute decompensated heart failure with preserved ejection fraction. J Cardiol 2017;70:591–7.
33. Cypen J, Ahmad T, Testani JM, et al. Novel biomarkers for the risk stratification of heart failure with preserved ejection fraction. Curr Heart Fail Rep 2017;14:434–43.
34. Kang S-H, Park JJ, Choi D-J, et al. Prognostic value of NT-proBNP in heart failure with preserved versus reduced EF. Heart
2015;101:1881–8.
35. Flint KM, Allen LA, Pham M, et al. B-type natriuretic peptide predicts 30-day readmission for heart failure but not readmission for other causes. J Am Heart Assoc 2014;3:e000806.
36. Santaguida PL, Don-Wauchope AC, Oremus M, et al. BNP and NT-proBNP as prognostic markers in persons with acute decompensated heart failure: a systematic review. Heart Fail Rev
2014;19:453–70.
37. Pandey A, Golwala H, Sheng S, et al. Factors associated with and prognostic implications of cardiac troponin elevation in decompensated heart failure with preserved ejection fraction: findings from the American Heart Association Get With the Guidelines-Heart failure program. JAMA Cardiol 2017;2:136–45. 38. Manzano-Fernández S, Mueller T, Pascual-Figal D, et al.
Usefulness of soluble concentrations of interleukin family member ST2 as predictor of mortality in patients with acutely decompensated heart failure relative to left ventricular ejection fraction. Am J Cardiol 2011;107:259–67.
39. Edelmann F, Holzendorf V, Wachter R, et al. Galectin-3 in patients with heart failure with preserved ejection fraction: results from the Aldo-DHF trial. Eur J Heart Fail 2015;17:214–23.
40. Izumiya Y, Hanatani S, Kimura Y, et al. Growth differentiation factor-15 is a useful prognostic marker in patients with heart failure with preserved ejection fraction. Can J Cardiol
2014;30:338–44.
41. Lam CSP, Roger VL, Rodeheffer RJ, et al. Pulmonary hypertension in heart failure with preserved ejection fraction: a community-based study. J Am Coll Cardiol 2009;53:1119–26.
42. Shah AM, Claggett B, Sweitzer NK, et al. Prognostic importance of impaired systolic function in heart failure with preserved ejection fraction and the impact of spironolactone. Circulation
2015;132:402–14.
43. Santos ABS, Roca GQ, Claggett B, et al. Prognostic relevance of left atrial dysfunction in heart failure with preserved ejection fraction.
Circ Heart Fail 2016;9:e002763.
44. Evans RS, Benuzillo J, Horne BD, et al. Automated identification and predictive tools to help identify high-risk heart failure patients: pilot evaluation. J Am Med Inform Assoc 2016;23:872–8.
on September 12, 2020 by guest. Protected by copyright.
http://openheart.bmj.com/