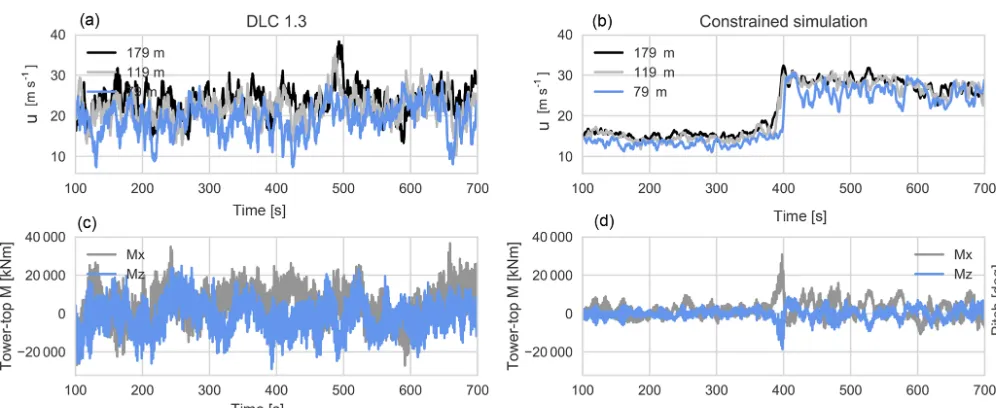
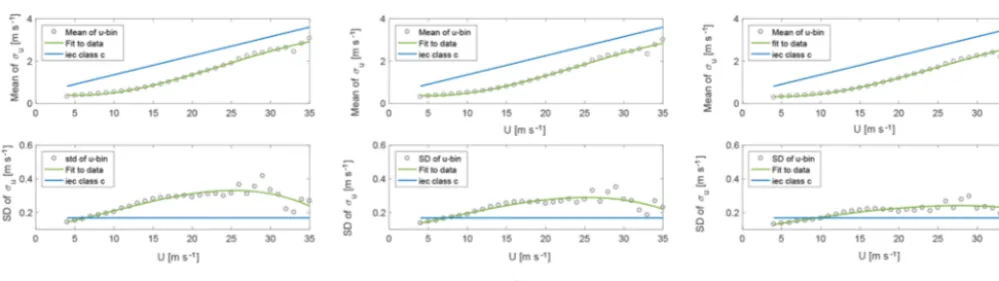
Extreme wind fluctuations: joint statistics, extreme turbulence, and impact on wind turbine loads
Full text
Figure
Related documents
After meeting with your chemistry advisor to discuss a plan for courses for Winter term, and receive your registration PIN for Winter term, it is your responsibility to register
Table I Panel A reports the percentage of the variance of log price dividend ratio that is driven by shocks to expected cash flows versus shocks to expected returns for two
NTFS offers a secure environment and flexible control over what can be accessed by which users, to allow for many different users and groups of users to be networked
As one court observed near the turn of the century, willful and reckless conduct must be viewed as "much more than mere negli- gence, or even gross or
We show that the optimal funding strategy involves a contribution rate that is not constant over the life of the plan but is age'dependent and reflects the trade'off between the
A second feature of well-designed loans, is that the loan should be large enough to cover fees, and ideally also living costs, resolving student poverty and promoting access by
Inkomna handlingar 2020. *Övrig
