Environmental Resources Research
Vol. 5, No. 1, 2017
GUASNR
Analysis of landings and environmental variables time series
from the Caspian Sea
H. Fazli*1, A.A. Ghanghermeh2, R. Shahifar3
1
Caspian Sea Ecology Research Center, Iranian Fisheries Science Research Institute, Agricultural Research Education and Extension Organization, Sari, Iran
2Department of Geography, Faculty of Human Science, Golestan University, Gorgan, Iran 3Iranian Fisheries Organization, Tehran, Iran
Received: July 2015 ; Accepted: May 2016
Abstract1
In the present study, time series encompassing the years 1950-2011 of commercial fish landings from the Caspian Sea were analyzed using min/max autocorrelation factor analysis (MAFA) and dynamic factor analysis (DFA). The aim was to identify trends and explore the relationships between the response variables (annual landings of 10 species/ groups such as kilkas, kutum, common carp, pike perch, roach, shads, bream, mullets, seal and sturgeons) and explanatory variables (sea level and Volga river water volume). Landings were highly correlated with environmental variables. Both techniques gave coherent results, indicating that the two most important trends in the response variables are: (i) a decrease in landings during second half of the time-series and (ii) a fluctuating pattern. The main common trends obtained by MAFA and DFA were positive for kilkas, sturgeons, seal and shads. The most significant MAFA axis showed a steady stablility in the first half and a sharp decrease in the second half, which was similar to the most important common trend of the DFA. Species such as kilka, sturgeons, seal, shads and perch were significantly positively related. On the contrary, landings of mullets and kutum were negatively related to the first trend. Considering our results on the ecological and environmental data, these variables and impacts of human activities should be taken into account when managing coastal environments for the conservation of these species in the Caspian Sea.
Keywords: Min/max autocorrelation factor analysis, Dynamic factor analysis, Fisheries, Caspian Sea, Landings, Sea level, Time series.
*
Introduction
The most abundant fishes in the Caspian Sea are three small species of clupeids known as “kilka”: common kilka (Clupeonella cultriventris caspia Svetovidov 1941), anchovy kilka (C. engrauliformis, Bordin 1904) and bigeye kilka (C. grimmi Kessler, 1877). All three kilka species are caught by commercial fisheries that use liftnets or fish pumps with underwater electric lights (Nikonorov, 1964). Caspian sturgeon is the most valuable fish in the world. Caspian sturgeon fisheries have historically produced most of the world’s supply of caviar. There are five anadromous species of sturgeons in the Caspian basin [beluga (Huso huso), Persian sturgeon (Acipenser persicus), Russian sturgeon (A. guldenstaedtii), stellate (A. stellatus) and ship (A. nudiventris)] (Levin, 1997). All species but the Persian sturgeon, which is found mainly in the southern Caspian region, are distributed throughout the Caspian Sea (Artyukhin and Zarkua, 1986).
Historically, the Volga River has been the most important river for the spawning of sturgeons, but due to the construction of the Volgograd Hydroelectric Dam (Volga River), the majority of natural spawning grounds for sturgeons were lost (Secor
et al., 2000). Also, variations in Caspian Sea level, illegal fishing activity and extraction of oil are considered as key risk factors for juvenile sturgeon survival, requiring the red listing of the species in the IUCN endangered species list (Bristein, 1996; Secor et al., 2000). To mitigate the lost reproduction that once occurred in the Volga River and other factors, the Soviet Union initiated a large hatchery-based program. Consequently, the Soviet Union’s important exports of caviar were largely sustained by this hatchery program. By the end of 19th century, Russia was a major caviar trading nation. Today, the Caspian nations of Iran, Kazakhstan, Russia and to a lesser extent Azerbaijan and Turkmenistan, dominate the international capture of fisheries products trade (De Meulenaer and Raymakers, 1996; Raymakers, 2002).
In the past decades, environmental condition of the Caspian Sea has changed significantly in response to impacts of various factors, such as fluctuations in sea level (Rodionov, 1994), pollution (Ivanov,
2000; Salmanov, 1999) and introductions of exotic species. The new invasive species (Ctenophora, Mnemiopsis leidyi), first observed in November 1999 (Ivanov et al.,
2000) has subsequently affected the distribution and abundance of plankton species (Roohi et al., 2010), kilka stocks (Fazli et al., 2007; Fazli et al., 2009; Daskalov and Mamedov, 2007) and golden grey mullet (Fazli et al., 2008). Milly
et al. (2008) reported that ecological and environmental condition of the Caspian Sea is changing because of substantial anthropogenic change effects on the global climate that is altering the means and extremes of precipitation, sea level and river discharges. Therefore, long-term monitoring of temporal variations in catch of main species/groups and environmental factors is necessary to maintain the sustainability of these species in the Caspian Sea. The objective of the present study was to examine the environmental changes (such as sea level and Volga river water volume) and their effects on the main commercial fish species in the Caspian Sea. Two techniques, Min/Max Auto-correlation Factor Analysis (MAFA) and Dynamic Factor Analysis (DFA) were used to estimate and extract trends for 10 species/ groups landed in the Caspian regions and to evaluate the importance of fisheries and environmental explanatory variables.
Materials and Methods
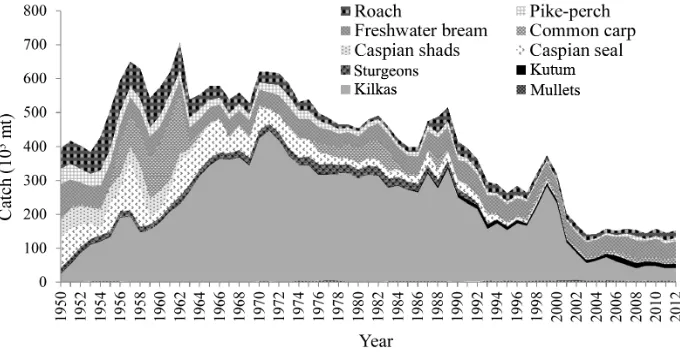
Official landings statistics of ten species/groups of fishes in the whole Caspian Sea for the period from 1950 to 2011 were compiled. Information on total catches of fish species/groups were accessed from the FAO statistics Unit (FAO Fisheries Department, Fishery Information, Data and Statistic, Fishstat Plus software; Figure 1). These species/ groups include small pelagics (three species of kilka, Genus Clupeonella) and three mesopelagic; kutum (Rutilus frisii kutum), common carp (Cyprinus carpio); pike perch (Sander lucioperca); roach (Rutilus rutilus); shads (Genus Alosa); bream (Abramis brama); mullets (two species Liza aurata
annual landings in the Caspian Sea. Two explanatory variables, sea level and Volga
river water volume were used in the modelling (CSNRC, 2014).
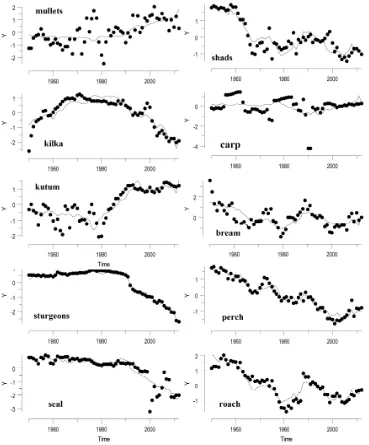
Figure 1. Annual catches of Caspian main species/groups (data source on catches: Fishstat Plus, FAO Fisheries Department, Fishery Information, Data and Statistic Unit; FISHSTAT Plus: Universal software for fishery statistical time series).
To facilitate the interpretation of factor loadings and canonical correlations, the time-series of catch and explanatory variables were standardized. To obtain data that are approximately normally distributed, various data transformations were applied. QQ-plots were made for the original catch time series and square root, cubic root and log10 transformed data were also applied. All
plots indicated that transformation results in ‘more normally distributed’ data, the log10 is
favorable in most cases. The additional benefit of a transformation is that it reduces the influence of large observations.
The trends of data obtained by means of the Min/Max Auto-correlation Factor Analysis (MAFA) and Dynamic Factor Analysis (DFA) helped to estimate and extract common trends from the multivariate time series data set.
MAFA (Solow, 1994) can be described in various ways, e.g. a type of principal component analysis (PCA) and a method for extracting trends from multiple time series. Unlike PCA, in which the first axis explains most of the variance, the first MAFA axis has the highest auto-correlation with lag 1; it represents the main trend in the data. The second axis has the second highest auto-correlation with time lag 1, etc. The underlying idea is that a trend is associated with high auto-correlation
with time lag 1. This axis can also be seen as an index function or smoothing curve. Summarizing, MAFA can be seen as a PCA-type analysis in which the axes represent trends. Cross-correlations (canonical correlations) between the variables (both response and explanatory variables) and the trends were computed to evaluate the significance of the relationship between the variables and the trends (Erzini
et al., 2005; Zuur et al., 2007). The Brodgar (http://www.brodgar.com) software package was used to carry out MAFA of the time-series of response variables and explanatory variables.
2007). One of the advantages of using a non-diagonal matrix is that the number of common trends needed for an adequate model fit is smaller. Therefore, according to Ligas et al. (2010), DFA models with one common trend and a symmetric, non-diagonal covariance matrix were used to analyze the two data sets. Also, a series of models were fitted, ranging from the simplest, with only one explanatory variable, to two explanatory variables. Akaike’s information criterion (AIC) was used as a measure of goodness-of-fit and to compare models (Zuur et al., 2003b). The AIC is a function of a measure of fit and the number of parameters, with the best model having the smallest AIC. Factor loadings were used to make inferences regarding the importance of particular trends, representing underlying common patterns over time, both to specific response variables and to different groups of response variables (Erzini, 2005; Erzini
et al., 2005; Zuur et al., 2007). Data exploration and analysis were performed using the software package Brodgar 2.5.1 (www.brodgar.com).
Results
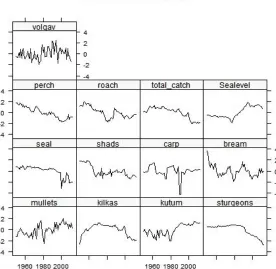
The transformed and standardized landing time-series for the 10 species/ groups as well as the total landings and standardized annual values of the explanatory variables are summarized in Figure 2. Landing time series are characterized by considerable variability, with clear differences in patterns between species. Total landings were peaked in 1962, decreased in the lowest level in 2002 and remained fairly stable thereafter. It should be mentioned that the trend for sturgeons, kilkas and fairly seal are similar to the total landings. In contrast, mullets and kutum had an increasing trend and perch and roach a decreasing trend, characterized by a fluctuating pattern. The catch time-series for shads, bream and carp showed considerable variability and trends were not easy to be identified. The Lowest and highest annual sea levels (SL) were recorded in 1977 and 1995. Volga River water volume (VRWV) displayed a similar pattern with oscillations over time.
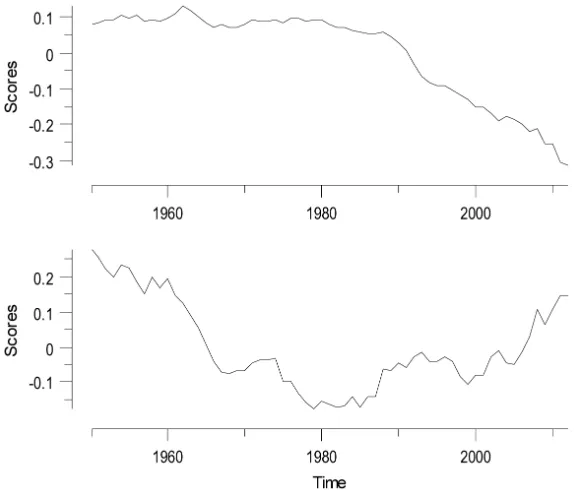
Two MAFA axes were significant and can be treated as index series that show the common behavior of the landings time series (Figure 3). The first MAFA axis, with an autocorrelation of 0.99 (P < 0.001) represents a steady and stable trend from 1950 to 1980s, followed by a
steady decline. The second MAFA axis (autocorrelation of 0.97, P < 0.001) shows a decreasing trend in a low in 1980s, increasing and stable in 1988-1997, decreasing in 1999 and finally followed by an increase.
Figure 3. Two significant min/max autocorrelation factor analysis (MAFA) axes: MAFA 1 (top) and MAFA 2 (bottom).
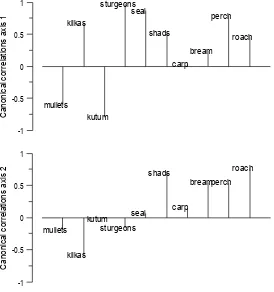
The canonical correlations, illustrating the relationships between species and two MAFA axes, are represented in Figure 4. According to cross-correlations, the first axis was significantly related for 8 of the 10 species, six of these were significantly positively related to kilkas, sturgeons, seal, shads, perch and roach and negatively correlated with mullets and kutum (P<0.05). The plot of canonical correlation for the second MAFA axis represented negative correlation for kilkas and positive correlation with Shads, Bream, Perch and Roach (P<0.05). Only the explanatory variable sea level was negatively correlated with the first axis.
The best DFA fit, with the lowest AIC value, was obtained for the model with symmetric, non-diagonal matrix and two
The estimated t-values for the regressions of response and explanatory variables (SL and VRWV) are summarized in Table 3. Relatively large t-values were obtained for Kutum, Carp and the first explanatory
variable, indicate strong relationships (P<0.05). On the contrary, there was no strong relation between explanatory variables and VRWV.
mullets kilkas
kutum sturgeons
seal
shads
carp bream
perch
roach
C
a
n
o
n
ic
a
l c
o
rr
e
la
ti
o
n
s
a
x
is
1
-1 -0.5 0 0.5 1
mullets
kilkas kutum
sturgeons seal
shads
carp
breamperch roach
C
a
n
o
n
ic
a
l c
o
rr
e
la
ti
o
n
s
a
x
is
2
-1 -0.5 0 0.5 1
Figure 4. Canonical correlation for two MAFA axes. Correlations <-0.25 or >0.25 are significant (P<0.05).
Table 1. Values of Akaike's information criterion (AIC) for DFA models with a variable number (M) of common trends (ct) (ct; M = 1-2) and different sets of explanatory (exp) variables (see level, SL and Volga River water volume, VRWV) based on a symmetric, non-diagonal matrix. The lowest AIC value is highlighted in bold.
M common trends
Model exp
1 2
M-ct + noise - 1155 1026
SL 1170 1323
VRWV 1169 1263
M-ct + exp + noise
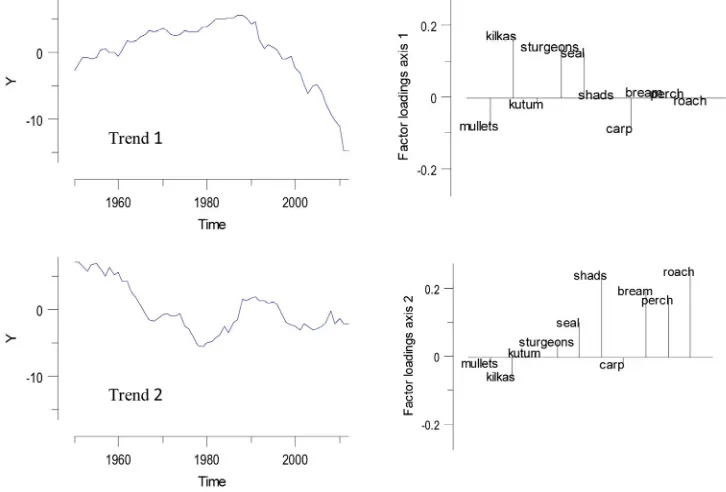
Figure 5. The two common trends (left) and factor loadings (right) for dynamic factor analysis model with two explanatory factors: sea level and Volga River water volume.
Table 2. Canonical correlations for the dynamic factor analysis model with two main trends and two explanatory variables (sea level and Volga River water volume).
Canonical correlations Species/groups
Trend 1 Trend 2
Mullets Kilkas Kutum Sturgeons Seal Shads Carp Bream Perch Roach
-0.452 0.820 -0.516
0.927 0.796 0.304 -0.169
0.141 0.472 0.225
-0.179 -0.475 0.046 -0.077
0.165 0.780 0.045 0.631 0.562 0.839
Table 3. Estimated t-values for two explanatory variables: sea level and Volga River water volume. Significant values in bold (P<0.05).
Explanatory variable Landings series
Sea level Volga River water volume Mullets
Kilkas Kutum Sturgeons Seal Shads Carp Bream Perch Roach
0.42 -0.74 10.93 -0.55 1.07 2.09 -4.67 3.58 -1.06 1.51
The observed and fitted landings are shown in Figure 6. In most cases, the fits were reasonable with model adequately describing the trend. Several patterns can be seen for the 10 species/groups. Mullets and kutum are characterized by an initial steady and stable trend followed by increases in the 1980s while shads, bream and roach show an initial decline followed by steady and stable trend in the period 1970 s - 1980 s. Perch landings show a general decline,
while carp landings show oscillations over time. Only the kilkas landings, the main group, show an initial increase, peaked in the 1970 s followed by decline, especially in the 1990 s - 2000 s. Seal and the landings of the most valuable group of the Caspian Sea, sturgeons, are characterized by an initial steady and stable trend followed by decline in 1990s, coincidently with kilkas landings decline.
Discussion
As Rochet et al. (2008) reported, biological time series, used with abiotic data (such as environmental variables) are essential tools to track the long-term properties of marine systems. These show meaningful shifts which can be traced back to human impact or other causes. Therefore, the present study is the first attempt to analyze the temporal changes of the landings of 10 main species/groups and evaluate the influence of two environmental variables and landings by means of a statistics based approach in the Caspian Sea.
Without any doubt changes in environmental factors strictly influence on fish stocks but analysis of all chemical, physical and biological factors at the same time needs reliable data from the Caspian Sea for many different species of fish and a model. Because of many reasons, valuable and enough data are not available now. So, attention to some important factors such as sea level fluctuation for which the Volga River is the most important supplier seems necessary.
In the present study, two techniques, MAFA and DFA were applied to 10 landing series and two explanatory environmental variables in the Caspian Sea, which provided coherent results, indicating that the two most important trends in the response variables are: (i) a decrease in landings during second half of the time-series and (ii) fluctuating pattern. Although there are many factors which influence on fish stocks and amount of landing but there is a direct correlation between the level of sea and different fish landing. In fact, during low level of river water flows and low sea level the condition of environment is positively changed for some species such as kilka but not so for the other species such as Mullet. Surely, the quantity of this correlation is variable for different species because of their biology and physiology functions and detail analysis is needed to specify this correlation for each species. This study was based on landings due to the absence of reliable CPUE data. As reported by Valdemarsen, 2001; Pauly
et al., 2002 and mentioned by Erzini, 2005, the CPUE is a better proxy of fish abundance than landings because the latter
do not take into account technological developments that are the major cause of increased landings and over-exploitation. Nevertheless, as reported by Pinnegar et al., 2003, landings trends can be considered important baseline data.
As it is shown in Figure 1 and reported by Daskalov and Mamedov (2007), three species of kilka are important commercially in the Caspian Sea, together accounting for more than 80% of the total catch in the past decades. Also, these species are crucial part of the food chain. Kilkas are the main food items for sturgeons, seal and shads (Prikhod'ko, 1979). These predators consume 590 million kg of the three kilka species (Badalov, 1972). The present study showed that, the main common trends obtained by MAFA and DFA were positively related among kilkas, sturgeons, seal and shads. Therefore, as also mentioned by Daskalov and Mamedov (2007), their sustainable management is vital to future fisheries operations and the health of the Caspian Basin ecosystem.
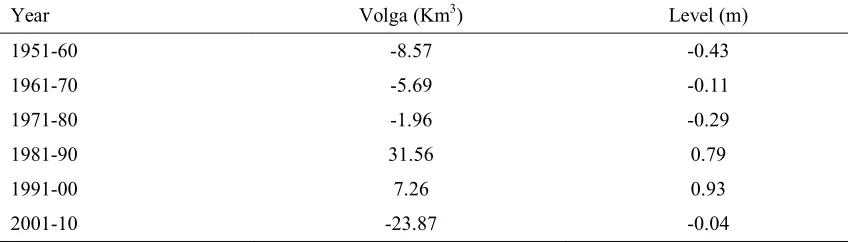
Table 4. Decadal changes in sea level and the Volga River outflow during 1951-2010.
Year Volga (Km3) Level (m)
1951-60 -8.57 -0.43
1961-70 -5.69 -0.11
1971-80 -1.96 -0.29
1981-90 31.56 0.79
1991-00 7.26 0.93
2001-10 -23.87 -0.04
Conclusion
The results of MAFA and DFA techniques were largely in agreement. The most significant MAFA axis showed a steady and stable trend in the first half and sharply decreased in the second half, which was similar to the most important common trend of the DFA. Species such as kilka, sturgeons, seal, shads and perch were significantly positively related. On the contrary, landings of two species, mullts and kutum were negatively related to the first trend. Rodionov, 1994; Sedov et al., 1998; Daskalov, 2003 reported that these fluctuations in fish abundance can be related to climate change such as
sea-level fluctuations and freshwater run-off.
Therefore, MAFA and DFA were found suitable statistical techniques to evaluate the evolution of multi-species/multi-gear fisheries. However, the key recommended point is, beside environmental aspects, there are many anthropogenic and social-economic elements which are influencing of landing on different species. Hence, making a decision about water level influences is not straightforward but is necessary. We conclude that fisheries management should be changed to reflect ecosystem-based management and linked to population and ecosystem elements.
References
Artyukhin, E.N., and Zarkua, Z.G. 1986. Taxonomic status of sturgeon of the Rioni River (Black Sea basin). Voprosy Ikhtiologii 26, 61-67 (In Russian; English translation: J. Ichthyol. 26, 29-36).
Badalov, F.G. 1972. The food of Clupeonella delicatula (Nordm.) and C. engrauliformis (Borodin) in Bol'shoy Kyzylagach Bay in the Caspian. Journal of Ichthyology. 12 (6), 1027-1030.
Birstein, V.J. 1996. Sturgeons in the lower Danube: a trip to Romania. Sturgeon Quarterly, 4, 10-11. CSNRC. 2014. Hydroclimatology Bank of Caspian Sea, Water Research Institute, Ministry of Energy,
Sari, Iran.
Daskalov, G.M. 2003. Long-term changes in fish abundance and environmental indices in the Black Sea. Marine Ecology Progress Series. 255, 259-270.
Daskalov, G.M., and Mamedov, E.V. 2007. Integrated fisheries assessment and possible causes for the collapse of anchovy kilka in the Caspian Sea. ICES Journal of Marine Science. 64, 503-511.
De Meulenaer, T., and Raymakers, C. 1996. Sturgeons of the Caspian Sea and Investigation of the International Trade in Caviar. TRAFFIC International, Cambridge.
Erzini, K. 2005. Trends in NE Atlantic landings (southern Portugal): identifying the relative importance of fisheries and environmental variables. Fisheries Oceanography. 14 (3), 195-209.
Erzini, K., Inejih, C.A.O., and Stobberup, K.A. 2005. An application of two techniques for the analysis of short, multivariate non-stationary time-series of Mauritanian trawl survey data. ICES Journal of Marine Science. 62 (3), 353-359.
Fazli, H., Zhang, C.I., Hay, D.E., Lee, C.W., Janbaz, A.A., and Borani, M.S. 2007. Population Dynamics and Stock Assessment of Common Kilka (Clupeonella cultriventris caspia) in the Caspian Sea. Iran. Journal of Fisheries Science. 7 (1), 47-70.
Fazli, H., Zhang, C.I., Hay, D.E., and Lee, C.W. 2009. Stock assessment and management implications of anchovy kilka (Clupeonella engrauliformis) in Iranian waters of the Caspian Sea, Fisheries Research. 100, 103-108.
Ivanov, V.P. 2000. Biological Resources of the Caspian Sea. KaspNIRKh, Astrakhan. 96p.
Ivanov, P.I., Kamakim, A.M., Ushivtzev, V.B., Shiganova, T.A., Zhukova, O., Aladin, N., Wilson, S.I., Harbinson, G.R., and Dumont, H.J. 2000. Invasion of Caspian Sea by the come jellyfish Mnemiopsis
leidyi (Ctenophora). Biological Invasion. 2, 255-258.
Levin, A. 1997. The distribution and migration of sturgeons in the Caspian Sea. In: Sturgeon Stocks and Caviar Trade Workshop (Proceedings of the Sturgeon Stocks and Caviar Trade Workshop, Bonn, 9 October–10 October, 1995). V.J. Birstein, A. Bauer and A. Kaiser- Pohlmann, eds. IUCN, Gland, Cambridge, Bonn, pp. 13-20.
Ligas, A., Ranieri, S.De., Micheli, D., Reale, B., Sartor, P., Sbrana, M., and Belcari, P. 2010. Analysis of the landings and trawl survey time series from the Tyrrhenian Sea (NW Mediterranean). Fisheries Research. 105, 46-56.
Milly, P.C.D., Betancourt, J., Falkenmark, M., Hirsch, R.M., Kundzewicz, Z.W., Lettenmaier, D.P., and Stouffer, R.J. 2008. Stationarity is dead: whither water management. Science. 319, 573-574.
Nikonorov, I.V. 1964. Pump fishing with light and electric current, In: Modern Fishing Gear of the World 2: Fishing News (Books), London. pp. 577-579.
Pauly, D., Christensen, V., Guenette, S., Pitcher, T.J., Sumaila, U.R., Walters, C.J., Watson, R., and Zeller, D. 2002. Towards sustainability in world fisheries. Nature, 418, 689-695.
Pinnegar, J.K., Polunin, N.V.C., and Badalamenti, F. 2003. Long-term changes in the trophic level of western Mediterranean fishery and aquaculture landings. Canadian Journal of Fisheries Aquaculture Science. 60, 222-235.
Prikhod’ko, B.I. 1979. About a relation between the harvest of juveniles of the Caspian anchovy kilka Clupeonella engrauliformis (Borodin) and temperature of water. Journal of Ichthyology. 19, 291-301 (In Russian).
Raymakers, C. 2002. International trade in sturgeon and paddlefish species – the effect of CITES listing. International Review of Hydrobiology. 87, 525-537.
Rochet, M.J., Prigent, M., Bertrand, J.A., Carpentier, A., Coppin, F., Delpech, J.P., Fontenelle, G., Foucher, E., Mahé, K., Rostiaux, E., and Trenkel, V.M. 2008. Ecosystem trends: evidence for agreement between fishers’ perceptions and scientific information. ICES Journal of Marine Science. 65, 1057-1068.
Rodionov, S.N. 1994. Global and Regional Climate Interaction: the Caspian Sea Experience. Water Science and Technology Library, 11. Kluwer, Dordrecht. 233p.
Roohi, A., Kideys, A., Sajjadi, A., Hashemian, A., Pourgholam, R., Fazli, H., Ganjian Khanari, A., and Eker-Develi, E. 2010. Changes in biodiversity of phytoplankton, zooplankton, fishes and macrobenthos in the Southern Caspian Sea after the invasion of the ctenophore Mnemiopsis leidyi,
Biological Invasions. 12, 2343-2361.
Salmanov, M.A. 1999. Ecology and biological reproduction of the Caspian Sea. Edited by U.I. Sorokin. Baku. 397p.
Secor, D.H., Arefiev, V., Nikolaev, A., and Sharov, A. 2000. Restoration of sturgeons: lessons from the Caspian Sea Sturgeon ranching programme. Fish and Fisheries. 1, 215-230.
Sedov, S.I., Aseynova, A.A., and Paritskiy, Yu.A. 1998. Kilka. In Scientific Bases for Sustainable Fisheries and Regional Distribution of Commercial Objects of the Caspian Sea, pp. 83-89. Ed. by V.N. Belyaeva, V.P. Ivanov and V.K. Zilanov. VNIRO Publishing, Moscow. 167p (In Russian). Solow, A.R. 1994. Detecting changes in the composition of a multispecies community. Biometrics.
50, 556-565.
Valdemarsen, J.W. 2001. Technological trends in capture fisheries. Ocean and Coastal Management, 44, 635-651.
Zuur, A., Fryer, R., Jolliffe, I., Dekker, R., and Beukema, J. 2003a. Estimating common trends in multivariate time series using dynamic factor analysis. Environmetrics. 14, 665-685.
Zuur, A.F., Tuck, I.D., and Bailey, N. 2003b. Dynamic factor analysis to estimate common trends in fisheries time series. Canadian Journal of Fisheries Aquaculture and Science. 60, 542-552.
Zuur, A.F., and Pierce, G.J. 2004. Common trends in Northeast Atlantic squid time series. Journal of Sea Research. 2, 57-72.