BIBECHANA
A Multidisciplinary Journal of Science, Technology and Mathematics ISSN 2091-0762 (Print), 2382-5340 (0nline)
Journal homepage: http://nepjol.info/index.php/BIBECHANA
Publisher: Research Council of Science and Technology, Biratnagar, Nepal
Effect of position of irregularity in concrete frame on response to
seismic forces
Md. Tariqul Islam1,Md. Samdani Azad2*, Md. Fahim Atif3 , Gazi Md. Sharfaraz Imam Azad1
1Department of Civil Engineering, Rajshahi University of Engineering & Technology (RUET).
2Department of Civil and Environmental Engineering, Faculty of Engineering, Mahidol University,
Thailand.
3Dhaka Mass Rapid Transit Development-Metro Rail Project.
*Email: [email protected]
Article history: Received 08 December, 2017; Accepted 17 December, 2017 DOI: http://dx.doi.org/10.3126/bibechana.v15i0.18718
This work is licensed under the Creative Commons CC BY-NC License. https://creativecommons.org/licenses/by-nc/4.0/
Abstract
This paper deals with the irregular profile of concrete frame building along vertical direction comprising of mass discontinuity and overhanging mass. The underlying fact of the paper is the effect of seismic force in concrete frames with different types of irregularities including mass discontinuity and overhanging mass. For each successive model, the position of overhanging mass and mass discontinuity is kept variable to make the study effective. This study delineates the vulnerable effect of mass discontinuity and overhanging mass in concrete frame buildings. To attain the nonlinear property of each element of frame, pushover analysis method along with the equivalent static force method has been adopted for the present study. UBC97 code has been used here for linear static analysis while the parameters for nonlinear static analysis are arrogated from FEMA356 and ATC40. Investigations on different frames exhibit that the location of mass discontinuity and overhanging mass can be a key matter to avoid risks due to earthquake. While considering the design of such frames which have irregularities, designer must think about the position of irregularity. Basically, vulnerability increases in case of mass discontinuity if the irregularity is in lower stories. Moreover, vulnerability increases in case of overhanging masses if the irregularity is in higher stories.
Keywords:
Concrete frame; Pushover analysis; Mass discontinuity; Overhanging mass.
1. Introduction
Most notable events of major earthquakes took place in Bangladesh since 1762 to 2015 jolted large part of the country [1]. The frequent earthquakes have made the engineering community aware of the need of seismic evaluation and retrofitting of existing structures. Recent progress in the development of new architectural forms of buildings and high strength materials coupled with more pioneering
computational methods and design procedures have led to a new generationof high-rise RC buildings
prevention of structural collapse. The failure of structure starts at points of weakness. This weakness arises due to discontinuity in mass, stiffness and geometry of structure. The structures having different discontinuities are termed as Irregular structures. Mass irregularity by reducing the mass in the upper part of the structure or by providing overhanging mass in concrete frame is commonly done in practice to meet client’s requirements or architectural requirements. This type of irregularity, which is due to asymmetric distributions of mass, is one of the most frequent sources of severe damage, since it results in floor rotations (torsion response) in addition to floor translations. Different building codes provided seismic provisions for different irregularities. The paper presents an overview of the progress in research regarding seismic response of building structures with mass discontinuity or overhanging mass in different story levels.
Stefano & Pintucchi [2] presented a review of the research on the seismic behavior of both plan and vertically irregular building structures. Tremblay and Poncet [3] examined the influence of mass irregularity for several eight-story structures with different mass discontinuity patterns. They made both the static analysis approach and dynamic analysis method for the presentation. Mass irregularity was found to have limited effects on the level of protection against structural collapse when static analysis was used. Dynamic analysis method did not seem to provide marked benefit on the response of the buildings with mass discontinuity. Nonlinear dynamic behavior of a set of five-story asymmetric buildings with different strength distribution was studied by Aziminejad and Moghadam [4] to investigate the effect of different strength distribution strategies. The results showed that for inter-story drift and plastic rotation parameters, models with lower diaphragm rotation perform better. But for the ductility demand parameter this situation is not valid. In torsionally stiff buildings, each of the models similar trends of responses was observed for Life Safety (LS) and Collapse Preventation (CP) limit states. In lower limit states such as IO, the effect of strength distribution on improvement of building performance decreases and in higher limit states such as CP, the effect of strength distribution increases. An approximate seismic analysis was presented by Georgoussis et al. [5] for multi- story setback buildings with mass and stiffness irregularities subjected to strong ground
motions. The method predicted the structural configuration of minimum torsion, which signified that
obtain the effect of mass irregularity. The aim of this research includes the effect of location of mass discontinuity and overhanging mass along vertical direction. There are some important points of this research which represents it bit different from the previous. Previous studies delineated on the analysis methods, stiffness, mass irregularities, comparison of drifts ratios. This research also deals with irregularity but the most noticeable point is their position. This paper deals with the position of mass discontinuity as well as overhanging mass. To investigate the nonlinear behavior along with the linear performance of selected frames, push over analysis is carried out. Pushover analysis has become the preferred method for performance based seismic performance evaluation of structures by the rehabilitation guidelines and codes because it is conceptually and computationally simple. Pushover analysis allows tracing the sequence of yielding and failure on member and structural level as well as the progress of overall capacity curve of the structure. The research output suggests maintaining overhanging mass in lower story and mass discontinuity in higher story according to the response of considered frames.
2. Materials and Methods
2.1 Materials
Specifications of materials used in the numerical analysis are detailed in Table 1. The loading conditions were adopted from UBC97 [9]. The interpretation was performed as per the guidelines of FEMA 356 [10]. The adopted properties of frame can be observed in Table 1 and in all frames; the beams and columns of same sizes were provided. All the properties in table are kept constant.
Table 1: Details of members used.
Members
Configuration
Beam size 30 cm *40 cm
Column size 30 cm * 30 cm
Total story 6
Bay width 5m
Story height 3 m
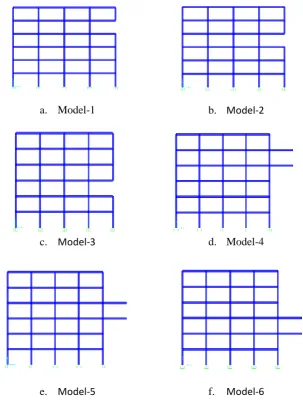
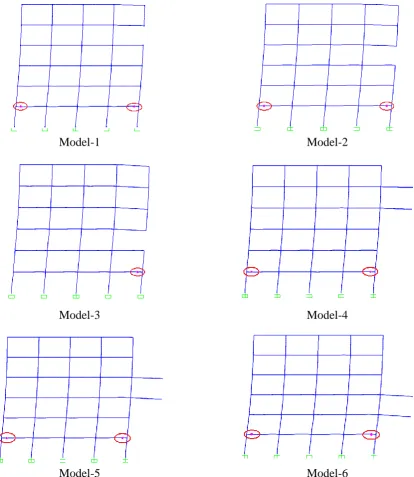
2.2 Frame types
Six concrete frames having vertical discontinuity in column and overhanging mass along height have been considered for the present study. All the considered 6 story frames are assumed to be fixed at ground level, floor to floor heights are taken as 3m and bay width is taken as 5m as described in Table 1.Constant beam and columns sizes were taken at all floors levels for each considered frame so that the numerical results can be interpreted easily, however number of columns and beams vary with respect to model. Fig. 1a (model-1) depicts the frame has vertically discontinuity after third floor. Fig. 1b (model-2) depicts a frame that has mass irregularity after second floor but has symmetry along the vertical axis. Fig. 1c (model-3) depicts a frame that has mass discontinuity at second floor. Fig. 1d
(model-4), on the other hand, depicts an overhanging mass at 5th story. Fig. 1e (model-5) depicts a
frame that has an overhanging mass at 4th story. Fig. 1f (model-6) depicts an overhanging mass at 3rd
story. It is noted that the locations of mass discontinuity and overhanging mass is variable.
2.3 Methodology
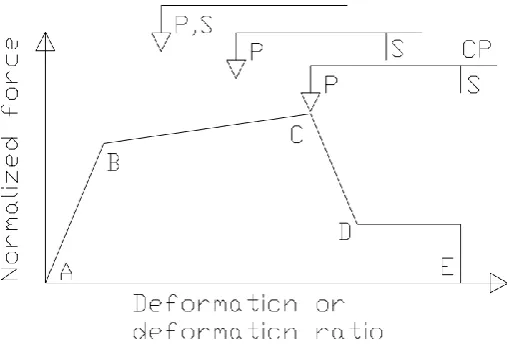
“A” represents the origin while point “B” represents the yield point. After point D, the element responds with substantially reduced strength to point E. The boundaries required for pushover analysis have been conveyed from FEMA 356 [10]. The parameters from UBC97 [9] have been listed in Table 2 while the pushover criteria is shown in Table 3.
a. Model-1 b. Model-2
c. Model-3 d. Model-4
e. Model-5 f. Model-6
Fig. 1: Selected Concrete Frames.
The Base shears which have been applied for pushover analysis was derived from the following equations.
W RT
I C
V v (1)
where, TCt(hn)3/4 (2)
The computed base shear (V) from equation (1) must be less than that calculated by equation (3) and
must be greater than that calculated by equation (4). In equation (1), Windicates the self-weight of the
frame.
W R
I C 5 . 2
V a
(3)
IW C 11 . 0
Fig. 2: Force vs. deformation/deformation ratio curve.
Reviewing the aspects adjudging pushover analysis, a number of facts are entailed to be adopted from FEMA356. The nonlinear behavior of certain structure can be assessed by dint of conjuring a nonlinear static analysis or pushover analysis. Staad.pro v8i has been utilized for pushover analysis. The assumptions through which the pushover analysis has been followed are listed below:
i) The frames are special moment resisting frames.
ii) The geometric nonlinearity with P-Δ is considered.
iii) The nonlinear hinges are presumed as per FEMA356.
iv) Deduction of the damping ratio is 5% and the site class is Sc
v) Mapped spectral acceleration factor, Fa= 1.2 and Fv=1.7
vi) Ca=0.09and Cv =0.13 was adopted as per ATC40 [11]
vii) A certain value of displacement has been entered to terminate the pushover analysis.
Both linear and nonlinear static analysis following equations (1-4) and maintaining the assumptions were also performed for each consecutive case to record the maximum deflection, story drift, capacity curve, ductility of frames, performance points.
Table-2 illustrates the seismic parameters considered in the study. Seismic Zone-I is considered for why the value of Z is taken as 0.075. The frames adopted for analysis are of special moment resisting type and
the response modification factor is taken 8.5, seismic coefficients Ca and Cv are related to soil profile Sc
and values are taken according to UBC97. Moreover, the value of near source factors are also taken from UBC97.
Table-3 describes the pushover parameters that are applied for the analysis. The values of mapped spectral
acceleration Fa and Fv are taken as per FEMA356. Site category class C as per FEMA356 and it is similar
to the soil profile type Sc as per UBC97.
Table 2: Values considered from UBC97 [9].
Parameters Values/ Standards
Zone factor, Z 0.075
Soil profile type Sc
Seismic importance factor, I 1
Response modification factor, R 8.5
Seismic coefficient, Ca 0.09
Seismic coefficient, Cv 0.13
Near-source factor, Na 1
Near-source factor, Nv 1
Table 3 Pushover parameters.
Parameter Input value/system
Frame type Moment resisting frame
Geometric Nonlinearity and P-Δ effects Included
Hinge type As per FEMA356
Damping 5%
Site category Class C
Mapped spectral acceleration, Fa 1.2
Mapped spectral acceleration, Fv 1.7
3. Analysis and Results
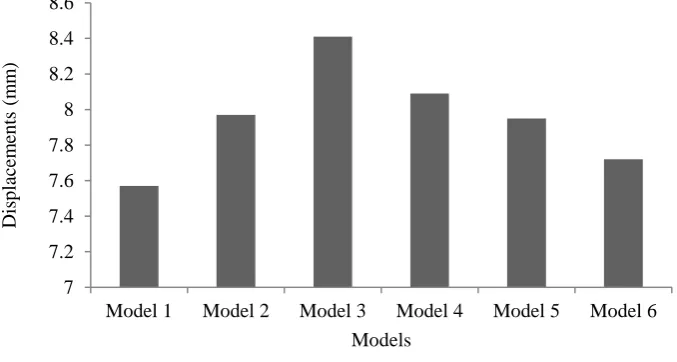
The analysis of all the frames has been carried out following UBC97 [9] and FEMA356 [10] for linear static and nonlinear static/pushover analysis sequentially. The analyses depict inherent illustrations about the behavior of the frames of this research. The main intent of the research includes the computation of displacement under linear and nonlinear analysis with observing the nonlinear hinge formation in the members. The formation of nonlinear hinges at a certain load-step defines the load capacity of the certain member/element. Fig. 3 presents the different lateral displacements of different frames obtained from linear static analysis. It can be observed that Model-3 is susceptible to largest lateral displacements due to seismic forces.
Fig. 3: Maximum roof displacements.
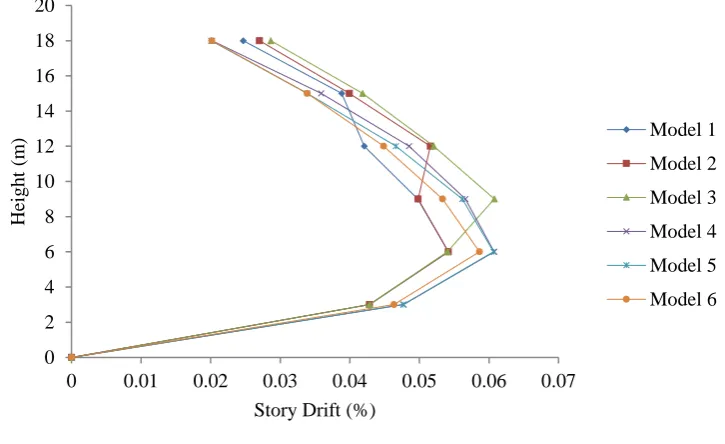
The reason behind this is that the discontinuous portion of the frame carries largest mass among Model [1-3]. On the contrary, this mass discontinuity decreases the total stiffness of the certain story level. This discontinuity decreased the stiffness of that portion of the frame. In Model-3, the mass discontinuity is in lower story level. That causes less stiffness in that story. This story carries higher loads of upper stories comparing the other two models. The second maximum displacement is observed in the Model-4. The overhanging mass is located in higher story. There is a reason behind it. If the overhanging mass is in higher story, it causes more overturning moment in the base. The effect of this extra overturning moment is added to the lateral forces and cause larger displacements. That is this graph represents a typical behavior of the frames which delineates that mass discontinuity in lower story and overhanging mass in higher story is liable to higher lateral displacements due to seismic forces. The value of lateral displacement of model-1 is around 7.58 mm which is the lowest among all the frames and highest value for model-3 is about 8.45mm. For the rest of the models this value ranges around 8mm. Fig. 4 deliberates the relation between story height and percentage of story drift ratio. It can be observed that the drift ratio at first, is increasing gradually in case of all the models and after a certain point it starts decreasing with height. But it doesn’t continue upto the peak
7 7.2 7.4 7.6 7.8 8 8.2 8.4 8.6
Model 1 Model 2 Model 3 Model 4 Model 5 Model 6
Dis
p
lace
m
en
ts
(
m
m
)
height rather it shows a different behavior in case of models-(1,2&3). For model-1, it can be noted that the drift suddenly increases at 12m to 15 m height. same issue can be observed for models (2 and 3). For model-2, the sudden increase occures at at 9m to 12m height and 6m to 9m height for model-3. Moreover, it is also subtantial that the mass discontinuity of models (1, 2 and 3) starts at 12m, 9m and 6m subssequently. The value of drift ratio abruptly changes in that story containing the mass discontinuety. Furthermore, Fig. 4 delineates one more thing. The peak story drift occurs at 6m for model (4, 5, and 6). But it is already explained that the peak drift occurs at different height for models (1, 2, and 3) which illustrates that the story drift has the dependency of mass discontinuity.
Fig. 4: Story Drift.
The location of peak story drift is same for the models with overhanging mass but not same for the models with mass discontinuity. It shifts with the change of the location of mass discontinuity. The formation of nonlinear hinges can be observed from Fig. 5. The location is same for all models and the first nonlinear hinge is generated in the beam of Level-1. But there is an important thing which should be discussed in this matter.
It is observed from Table 4 that formation of nonlinear hinge occurs at least base shear is in Model-4 while the value of base shear is highest in Model-1. There is a tendency of formation such hinges in less base shears in the models containing overhanging mass. This phenomenon depicts that the overhanging mass affects the nonlinear resistance of a frame. This effect is higher when the location of overhanging mass is in higher story levels.
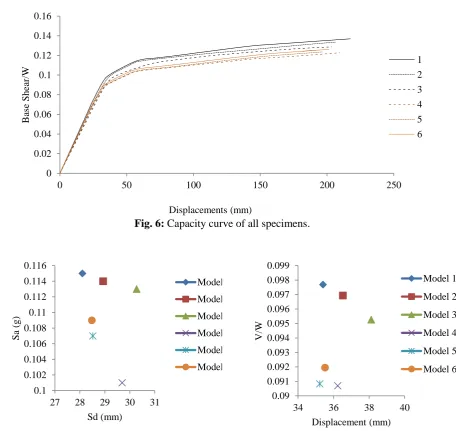
Fig. 6 depicts the capacity curve of all models. The maximum value is for the Model-1 while the minimum stands for Model-4. It is substantial from the chart that discontinuity in lower story and overhanging mass in higher story delineate less value of base shear in capacity curve.
Fig. 7 and Fig. 8 illustrate the performance points of the models as per ATC-40. Fig. 7 shows the relationship between Sa-Sd. It can be observed that Model-1 can sustain at the earthquake with maximum acceleration while Model-4 is with the minimum acceleration among these models. From the following figure, it is obtained that the maximum V/W value is for Model-1 while the minimum is for Model-4.
Table 5 depicts that the maximum value of ductility is for Model-3 and the minimum value stands for Model-6. The ductility was determined using FEMA440 [12].
0 2 4 6 8 10 12 14 16 18 20
0 0.01 0.02 0.03 0.04 0.05 0.06 0.07
Heig
h
t
(m
)
Story Drift (%)
Model 1
Model 2
Model 3
Model 4
Model 5
Model-1
Model-2
Model-3
Model-4
Model-5
Model-6
Fig. 5: Formation of hinges in beams for different models.
Table 4 Nonlinear hinge formation.
Models IO (W) LS (W) CP (W)
Model 1 0.122491 0.134992 0.140245
Model 2 0.12132 0.133516 0.138596
Model 3 0.12028 0.12871 0.132497
Model 4 0.108504 0.118185 0.123462
Model 5 0.109203 0.120828 0.127135
Fig. 6: Capacity curve of all specimens.
Fig. 7: Performance point (Sa-Sd) as per ATC40. Fig. 8 Performance point (V/W-D) as per ATC40.
Table 5: Ductility in different models.
Models Ductility
Model 1 1.33
Model 2 1.332
Model 3 1.395
Model 4 1.36
Model 5 1.34
Model 6 1.325
4. Conclusion
The numerical investigation mainly indicates that the story drift and lateral displacements has
dependency based on the pattern of vertical geometric irregularity. From the numerical evaluation, a
number of conclusions can be obtained as below: 0 0.02 0.04 0.06 0.08 0.1 0.12 0.14 0.16
0 50 100 150 200 250
B ase Sh ea r/W Displacements (mm) 1 2 3 4 5 6 0.1 0.102 0.104 0.106 0.108 0.11 0.112 0.114 0.116
27 28 29 30 31
Sa (g ) Sd (mm) Model 1 Model 2 Model 3 Model 4 Model 5 Model 6 0.09 0.091 0.092 0.093 0.094 0.095 0.096 0.097 0.098 0.099
34 36 38 40
1. Vulnerability increases if the mass discontinuity locates at the lower story and overhanging mass in the higher story.
2. Mass discontinuity has effects on the peak story drift of a frame. The story drift suddenly
increases where discontinuity of mass exists.
3. Overhanging mass doesn’t affect the peak story drift locations.
4. Overhanging mass in higher story decreases the performance point to a good extent.
From the above discussion, it is evident that determining the position of overhanging mass and mass discontinuity should be descent to ensure better performance and stiffness of multistory building frames.
References
[1] Major Earthquakes in Bangladesh (2016). The Daily Observer.
http://www.observerbd.com/2016/01/05/129456.php. Accessed 5 January 2016.
[2] M. D. Stefano and B. Pintucchi, A review of research on seismic behaviour of irregular building structures since 2002. Bull Earthquake Eng 6 (2008) 285–308. doi.org/10.1007/s10518-007-9052-3. [3] R. Tremblay and L. Poncet, Seismic Performance of Concentrically Braced Steel Frames in Multistory
Buildings with Mass Irregularity, J. Struct. Eng. 131 (2005) 1363-1375. doi.org/10.1061/(ASCE)0733-9445(2005)131:9(1363).
[4] A. Aziminejad and A.S. Moghadam, Performance of asymmetric multistory shear buildings with different strength distributions, J. Applied Sci. 9 (2009) 1082-1089.
http://dx.doi.org/10.3923/jas.2009.1082.1089.
[5] G. Georgoussisa, A. Tsompanosa and T. Makarios, Approximate seismic analysis of multi-story buildings with mass and stiffness irregularities, Procedia Engineering 125 (2015) 959 – 966. doi.org/10.1016/j.proeng.2015.11.147.
[6] C. Chintanapakdee and A.K. Chopra, Seismic response of vertically irregular frames: response history and modal pushover analyses, J. Struct. Eng.130 (2004) 1177-1185. doi.org/10.1061/(ASCE)0733-9445(2004)130:8(1177) .
[7] N. Kara N and Z. Celep, Nonlinear seismic response of structural systems having vertical irregularities due to discontinuities in columns. Proceedings of Fifteen World Conference of Earthquake Engineering (2012). http://www.iitk.ac.in/nicee/wcee/article/WCEE2012_2685.pdf .
[8] E.V. Valmundsson and J. M. Nau, Seismic response of building frames with vertical structural irregularities, J. Struct. Eng. 123 (1997) 30-41.
https://ascelibrary.org/doi/abs/10.1061/%28ASCE%290733-9445%281997%29123%3A1%2830%29 [9] Uniform Building Code 1997.
[10] FEMA 356, Prestandard and commentary for the seismic rehabilitation of buildings (2000). [11] ATC40, Seismic evaluation and retrofit of concrete buildings Vol. 1 (1996).
[12] FEMA440, Improvement of nonlinear static seismic analysis procedures, 2005.
[13] A. Prabhu T., Seismic evaluation of 4-story reinforced concrete structure by non-linear static pushover analysis, National Institute Of Technology Rourkela, 2013.
[14] S.H. Hosseini, S.A. Bakar, K. Bagherinejad and E. Hosseinpour, Pushover analysis of reinforced concrete building with vertical shear link steel braces, Malaysian Journal of Civil Engineering 27 (2015) 169-179 http://civil.utm.my/mjce/files/2015/08/Vol-27-No-2-Paper-1.pdf