R E S E A R C H
Open Access
Expression of IFITM1 as a prognostic
biomarker in resected gastric and
esophageal adenocarcinoma
David Borg
*, Charlotta Hedner, Alexander Gaber, Björn Nodin, Richard Fristedt, Karin Jirström, Jakob Eberhard
and Anders Johnsson
Abstract
Background:There is an increasing amount of reports on IFITM1 (interferon-inducible transmembrane protein 1) in various malignancies. The aim of this study was to examine the expression of IFITM1 and its prognostic significance in gastroesophageal adenocarcinoma.
Methods:Tissue samples were obtained from a consecutive cohort of 174 patients surgically treated between 2006 and 2010 for gastroesophageal (gastric, gastroesophageal junction and esophageal) adenocarcinoma, not subjected to neoadjuvant therapy. Expression of IFITM1 was examined using immunohistochemistry on tissue microarrays of primary tumors and paired samples of adjacent normal epithelium, intestinal metaplasia and lymph node metastases.
Results:Expression of IFITM1 was significantly elevated in primary tumors and lymph node metastases compared to adjacent normal epithelium and intestinal metaplasia, regardless of tumor location. Overexpression of IFITM1 was associated with M0-disease (no distant metastases). In gastric cancer IFITM1 expression was significantly associated with improved TTR (time to recurrence) in Kaplan-Meier analysis and Cox regression, both in the unadjusted analysis (HR 0.33, 95 % CI 0.12-0.88) and in the adjusted analysis (HR 0.32, 95 % CI 0.12-0.87) but there was no significant impact on OS (overall survival). In esophageal adenocarcinoma expression of IFITM1 had no impact on TTR or OS in Kaplan-Meier-analyses, but in the adjusted Cox regression IFITM1 expression had a negative impact on both TTR (HR 3.05, 95 % CI 1.09-8.53) and OS (HR 2.71, 95 % CI 1.11-6.67).
Conclusions:IFITM1 was overexpressed in gastroesophageal adenocarcinoma and associated with M0-disease. In gastric cancer IFITM1 expression had a positive impact on TTR but in esophageal cancer it seemed to have an adverse impact on survival.
The reason for the diverging prognostic impact of IFITM1 in esophageal and gastric cancer is unclear and warrants further studies.
Keywords:Esophageal neoplasms, Stomach neoplasms, Adenocarcinoma, Prognosis,IFITM1
Background
Gastroesophageal adenocarcinoma is the 5th most com-mon cancer worldwide [1]. The incidence of esophageal and GE (gastroesophageal) junction adenocarcinoma has drastically increased in many Western countries for the last four decades [2, 3]. Suggested factors to explain this increase are gastroesophageal reflux disease, obesity and decreased prevalence of Helicobacter pylori infection
[4, 5]. In contrast, the incidence of gastric adenocarcinoma has declined globally for several decades [6], possibly due to decreased prevalence of Helicobacter pylori infection and improved dietary conditions [7].
The prognosis of gastroesophageal adenocarcinoma is generally poor, at least in Western populations. For operable patients with resectable tumors recent studies have shown that the addition of neoadjuvant and/or adjuvant chemotherapy or chemoradiotherapy improves the 5-year survival rate with 10–15 % [8–11]. To fur-ther improve the overall survival in gastroesophageal * Correspondence:david.borg@med.lu.se
Department of Clinical Sciences Lund, Division of Oncology and Pathology, Lund University, Skåne University Hospital, 221 85 Lund, Sweden
adenocarcinoma, a deepened understanding of the tumor biology is required. Moreover, identification of prognostic and response predictive biomarkers is warranted to optimize and personalize the treatment strategies.
IFITM1 (interferon-inducible transmembrane protein 1), also known as 9–27, Leu-13 or CD225, is a cell surface 17-kDa membrane protein that is encoded on the short arm of chromosome 11. It is mainly known as an inhibitor of viral entry and replication [12], but it has also been associated with angiogenesis [13], inflammatory bowel disease [14] and osteogenesis [15].
There are now emerging data on IFITM1 and its role in malignancy. An upregulation of IFITM1 in different types of cancer and promotion of tumorigenesis by en-hancing tumor cell migration, invasion and proliferation has been reported in several studies [16–23] but the op-posite has also been shown [24–26]. Overexpression of IFITM1 has been reported to correlate with improved survival in glioma and chronic myeloid leukemia [17, 27] but in a South Korean study on gastric cancer, there was a trend towards worse survival in patients with high expres-sion of IFITM1 [23]. Apart from the latter study, the know-ledge on IFITM1 in gastroesophageal cancer survival is very limited, especially in Western populations. Therefore, the current study was designed to explore the expression and prognostic significance of IFITM1 in adenocarcinoma of the esophagus, GE junction and stomach in a consecu-tive cohort of patients from southern Sweden, that were treated 2006–2010, prior to the wide implementation of (neo-)adjuvant oncological treatment.
Methods
Study design and participants
The study comprises a consecutive cohort of 174 pa-tients with chemo-/radiotherapy-naive gastroesophageal (gastric, GE junction and esophageal) adenocarcinoma subjected to surgical resection at the University Hospi-tals of Lund and Malmö between January 1, 2006 and December 31, 2010. This patient cohort has been used in several previous reports on other biomarkers [28–32]. Data on survival and recurrence were updated until De-cember 31 2014. Tumor location was based on endos-copy findings. Classification of tumor stage was done according to UICC/AJCC TNM edition 7. Residual Table 1Patient and tumor characteristics
Factor Entire cohort Esophagus GE junction Stomach
(n= 174) n(%)
(n= 60) n(%)
(n= 45) n(%)
(n= 69) n(%) Age (years) Mean Median (Range) 70.2 70.0 (42.6-94.4) 67.9 66.0 (48.2-88.5) 69.9 68.7 (48.7-88.6) 72.4 73.9 (42.6-94.4) Sex Women Men 40 (23.0) 134 (77.0) 6 (10.0) 54 (90.0) 12 (26.7) 33 (73.3) 22 (31.9) 47 (68.1) T stage T1 T2 T3 T4 Unknown 19 (10.9) 32 (18.4) 93 (53.4) 27 (15.5) 3 (1.7) 9 (15.0) 10 (16.7) 34 (56.7) 6 (10.0) 1 (1.7) 3 (6.7) 4 (8.9) 33 (73.3) 4 (8.9) 1 (2.2) 7 (10.1) 18 (26.1) 26 (37.7) 17 (24.6) 1 (1.4) N stage N0 N1 N2 N3 59 (33.9) 30 (17.2) 41 (23.6) 44 (25.3) 15 (25.0) 11 (18.3) 15 (25.0) 19 (31.7) 12 (26.7) 7 (15.6) 14 (31.1) 12 (26.7) 32 (46.4) 12 (17.4) 12 (17.4) 13 (18.8)
Number of examined nodes Mean Median Range Unknown 30.3 29.0 1–112 14
36.6 33.5 10–72 2
29.7 28.0 8–48 1
24.3 22.0 1–112 11 M stage M0 M1 152 (87.4) 22 (12.6) 52 (86.7) 8 (13.3) 40 (88.9) 5 (11.1) 60 (87.0) 9 (13.0) R classification R0 R1 R2 121 (69.5) 43 (24.7) 10 (5.7) 38 (63.3) 21 (35.0) 1 (1.7) 30 (66.7) 13 (28.9) 2 (4.4) 53 (76.8) 9 (13.0) 7 (10.1) Differentiation grade High Intermediate Low 8 (4.6) 53 (30.5) 113 (64.9) 4 (6.7) 26 (43.3) 30 (50.0) 1 (2.2) 13 (28.9) 31 (68.9) 3 (4.3) 14 (20.3) 52 (75.4) Lauren classification Intestinal Mixed Diffuse 120 (69.0) 9 (5.2) 45 (25.9) 54 (90.0) 4 (6.7) 2 (3.3) 31 (68.9) 3 (6.7) 11 (24.4) 35 (50.7) 2 (2.9) 32 (46.4) Intestinal metaplasia background No Yes 101 (58.0) 73 (42.0) 37 (61.7) 23 (38.3) 34 (75.6) 11 (24.4) 30 (43.5) 39 (56.5) Adjuvant therapy No Chemoradiotherapy Chemotherapy Radiotherapy 161 (92.5) 11 (6.3) 1 (0.6) 1 (0.6) 55 (91.7) 3 (5.0) 1 (1.7) 1 (1.7) 42 (93.3) 3 (6.7) 64 (92.8) 5 (7.2) Follow-up (years) Mean Median Range 3.25 2.28 0.01-8.95 3.36 2.47 0.26-8.95 3.06 2.17 0.01-8.89 3.28 2.09 0.01-8.85
Table 1Patient and tumor characteristics(Continued)
tumor status was classified as: R0 = no residual tumor, R1 = microscopic residual tumor, R2 = macroscopic residual tumor. The vast majority of the patients were operated on with a curative intent but three patients with metastatic disease were resected to palliate symptoms from the primary tumor. In 16 patients, M1-disease (distant metastases) was revealed either during surgery or in the resected specimens. All patients had surgery up-front, without neoadjuvant oncological therapy and a minority (7.5 %) of the patients received adjuvant treatment (chemo-/radiotherapy). Clinical data, recur-rence status and vital status were obtained retrospectively
from medical records. Clinicopathological data and fol-low-up data are described in Table 1. The study was approved by the regional ethics committee at Lund Uni-versity (ref nr 445/07).
Tissue microarrays
Using a semi-automated arraying device (TMArrayer™, Pathology Devices, Westminster, MD, USA) tissue microarrays (TMAs) were constructed. From all 174 primary tumors duplicate cores (1 mm) were obtained from areas with morphologically viable cancer in different blocks. In 81 cases lymph node metastases were sampled
Table 2Associations of IFITM1 expression in primary tumors with clinicopathological data
Factor Entire cohort median
(range)
p-value Esophagus median (range)
p-value GE junction median (range)
p-value Stomach median (range) p-value Age ≤average >average 1.75 (0.00-10.50) 2.00 (0.00-12.00)
0.103 2.00 (0.00-10.50) 1.00 (0.00-7.50)
0.363 2.50 (0.00-9.80) 2.50 (0.00-12.00)
0.693 0.00 (0.00-9.00) 2.50 (0.00-12.00) 0.001 Sex Female Male 2.50 (0.00-11.00) 1.00 (0.00-12.00)
0.207 4.00 (1.00-6.50) 1.00 (0.00-10.50)
0.080 2.50 (0.00-6.50) 2.00 (0.00-12.00)
1.000 2.00 (0.00-11.00) 1.00 (0.00-12.00) 0.588 T-stage T1 T2 T3 T4 1.75 (0.00-10.00) 2.00 (0.00-12.00) 1.75 (0.00-12.00) 1.00 (0.00-12.00)
0.805 2.00 (0.00-8.00) 2.25 (0.00-7.50) 1.25 (0.00-9.80) 0.50 (0.00-7.00)
0.400 1.75 (0.00-3.50) 0.50 (0.00-4.00) 2.50 (0.00-12.00) 2.50 (2.00-8.00)
0.669 1.00 (0.00-10.00) 3.00 (0.00-12.00) 1.25 (0.00-11.00) 1.00 (0.00-12.00) 0.883 N-stage N0 N1 N2 N3 2.00 (0.00-12.00) 2.00 (0.00-12.00) 1.00 (0.00-12.00) 1.75 (0.00-10.50)
0.585 2.25 (0.00-8.00) 2.00 (0.00-6.50) 0.75 (0.00-9.80) 1.50 (0.00-10.50)
0.471 2.50 (0.00-12.00) 3.00 (0.00-11.00) 1.25 (0.00-8.00) 2.75 (0.00-9.80)
0.694 1.25 (0.00-12.00) 2.50 (0.00-12.00) 2.00 (0.00-12.00) 0.50 (0.00-6.00) 0.504 M-stage M0 M1 2.00 (0.00-12.00) 0.50 (0.00-6.50)
0.033 1.75 (0.00-10.50) 1.25 (0.00-5.50)
0.528 2.50 (0.00-12.00) 2.00 (0.00-6.50)
0.693 2.00 (0.00-12.00) 0.00 (0.00-2.00) 0.011 R-classification R0 R1 R2 2.00 (0.00-12.00) 1.00 (0.00-9.80) 0.00 (0.00-10.00)
0.055 2.00 (0.00-10.50) 1.00 (0.00-9.80) 0.00 (0.00-0.00
0.444 3.00 (0.00-12.00) 2.00 (0.00-7.00) 0.125 (0.00-0.30)
0.252 2.00 (0.00-12.00) 0.50 (0.00-4.50) 0.25 (0.00-10.00) 0.225 Differentiation grade High Intermediate Low 2.00 (0.00-3.00) 2.00 (0.00-12.00) 1.50 (0.00-12.00)
0.759 2.00 (1.00-2.00) 2.00 (0.00-10.50) 1.00 (0.00-8.00)
0.629 2.50 (2.50-2.50 1.50 (0.00-5.50) 2.50 (0.00-12.00)
0.586 0.50 (0.00-3.00) 3.00 (0.00-12.00) 1.00 (0.00-12.00) 0.324 Lauren classification Intestinal Mixed Diffuse 2.00 (0.00-12.00) 1.00 (0.00-6.50) 0.50 (0.00-12.00)
0.150 1.75 (0.00-10.50) 1.875 (0.00-6.50) 0.00 (0.00-0.00)
0.191 2.00 (0.00-12.00) 3.00 (0.00-3.00) 3.50 (0.00-12.00)
0.565 3.00 (0.00-12.00) 0.25 (0.00-0.50) 0.38 (0.00-10.00) 0.008 Intestinal metaplasia background No Yes 1.00 (0.00-12.00) 2.25 (0.00-12.00)
0.083 1.00 (0.00-10.50) 2.00 (0.00-7.00)
0.446 2.00 (0.00-12.00) 4.25 (0.00-12.00)
in duplicate cores. In addition 1–3 cores from intestinal metaplasia (gastric intestinal metaplasia or Barrett’s esophagus) were sampled in 73 cases. Single core samples from adjacent normal gastric mucosa (131 cases) and nor-mal squamous epithelium of the esophagus (96 cases) were also retrieved. All samples were paired.
Immunohistochemistry
For immunohistochemical analysis of IFITM1 expression, 4μm TMA-sections were automatically pre-treated using the PT Link system and then stained in an Autostainer Plus (DAKO; Glostrup, Copenhagen, Denmark) with the rabbit polyclonal anti-IFITM1 antibody HPA004810 (Atlas Antibodies AB, Stockholm, Sweden) diluted 1:250. The specificity of the antibody has been validated [33]. Staining was assessed by two different observers (DB and AG) blinded to clinical and outcome data. Scoring discrepancies were discussed to reach consensus. IFITM1
staining was mainly detected in the cytoplasm, with an accentuation towards the membrane. The fraction of stained tumor cells was scored as: 0 (0–1 %), 1 (2–25 %), 2 (26–50 %), 3 (51–75 %) or 4 (>75 %). Staining intensity was scored as: 0 (negative), 1 (weak), 2 (moderate) or 3 (strong). By multiplying fraction and in-tensity a combined score (0–12) was constructed.
Statistical analysis
The Mann–Whitney U test was applied to compare the distribution of IFITM1 expression in different tissues (Fig. 2) and also to describe the relationship between IFITM1 expression and clinicopathological factors (Table 2). Time to recurrence (TTR) was defined as time from date of surgery to date of biopsy or radiology proven recurrent disease. Overall survival (OS) was defined as time from date of surgery to date of death. TTR and OS were analysed for resected M0-patients with no macroscopic residual tumor
Table 3Hazard ratios for recurrence and death M0 R0-1
Time to recurrence
Unadjusted Adjusteda
n (events) HR (95 % CI) p-value HR (95 % CI) p-value
Esophagus
IFITM1
Low High
23 (13) 16 (9)
1.00 1.09 (0.47-2.56)
0.836 1.00
3.05 (1.09-8.53)
0.034
GE junction
IFITM1
Low High
16 (10) 17 (10)
1.00 1.09 (0.45-2.62)
0.852 1.00
1.50 (0.59-3.82)
0.400
Stomach
IFITM1
Low High
30 (19) 20 (5)
1.00 0.33 (0.12-0.88)
0.026 1.00
0.32 (0.12-0.87)
0.026
Overall survival
Unadjusted Adjustedb
n (events) HR (95 % CI) p-value HR (95 % CI) p-value
Esophagus
IFITM1
Low High
31 (20) 18 (11)
1.00 0.99 (0.47-2.07)
0.976 1.00
2.71 (1.11-6.67)
0.029
GE junction
IFITM1
Low High
19 (15) 19 (16)
1.00 1.00 (0.49-2.03)
0.995 1.00
0.97 (0.44-2.15)
0.937
Stomach
IFITM1
Low High
32 (22) 24 (15)
1.00 0.83 (0.43-1.62)
0.592 1.00
0.80 (0.39-1.64)
0.539
a
Adjusted for: T-stage, N-stage, R-classification
b
(R0-1). To determine the optimal prognostic cut-off for IFITM1 expression in the primary tumors, ROC-curves were used. Differences in Kaplan-Meier survival curves were calculated by log-rank test (Fig. 3). Unadjusted and adjusted hazard ratios for survival were determined using Cox proportional-hazards regression (Table 3). The adjusted model for TTR included T-stage, N-stage and R-classification. For OS, the adjusted model included age, T-stage, N-T-stage, R-classification and differentiation grade. All tests were 2-sided and ap-value <0.05 was considered significant. IBM® SPSS® Statistics version 22.0.0.1 for Mac was used for all statistical analyses.
Results
Expression of IFITM1 in normal epithelium, intestinal metaplasia, primary tumors and lymph node metastases
Immunohistochemical expression of IFITM1 could be assessed in 91/96 (95 %) samples with esophageal
squamous epithelium, 122/131 (93 %) samples with gastric mucosa, 56/73 (77 %) samples with intestinal metaplasia (gastric intestinal metaplasia or Barrett’s esophagus), 169/174 (97 %) samples with primary tumors, and 77/81 (95 %) samples with lymph node metastases. Sample images are shown in Fig. 1. The distribution of im-munohistochemical expression of IFITM1 in the different tissue types is shown in Fig. 2. Expression of IFITM1 was significantly elevated in primary tumors and lymph node metastases compared to adjacent normal epithelium and intestinal metaplasia (Fig. 2). There were no significant differences of IFITM1 expression in primary tumors grouped by tumor location (Table 2).
Associations of IFITM1 expression in primary tumors with clinicopathological data
Table 2 describes the expression of IFITM1 in primary tumors in relationship to clinicopathological data for the entire cohort and for the separate tumor locations. In the entire cohort, IFITM1 was significantly elevated in
M0-disease, most notably in gastric cancer. There was a trend towards higher IFITM1 expression in primary tu-mors with a background of intestinal metaplasia. In the subset of gastric tumors there were significant associa-tions of high IFITM1 expression with age and Lauren’s intestinal type, respectively.
Impact of IFITM1 expression on survival
Survival analyses were performed on patients with M0-disease and no macroscopic residual tumor (R0-1). Using ROC-curves, both for the separate primary tumor loca-tions and for the entire cohort and with regard to TTR as well as OS, an optimal cut-off at 3 (IFITM1 low < 3, IFITM1 high 3–12) was identified and subsequently used for both TTR and OS, irrespectively of tumor location. In esophageal adenocarcinoma, expression of IFITM1 had no impact on TTR and OS in the Kaplan-Meier-analyses (Fig. 3a, d), but in the adjusted Cox regression analyses (Table 3 and Additional file 1: Table S1)) high IFITM1 ex-pression had a negative impact on both TTR (HR 3.05, 95 % CI 1.09-8.53, p= 0.034) and OS (HR 2.71, 95 % CI 1.11-6.67, p= 0.029). IFITM1 expression in GE junction tumors did not correlate with TTR or OS in neither Kaplan-Meier (Fig. 3b, e) nor Cox regression analyses (Table 3 and Additional file 1: Table S2). In gastric cancer, high IFITM1 expression was significantly associated with improved TTR in the Kaplan-Meier analyses (Fig. 3c, f ) and Cox regression (Table 3 and Additional file 1:
Table S3), both in the unadjusted analysis (HR 0.33, 95 % CI 0.12-0.88, p= 0.026) and in the adjusted analysis (HR 0.32, 95 % CI 0.12-0.87, p= 0.026) but there was no significant impact on OS.
Of note, considering the association of high IFITM1 with Lauren’s intestinal type in gastric cancer (Table 2), we also tested to replace IFITM1 with Lauren classifica-tion in the adjusted Cox regression model but the hazard ratio of Lauren classification for TTR was not significant (data not shown) and when we added Lauren classification to the model with IFITM1 the hazard ratio of IFITM1 on TTR remained significant (data not shown). Thus, we do not believe that IFITM1 is just a marker for Lauren’s in-testinal type.
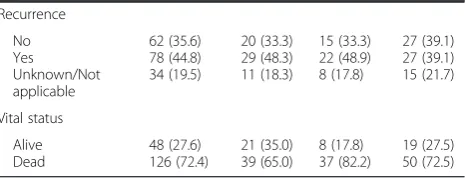
Of the 78 patients that developed recurrent disease dur-ing the follow-up period, 36 patients received palliative treatment with chemotherapy and/or radiotherapy. To what extent palliative therapy may have affected the out-come is unclear, but due to a considerable heterogeneity re-garding treatment type, doses and duration as well as to avoid selection bias (patients offered active palliative treat-ment usually have better performance status and prognosis) we decided not to include palliative oncological treatment after recurrence as a variable in the survival analyses.
Discussion
compared to adjacent normal epithelium. This finding is in accordance with other reports on IFITM1 in gastric and colorectal adenocarcinoma [23, 34, 35]. The associ-ation of high IFITM1 expression and M0-disease, par-ticularly seen in gastric cancer, has to our knowledge not been described previously.
In gastric cancer with high expression of IFITM1, we have demonstrated consistent findings of a beneficial ef-fect on TTR. However, we could not demonstrate any significant relationship between IFITM1 and OS in gas-tric cancer, and one possible explanation for this could be the older age in these patients. It has previously been suggested that IFITM1 may have an adverse impact on OS in gastric cancer [23] but, even though our data on OS were non-significant, the association of elevated IFITM1 with M0-disease and the favorable impact on TTR implies that high expression of IFITM1 could ra-ther be a positive prognostic factor in gastric cancer. It may seem like a paradox that the overexpression of IFITM1 in gastric cancer, which in other malignancies has been shown to promote tumorigenesis, was associ-ated with M0-disease and a favorable TTR. A possible explanation might be that gastric tumorigenesis associ-ated with elevassoci-ated IFITM1 confers a less malignant
phenotype. Support for this is the observed association of high IFITM1 expression and the prognostically favor-able Lauren’s intestinal type demonstrated both in this study and by others [23]. A similar contradiction has been described in glioma cells where knockdown of IFITM1 was demonstrated to inhibit proliferation, mi-gration and invasion [17, 18], whereas reduced expres-sion of IFITM1 correlated with shorter survival in a cohort of 30 glioma patients [17].
The proposed negative impact of IFITM1 on TTR and OS in esophageal adenocarcinoma has to be interpreted with caution since it was only demonstrated in the ad-justed Cox regression analysis. However, if true, this would suggest the involvement of a different tumori-genic pathway than in gastric cancer. Esophageal and gastric cancers are indeed different malignancies, with diverging incidence trends and different risk factors. For instance,Helicobacter pylori infection is associated with gastric cancer [7] but may be a protective factor for esophageal cancer [5].
The exact function of IFITM1 in malignancy is poorly understood and its role might differ depending on tumor cell type and context. IFITM1 has been demonstrated to promote malignant progression in gastric cancer cells by Fig. 3Kaplan-Meier plots of time to recurrence and overall survival according to IFITM1 expression in patients with M0-disease and no macroscopic residual tumor (R0-1). Time to recurrence inaesophageal cancer,bGE junction cancer, andcgastric cancer. Overall survival indesophageal cancer,
increasing invasion and migration and by suppressing natural killer cell activity [23, 35]. It has been shown that IFITM1 expression is regulated by DNA methylation of its promoter region [23]. Furthermore, expression of a transcript of CDH1 (E-cadherin) intron 2 (CDH1a) has been shown to increase gastric cancer cell invasion and angiogenesis and this increase correlated with IFITM1 expression [36]. The downstream effectors of IFITM1 on tumorigenesis are largely unknown but one possible mechanism of promoting invasion could be the upregu-lation of matrix metalloproteinases [20].
An association between high IFITM1 expression and sensitivity to cisplatin has been described in esophageal squamous cell carcinoma [37] whereas in gastric cancer, overexpression of IFITM1 may confer resistance to cis-platin [38]. Thus, future studies, on patient cohorts treated with neoadjuvant or palliative chemotherapy, would be of interest to further assess the possible role of IFITM1 as a predictive biomarker for response to platinum-based chemotherapy.
A limitation of our study is the retrospective design. However, all available surgically resected tumors were included consecutively, which decreases the risk of se-lection bias, and all clinical and histopathological data have been thoroughly re-examined. Another possible limitation is the use of the TMA technique, but since du-plicate cores were obtained from different donor blocks, the risk of sampling bias should be low. Moreover, analyz-ing the data grouped by tumor location reduces the sam-ple size and number of events and thus limits the possibility to adjust for multiple possible confounders in the Cox regression analyses. Due to the exploratory nature of the study, our results should mainly be regarded as hypothesis-generating, providing a basis for further ex-ploration of IFITM1 as a biomarker in gastroesophageal adenocarcinoma.
Conclusion
In summary, we have shown that the immunohistochemi-cal expression of IFITM1 was elevated in gastroesophageal adenocarcinoma and that it was associated with M0-disease. In gastric cancer, IFITM1 had a positive impact on TTR, whereas in esophageal cancer, data indicates an adverse impact on survival, suggesting that the role of IFITM1 may differ depending on the tumorigenic path-way. The mechanistic basis for this observation merits further study, and validatory studies on tumors from additional patient cohorts are warranted.
Ethics approval
The study was approved by the regional ethics committee at Lund University (ref nr 445/07), whereby the com-mittee waived the need for consent other than by the option to opt out.
Additional file
Additional file 1: Table S1-S3.Hazard ratios for recurrence and death. Detailed Cox proportional-hazards regression for esophageal, GE junction and gastric adenocarcinoma. (DOCX 29 kb)
Abbreviations
CI:confidence interval; GE: gastroesophageal; HR: hazard ratio;
IFITM1: interferon-inducible transmembrane protein 1; OS: overall survival; ROC: receiver operating characteristic; TMA: tissue microarray; TTR: time to recurrence.
Competing interests
The authors declare that they have no competing interests.
Authors’contributions
DB evaluated the immunohistochemical stainings, re-examined clinicopathological data, updated survival data, performed the statistical analyses and drafted the manuscript. CH collected and re-examined clinicopathological data and assisted with TMA construction. AG evaluated the immunohistochemical stainings and assisted with the statistical analysis. BN constructed the TMA and performed the IHC stainings. RF contributed with intellectual input. KJ, JE and AJ conceived of the study. All authors read and approved the final manuscript.
Funding
This study was supported by grants from the Knut and Alice Wallenberg Foundation, the Swedish Cancer Society, the Crafoord Foundation, the Olle Engkvist Foundation, Anna Lisa and Sven-Eric Lundgren's Foundation, Lund University Faculty of Medicine and Skåne University Hospital Funds and Donations.
Received: 9 February 2016 Accepted: 4 May 2016
References
1. Ferlay J, Soerjomataram I, Ervik M, Dikshit R, Eser S, Mathers C, et al. GLOBOCAN 2012 v1.0, Cancer Incidence and Mortality Worldwide: IARC CancerBase No. 11 [Internet]. Lyon, France. 2013. Available from: http://globocan.iarc.fr. Accessed 08 Feb 2016.
2. Edgren G, Adami H-O, Weiderpass E, Nyrén O. A global assessment of the oesophageal adenocarcinoma epidemic. Gut. 2013;62:1406–14.
3. Buas MF, Vaughan TL. Epidemiology and Risk Factors for Gastroesophageal Junction Tumors: Understanding the Rising Incidence of This Disease. Semin Radiat Oncol. 2013;23(1):3–9.
4. Carr JS, Zafar SF, Saba N, Khuri FR, El-Rayes BF. Risk Factors for Rising Incidence of Esophageal and Gastric Cardia Adenocarcinoma. J Gastrointest Cancer. 2013;44(2):143–51.
5. Nie S, Chen T, Yang X, Huai P, Lu M. Association ofHelicobacter pylori
infection with esophageal adenocarcinoma and squamous cell carcinoma: a meta-analysis. Dis Esophagus. 2014;27(7):645–53.
6. Ferro A, Peleteiro B, Malvezzi M, Bosetti C, Bertuccio P, Levi F, et al. Worldwide trends in gastric cancer mortality (1980–2011), with predictions to 2015, and incidence by subtype. Eur J Cancer. 2014;50(7):1330–44. 7. Fuccio L, Eusebi L, Bazzoli F. Gastric cancer,helicobacter pyloriinfection and
other risk factors. World J Gastrointest Oncol. 2010;2(9):342.
8. Smalley SR, Benedetti JK, Haller DG, Hundahl SA, Estes NC, Ajani JA, et al. Updated Analysis of SWOG-Directed Intergroup Study 0116: A Phase III Trial of Adjuvant Radiochemotherapy Versus Observation After Curative Gastric Cancer Resection. J Clin Oncol. 2012;30(19):2327–33.
9. Cunningham D, Allum WH, Stenning SP, Thompson JN, Van de Velde CJ, Nicolson M, et al. Perioperative chemotherapy versus surgery alone for resectable gastroesophageal cancer. N Engl J Med. 2006;355(1):11–20. 10. Van Hagen P, Hulshof M, van Lanschot JJB, Steyerberg EW, van Berge
Henegouwen M, Wijnhoven BPL, et al. Preoperative chemoradiotherapy for esophageal or junctional cancer. N Engl J Med. 2012;366(22):2074–84. 11. Noh SH, Park SR, Yang H-K, Chung HC, Chung I-J, Kim S-W, et al. Adjuvant
12. Perreira JM, Chin CR, Feeley EM, Brass AL. IFITMs restrict the replication of multiple pathogenic viruses. J Mol Biol. 2013;425(24):4937–55.
13. Popson SA, Ziegler ME, Chen X, Holderfield MT, Shaaban CI, Fong AH, et al. Interferon-Induced Transmembrane Protein 1 Regulates Endothelial Lumen Formation During Angiogenesis. Arterioscler Thromb Vasc Biol. 2014;34(5):1011–9.
14. Harris RA, Nagy-Szakal D, Mir SA, Frank E, Szigeti R, Kaplan JL, et al. DNA methylation-associated colonic mucosal immune and defense responses in treatment-naïve pediatric ulcerative colitis. Epigenetics. 2014;9(8):1131–7. 15. Kim B-S, Kim H-J, Kim JS, You Y-O, Zadeh H, Shin H-I, et al. IFITM1 increases
osteogenesis through Runx2 in human alveolar-derived bone marrow stromal cells. Bone. 2012;51(3):506–14.
16. Andreu P, Colnot S, Godard C, Laurent-Puig P, Lamarque D, Kahn A, et al. Identification of the IFITM Family as a New Molecular Marker in Human Colorectal Tumors. Cancer Res. 2006;66(4):1949–55.
17. Balbous A, Cortes U, Guilloteau K, Villalva C, Flamant S, Gaillard A, et al. A mesenchymal glioma stem cell profile is related to clinical outcome. Oncogenesis. 2014;3(3):e91.
18. Yu F, Ng SSM, Chow BKC, Sze J, Lu G, Poon WS, et al. Knockdown of interferon-induced transmembrane protein 1 (IFITM1) inhibits proliferation, migration, and invasion of glioma cells. J Neurooncol. 2011;103(2):187–95. 19. Choi HJ, Lui A, Ogony J, Jan R, Sims PJ, Lewis-Wambi J. Targeting interferon
response genes sensitizes aromatase inhibitor resistant breast cancer cells to estrogen-induced cell death. Breast Cancer Res. 2015;17(1):6. 20. Hatano H, Kudo Y, Ogawa I, Tsunematsu T, Kikuchi A, Abiko Y, et al.
IFN-Induced Transmembrane Protein 1 Promotes Invasion at Early Stage of Head and Neck Cancer Progression. Clin Cancer Res. 2008;14(19):6097–105. 21. Kim N, Sung H, Choi E, Lyu D, Choi H, Ju W, et al. Aberrant DNA methylation in
the IFITM1 promoter enhances the metastatic phenotype in an intraperitoneal xenograft model of human ovarian cancer. Oncol Rep. 2014;31(5):2139–46. 22. Chattopadhyay I, Phukan R, Singh A, Vasudevan M, Purkayastha J, Hewitt S,
et al. Molecular profiling to identify molecular mechanism in esophageal cancer with familial clustering. Oncol Rep. 2009;21(5):1135–46.
23. Lee J, Goh S-H, Song N, Hwang J-A, Nam S, Choi IJ, et al. Overexpression of IFITM1 Has Clinicopathologic Effects on Gastric Cancer and Is Regulated by an Epigenetic Mechanism. Am J Pathol. 2012;181(1):43–52.
24. Pan Z, Chen S, Pan X, Wang Z, Han H, Zheng W, et al. Differential gene expression identified in Uigur women cervical squamous cell carcinoma by suppression subtractive hybridization. Neoplasma. 2010;57(2):123–8. 25. Yang G, Xu Y, Chen X, Hu G. IFITM1 plays an essential role in the
antiproliferative action of interferon-γ. Oncogene. 2007;26(4):594–603. 26. Huang H, Colella S, Kurrer M, Yonekawa Y, Kleihues P, Ohgaki H. Gene expression profiling of low-grade diffuse astrocytomas by cDNA arrays. Cancer Res. 2000;60(24):6868–74.
27. Akyerli CB, Beksac M, Holko M, Frevel M, Dalva K, Özbek U, et al. Expression of IFITM1 in chronic myeloid leukemia patients. Leuk Res. 2005;29(3):283–6. 28. Fristedt R, Gaber A, Hedner C, Nodin B, Uhlén M, Eberhard J, et al. Expression
and prognostic significance of the polymeric immunoglobulin receptor in esophageal and gastric adenocarcinoma. J Transl Med. 2014;12(1):83. 29. Jonsson L, Hedner C, Gaber A, Korkocic D, Nodin B, Uhlén M, et al. High
expression of RNA-binding motif protein 3 in esophageal and gastric adenocarcinoma correlates with intestinal metaplasia-associated tumours and independently predicts a reduced risk of recurrence and death. Biomark Res. 2014;2:11.
30. Hedner C, Gaber A, Korkocic D, Nodin B, Uhlén M, Kuteeva E, et al. SATB1 is an independent prognostic factor in radically resected upper
gastrointestinal tract adenocarcinoma. Virchows Arch. 2014;465(6):649–59. 31. Hedner C, Tran L, Borg D, Nodin B, Jirström K, Eberhard J. Discordant HER2 overexpression in primary and metastatic upper gastrointestinal adenocarcinoma signifies poor prognosis. Histopathology. 2016;68(2):230–40. 32. Hedner C, Borg D, Nodin B, Karnevi E, Jirström K, Eberhard J. Expression and
Prognostic Significance of Human Epidermal Growth Factor Receptors 1 and 3 in Gastric and Esophageal Adenocarcinoma. PLoS One. 2016;11(2):e0148101. 33. The Human Protein Atlas [Internet]. Available from: http://www.proteinatlas.
org/ENSG00000185885-IFITM1/antibody. Accessed 08 Feb 2016 34. Kitahara O, Furukawa Y, Tanaka T, Kihara C, Ono K, Yanagawa R, et al.
Alterations of Gene Expression during Colorectal Carcinogenesis Revealed by cDNA Microarrays after Laser-Capture Microdissection of Tumor Tissues and Normal Epithelia. Cancer Res. 2001;61:3544–9.
35. Yang Y, Lee J-H, Yong Kim K, Keun Song H, Kwang Kim J, Ran Yoon S, et al. The interferon-inducible 9–27 gene modulates the susceptibility to natural
killer cells and the invasiveness of gastric cancer cells. Cancer Lett. 2005; 221(2):191–200.
36. Pinheiro H, Carvalho J, Oliveira P, Ferreira D, Pinto MT, Osorio H, et al. Transcription initiation arising from E-cadherin/CDH1 intron2: a novel protein isoform that increases gastric cancer cell invasion and angiogenesis. Hum Mol Genet. 2012;21(19):4253–69.
37. Fumoto S, Shimokuni T, Tanimoto K, Hiyama K, Otani K, Ohtaki M, et al. Selection of a novel drug-response predictor in esophageal cancer: a novel screening method using microarray and identification of IFITM1 as a potent marker gene of CDDP response. Int J Oncol. 2008;32(2):413–23.
38. Lee H, No HK, Ryu CJ, Park H-J. Brahma-related gene 1-associated expression of 9–27 and IFI-27 is involved in acquired cisplatin resistance of gastric cancer cells. Mol Med Rep. 2013;8:747–50.
• We accept pre-submission inquiries
• Our selector tool helps you to find the most relevant journal
• We provide round the clock customer support
• Convenient online submission
• Thorough peer review
• Inclusion in PubMed and all major indexing services
• Maximum visibility for your research
Submit your manuscript at www.biomedcentral.com/submit