Journal of Humanities Insights 2(1): 21-25, 2018
Research Paper
Quality Circle and its Roles in Industry and Services
Ali Ahmadzadeha *, Mahtab Rahimisadrb, Mohammad Reza Jamshidian Tehranic aDepartment of Management, Payame Noor University ShirazBranch, Iran
bDepartment of Industrial Management, Islamic Azad University Shiraz Branch, Iran cDepartment of Management, Islamic Azad University Bafgh Branch, Iran
Received: 10 January 2018 Accepted: 16 February 2018 Published: 26 March 2018
Abstract
Quality Circle (QC) proponents suggest a wide array of positive results when this participation technique is used either in manufacturing or in service sector. This study is to determine whether QCs in one sector are performing more effectively than the other. This assessment includes technical aspects, length of participation, training, members’ feelings about QCs, job satisfaction and job commitment. The study illustrates the impacts of participation on 109 QCs members from five Malaysian companies participated in a survey. Results showed that Industrial QCs members were more enthusiastic than service QCs members in terms of involvement in QCs activities and showed higher job satisfaction and job commitment compared to members in service organizations.
Keywords: Quality Circle, Business Process, Job Commitment, Continuous Improvement Processes
How to cite the article:
I. Hamdan, Quality Circle and its Roles in Industry and Services, J. Hum. Ins. 2018; 2(1): 21-25, DOI: 10.22034/jhi.2018.61426
©2018 The Authors. This is an open access article under the CC By license
1. Introduction
Several factors play major roles in the current world industry’s search for improved quality and productivity. In the product sector of the economy, international competitive pressures and demands for higher quality are currently the major forces affecting management's search for greater efficiency. In the service sector, high cost, decreasing profit margins, inconsistent quality of delivery and competitors in local markets are the primary forces of change. These factors have encouraged many organizations to focus on ways to increase the contribution of employees to improvements in quality and productivity [1]. In tracing the development of Quality Circles in the various countries, which have them, it is usually found that they are first introduced into direct manufacturing areas. Then as the benefits are publicized and expertise and confidence built up, they branch out into staff and indirect areas and finally into service-type environments. Hence, this paper is to find out whether QCs in service sector are performing as effective as manufacturing counterparts do.
Other authors have also indicated that the concept of QCs revolves around the principles of voluntary participation and collaborative decision making [1]. In a few words, the QC group has to function effectively as a multi-disciplinary team, focusing on improving selected work processes. The outcome is usually to aid continuous quality improvement. The concept seems simple and it is, but the implementation and the effort needed to keep the circles functioning effectively require strong support and commitment from management [2]. Several studies have been conducted that identify difficulties and the complexity of achieving QCs successes in service area.
22 | J . H u m . I n s . 2 0 1 8 ; 2 ( 1 ) : 2 1 - 2 5 Quality Circles programs with service workers. It is possible, of course, that some of these same characteristics could facilitate the performance of QC's. How to effectively turn what many see as barriers into positive factors that would contribute to QC success is still not known [3].
[4] pointed out that utilizing QCs in service work brings positive implications. However, service circles require a more tailed approach considering the complexities of its use and application. Even though there are time and installation costs involved in setting up service circles, the improvement in productivity of white collar circles far outweigh that of the blue-collar circles. Bank of America also noted that a drastic improvement in productivity and increased morale through QCs. In addition, [5] pointed out that there may be gains in productivity and quality through Quality Circles as this concept has not been widely implemented in the rapidly growing and dynamic service work. Quality Circles in service organizations are more challenging and complex than that in the manufacturing organizations [6]. The authors also pointed out that service sector circle programmes appear to face additional difficulties to those in manufacturing, such as the intangible nature of many circle projects, circle members finding the time to meet, organizational instability and a need to form multidiscipline circles because of the small number of people employed in many service departments/sections. Nevertheless, the authors stated that service organizations should not be discouraged to implement service circles in their organizations. Instead, service industries should always realize the complexities arising due to the labour-intensive nature of service organizations. Hence, this paper is to find out whether QCs in service sector are performing as effective as manufacturing counterparts do.
2. Methods and Results
A questionnaire, with a majority of the questions being of the close-ended type. After having been slightly modified, was mailed to a sample of five companies in Malaysia as of Dec 2003. The most senior persons with explicit responsibility for quality QCs were requested to distribute the questionnaires to QCs members and workers who are not involved in QC program answer the questionnaire in their companies. Follow up calls were made to these companies. After one-month duration, one hundred and thirty (130) questionnaires out of 300 were returned.
Responses for the questionnaire were gathered from two groups. The first group consisted of
members of QCs in manufacturing companies. The second group of respondents was members of QCs in service organizations.
2.1 Survey Sample and Size
The questionnaires were mailed to companies. Initially, it was decided that quantity of questionnaires booklets would be sent to the selected companies depending on the size and the number of Quality Circles in the companies. Selection of companies to participate in this study was made according to the list provided by the NPC (National Productivity Cooperation). From NPC’s list, seventeen companies within Klang Valley that participated in QCC National Convention 2003 were selected.
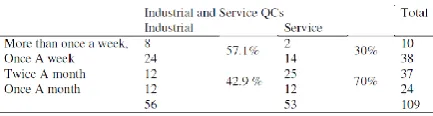
Table 1: How Often Does the Circle Meet? Cross-tabulation of Industrial and Service QCs
Table 2: The Difference of Time Involvement between Industrial and Service QCs
Table 3: How Often Do QCs Members Like the Circle to Meet? Cross-tabulation of Industrial and Service
Organizations
Table 4: The Difference of Members’ Opinions about How Often They Like to Meet in Industrial and Service
QCs
J . H u m . I n s . 2 0 1 8 ; 2 ( 1 ) : 2 1 - 2 5|23
Table 6: ANOVA of How Long have Members Participated in QCs
Table 7: Level of Training Received Before and After Joining in Industrial and Service QCs
2.2 Structure of Questionnaire
The questionnaires were designed to examine the level of training received, the purpose of QCs participation, the success contributors, suggestions, communication, leadership, job satisfaction, job commitment and intention to quit. The questionnaires used in this study are based on similar questionnaires used by Crocker (1984) in her study on Employee Involvement Program at the Windsor and Essex Engine Plants of the Ford Motor Company in the United States of America. The questionnaire was the best questionnaire, but was modified to meet the objectives of this study. The questionnaire was also selected because it captured workers’ beliefs about what they experienced through QCs participation by encompassing essential technical aspects of Quality Circle, its processes, organization and employee contribution effectiveness and employee feeling about QCs. The questionnaires were divided into 5 parts. The parts were as follows:
Part I: Technical aspects of Quality Circles
Part II: Quality Circle process
Part III: Effectiveness of organization and employee contribution to the Quality Circle
Part IV: Quality Circle and organization
Part V: Background of the respondents
2.3 Data Collection and Analysis
The data collected from the questionnaires were analyzed. The analytical tools used such as Bivariate Correlations and one-way ANOVA, which are very powerful tools to build statistical relationship between variables are also used in this study. One way ANOVA was done to compare the attitude of the two groups of employees, The ANOVA was done to determine if there was a significant difference in attitude towards the organization in
which the two groups worked. Three broad areas were tested between the two groups. This was done by creating three new
variables. The three new variables were;
* The company is a good place to work,
* Job commitment and willingness expand work effort and
* Intention to quit.
In arriving at these three variables of interests, the variables of Part IV of the questionnaire were grouped together to form the new variables.
3. Results and Discussion
The general aim of the analysis is to compare Quality Circle programs in industrial and service sectors. This is to determine whether QCs in one sector are performing more effectively than the other. This assessment includes technical aspects, length of participation, training, members’ feelings about QCs, job satisfaction and job commitment Technical Aspects: QC members in both sectors were asked how often they hold QC meetings. This is to determine a level of employee involvement in terms of discussing activities and projects during meetings. Tables 1 and 2 show that there is a significant difference (F= 4.992) between the two groups. While 57.1 % of QCs conducted meeting once or more in a week in industrial organizations, about 70% of QC meetings took place once or twice a month. This result points out that more involvement by QC members was found in industrial sector than service counterparts. It can be seen from Tables 3 and 4, that although the trend in service QCs was to conduct QC meetings once or twice a month, 54 % of them were keen to have weekly meetings. Again, a little far from industrial QC members who 75 % of them were willing to have their meetings once or more than a week. This leads to the clear understanding of the significant difference in both groups (F= 6.7) towards time involvement in QC activities.
3.1 Length of Participation
24 | J . H u m . I n s . 2 0 1 8 ; 2 ( 1 ) : 2 1 - 2 5 program, albeit they can quickly lose interest if it turns out not to be as successful as envisaged at the outset.
The study here divided the length of employee participation to two major periods; one to two years, which is considered as short-term participation and more than 3 years, which comparatively indicates longterm participation.
It is shown in Table 5 about 66 % of service QC members participated in the program for more than three years, which is considered as long term, whereas only 32 % of industrial QC members had relatively the same experience. This indicates that QC members in service sector are not new to QCs and have more experiences in the success or failure of QCs than industrial QC members have. Oneway ANOVA test in Table 6 also confirms the significant difference between the two groups.
3.2 Training
Although manufacturing problems that QCs were formed to tackle are different, to some extent, from those in service organizations, the QC tools and techniques are the same in both sectors. Members in both groups were asked to rate their level of training received before and after joining the QCs. From Table 7, it can be seen that the respondents all agreed that their QC problem solving tools and techniques have fairly improved.
Member Feelings About QCs:The general feeling of the members towards QC is to some extent, positive. This is indicated by how strongly the members agree to the positive statements regarding QCs. The variability response is shown by the standard deviation for the various statements. The result of the analysis is shown in Table 8.
Unlike QCs in industrial organizations, QCs in service areas strongly agreed that their circles have made a worthwhile contribution to their organizations, which also profited financially from their circles’ efforts. Also, they show significantly different responses on how strongly they both agree that communication with supervisors (F= 11.59) and their relationship with work group became better than before (F= 9.54). In general, nonetheless, they have positive feelings towards QCs program.
3.3 Job Satisfaction, Job Commitment and Willingness to Expand Effort
This part of the analysis tries to find out changes in attitude brought about through participation in QCs. A comparison was made between Industrial QC members and Service QC members. Both were asked to indicate their feelings in two broad areas
namely how good the company is as a place to work (job satisfaction) and job commitment and willingness of workers to expand their effort. One-way ANOVA analysis was performed to determine the significant difference between the two groups towards commitment to organizational goals and values. The result of the results is shown in Table 9. The results from the table indicates that Industrial QC members are fairly satisfied with their job as they agree that the company is a good place to work (mean =3.8988). The industrial QC members also show strong willingness to expand their efforts to achieve organizational goals and job commitment (mean = 4.0417). The results indicate that the dispersion or standard deviation is small for item good place to work (S.D. = 0.58576) and job commitment and willingness to expand effort (S.D. = 0.51272). This indicates there is lower variability in the responses among Industrial QC members. The results of Table 9, also shows that Service QC members are a bit less satisfied than industrial QCs in their jobs as they do not strongly agree that their company is a good place to work (mean = 3.7484). These Service QCs are also less willing to expand their effort and accept organizational values (mean = 3.7358). The results also indicate that standard deviation is small for item good place to work (S.D. = 0.56199) and even smaller in job commitment and willingness to expand effort (S.D. = 0.50366). Finally, the results of Table 9 indicates that Industrial QC members and Service QCs members are significantly different in their job commitment and willingness to expand effort (F=9.855). However, there is no significant difference between the two groups’ perceptions of their companies as a good place to work (F=1.867).
J . H u m . I n s . 2 0 1 8 ; 2 ( 1 ) : 2 1 - 2 5|25 Quality Circles members in both sectors, however,
agree with no significant difference that their problems solving skills have improved since joining the program. Despite the fact that the general feelings of QCs members in the two groups were positive towards QCs program, service QC members felt more strongly that their circles made a worthwhile contribution to their organizations and benefited financially from their efforts than their industrial counterparts. On the other hand, industrial QCs members showed more agreement than service QCs members did regarding the improved communication and the relationship between workers and supervisors.
4. Conclusion
From the results of the study, it can be concluded that both industrial and service QCs have shown that their companies were good place to work and rather satisfied with their jobs. A significant difference, however, were found between the two groups as for willingness to extend their effort towards commitment to organizational goals and values. Higher positive responses were found in industrial QCs members. As industrial QCs were relatively new to this program, this can be a possible reason to explain the great impact of QC program on the outcomes and attitude of members in those circles. This is similar to the “honeymoon” period observed in service QCs, when they were still enthusiastic about the QC program (Lawler and Mohrman, 1987).
It can be concluded that industrial QCs members were more enthusiastic than service QCs members in terms of involvement in QCs activities. In addition, industrial QCs members did not show a great
concern as QCs in service organization did in terms of whether their companies have financially benefited by their worthwhile contribution in QCs.
References
1. Gray, G. R. S. A. M., 1993. Quality Circles: An Update. Advanced Management J. 1984, 58, pp: 41 2. Goh, M., 2000. Quality Circles: journey of an Asian public enterprise. The Int. J. Quality & Reliability Management. Bradford, 17: pp. 784. 3. Ramsing, K. D. and J.D. Blair, 1982. An Expression of Concern about Quality Circles. Academy of Management Proceedings.
4. Richards, B., 1984. White-Collar Quality Circles and Productivity. Training &
Development J. 38, pp: 92.
5. Munchus III, G., 1983. Employer-Employee Based Quality Circles in Japan: Human Resource Policy Implications for American Firms. Academy of Management Review, 8, pp: 255.
6. Lees, J. and B.G. Dale, 1988. Quality Circles in Service Industries: A Study of their Use. Service Industries J. 8, pp: 143
7. Crocker, O. L., J.S.L. Chiu and C. Charney, 1984. Quality Circles: A Guide to Participation and Productivity. New York. American Library Publishers, New York.