Http://www.ijetmr.com©International Journal of Engineering Technologies and Management Research [20]
NUMERICAL ANALISIS OF THE STRAINS AND STRESS STATES
REINFORCED CLAY BRICK MASONRY WALLS HORIZONTALLY
SHEARED
Radosław Jasiński *1
*1 Building Structures Department, Silesian University of Technology, Poland
Abstract:
This paper presents the results: stress and strain of bed joints mortar, masonry units, reinforcement bars and mechanism of cracking of numerical simulations using ANSYS of reinforced brick wall in the horizontal shear. Willam-Warnke (WW-5) failure criterion for mortar and bricks and Huber-Mises-Hencky (HMH) plasticity surface for bed joints steel reinforcement (steel smooth bars and truss type reinforcement) has been used. Coulomb-Mohr (CM) criterion in the contact surfaces of mortar and bricks have been used in the interface elements. Numerical calculations showed satisfactory convergence of research in the patterns of cracking; and the load-strain relationship was similar to the results of research with regard only to the cracking time. Destructive force numerical models Hu,cal correspond to the forces observed at the first cracks in the walls Hu,mv. Reduction of transverse and longitudinal deformation of mortar bed joints have been reported in the immediate vicinity of the bars, and the reduction of the main stress of the bricks is reported in the case of the use reinforcement.
Keywords: Reinforced Masonry Structures; Horizontal Shear Wall; FEM Analysis; Discrete
Micro Model; Interface Element; Willam-Warnke Model.
Cite This Article: Radosław Jasiński. (2018). “NUMERICAL ANALISIS OF THE STRAINS
AND STRESS STATES REINFORCED CLAY BRICK MASONRY WALLS
HORIZONTALLY SHEARED.” International Journal of Engineering Technologies and
Management Research, 5(8), 20-37. DOI: https://doi.org/10.29121/ijetmr.v5.i8.2018.277.
1. Introduction
DOI: 10.5281/zenodo.1412216
Http://www.ijetmr.com©International Journal of Engineering Technologies and Management Research [21]
[8,19,4] or with reinforced bed joints changing the mechanical properties [18, 20]. Theoretical analysis of reinforced walls suggest that the local deformations of the mortar reduced due to the presence of reinforcement will increase the intensity of cracking joints and increase the value of the cracking stress. The most positive impact of reinforcement is visible in the walls under compression. A study of 51 clay brick walls [22] also confirmed the significant influence of reinforcement.
To recognize influence of reinforcement it was necessary to build a FEM numerical model of the fragment wall, allowing for a detailed analysis of the interaction of mortar and masonry reinforcement until the cracking state. The main aim of this study was to conduct numerical analysis of the results of research [22] in terms of:
• patterns of cracking,
• influence of reinforcement on the mortar strains,
• values of cracking and destructive forces,
• principal stress (σ1) in the bricks.
2. Numerical Model of the Wall
2.1.Modeling Strategy
Analysis of the stress and strain states were carried out on a separate fragment wall of the central area of the research model. Due to the limited technical possibilities, the calculation process is divided into 3 stages.
• Stage I. Numerical model of the wall sheared horizontally (orthotropic shell model) the
real size was built. Models were initially compressed to obtain stress σc = 0 and 1.5
N/mm2 depending on the series of elements and sheared the horizontal force H.
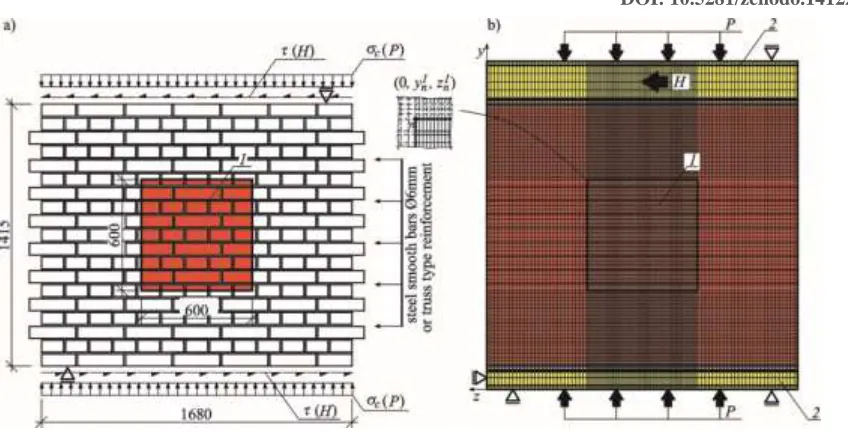
Displacement of n nodes (0,xnI,znI ) lying around the edges of the middle, mentally separate parts of 600 × 600 mm, located in the central area of the wall [22] - Figure 1 have been identified on the basis calculations.
• Stage II. Displacements of n nodes ( nI
I n z
x , ,
0 ) lying on the edge of the part 600 × 600 mm
obtained from stage I was loaded linear-elastic solid numerical micromodels of wall (unreinforced, reinforced with bars and truss type reinforcement) overall dimensions 600 × 600 × 250 (125) mm. Eight nodes finite elements were used in this stage with parameters brick and mortar and linear elements, which were modeled reinforcement of smooth bars or truss type reinforcement.
• Stage III. Displacement of k nodes ( II
k II k II
k y z
x , , ) obtained from the solution of models of
Http://www.ijetmr.com©International Journal of Engineering Technologies and Management Research [22]
Figure 1: Masonry walls: a) test specimens [22, 23], b) numerical macromodel - stage I,
(1 – wall fragment under analyzed 600×600 mm, 2 – element of the test stand)
Figure 2: The geometry of the models and mesh of finite elements numerical models used in the calculation (stage II and III): a) elements of reinforced with bars, b) the elements of reinforced
DOI: 10.5281/zenodo.1412216
Http://www.ijetmr.com©International Journal of Engineering Technologies and Management Research [23]
2.2.Material Models of Mortar and Brick in Stage Iii
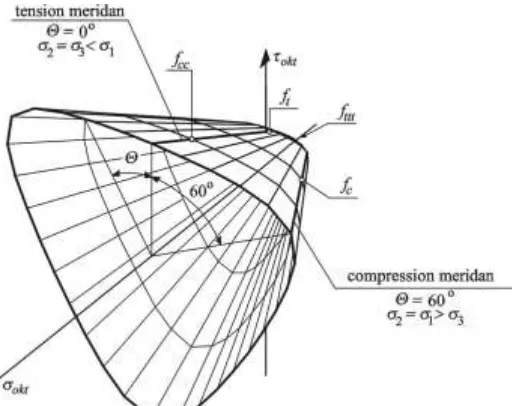
Elastic-brittle material model with the failure surface of the Willam-Warnke (WW-5) [24,8,26,25] was used for mortar and bricks, the shape of the octahedral stress [27] shown in Figure 3. Meridians of the five parameters surface cone are parabolic in shape (Fig. 4). In the deviatoric cross-sectional shape of the failure surface WW-5 consists of three mutually tangent to the ellipse described an equilateral Rankine equilateral triangle and inscribed the outer circle
Drucker-Prager. Meridian where is located the point corresponding to the compressive strength fc
the uniaxial state of stress is called compression meridian and the meridian which is located the
uniaxial tensile strength ft and biaxial compression fcc called tension meridian. In the deviatoric
cross-section shape of the surface is periodic - meridians on the surface are alternately rotated
through Lode angle =60°. All meridians intersect the hydrostatic axis at one point which
corresponds to the triaxial tensile strength fttt [110].
Figure 3: Willam-Warnke (WW-5) failure surface
Figure 4: Willam-Warnke (WW-5) failure surface parameters: a) deviatoric cross-section
Http://www.ijetmr.com©International Journal of Engineering Technologies and Management Research [24]
Mortar and bricks uniaxial compressive strength and tensile strength fc, ft were adopted directly
from the research cylinders 60 120 mm. However, biaxial compressive strength was fcc –
from the triaxial test, where the samples were destroyed with uniform lateral and vertical compressive stress σver = 0. The results of uniaxial and triaxial tests were plotted on the graph
and approximated by polynomials of the second degree least squares method. In addition, the shape of the meridian compression adjustment was made and found a common point of
intersection with the tension meridian corresponding to the triaxial tension strength fttt. The
adjusted compression and tensile meridians views WW-5 surface of the mortar and brick is shown in Figure 5 and Figure 6 and summarized in Table 1, where also given modules of
elasticity E and Poisson ratios ν obtained in the uniaxial study.
Figure 5: Corrected tensile and compressive meridians of mortar
Figure 6: Corrected tensile and compressive meridians of brick
Table 1: The parameters of mortar and bricks taken for numerical computations
Parameter Mortar Brick
uniaxial compressive strength fc, N/mm2 6,77 22,5
uniaxial tensile strength ft, N/mm2 0,529 1,31
biaxial compressive strength fcc, N/mm2 16,4 26,5
extreme values on the tension meridian f1, N/mm2 f1,max = okt = 8,63 f1,max = okt = 13,3
DOI: 10.5281/zenodo.1412216
Http://www.ijetmr.com©International Journal of Engineering Technologies and Management Research [25]
N/mm2
modulus of elasticity E, N/mm2 3070 3570
Poisson ratio - 0,227 0,131
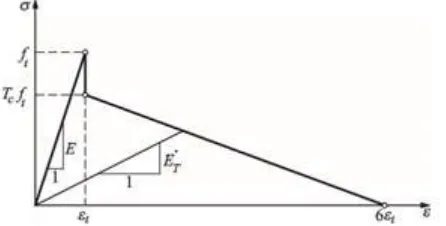
“Smared band of crack” forming in the direction in accordance with the directions of principal stress was used in the micromodel. After cracking there followed modification of the properties of the finite element. Initially isotropic material (mortar and brick) transformed in orthotropic. One of the axes of the material changed the direction perpendicular to the plane of the crack. In
this direction occurred initially material weakness and decreased stress on the tensile strength ft
to the value defined as the ratio of the tensile strength and the coefficient of weakness Tc = 0.1.
Figure 7: Smeared band of cracks σ – ε relationships
Then the material weakness in the crack described as a function was decreasing linear
relationship between tensile strain εt ÷ 6εt. After cracking in subsequent iterations secant modulus
ET was taken. Relationships tensile stress – strain in the plane of crack adopted in the numerical
model is presented in Figure 7. In the case of cracks, which occurred in the tensile stress (open
crack) with the ability to transfer shear stresses, determined the value of the coefficient t (shear
transfer coefficient) taking values between 0 to 1. ,,Closed cracks” was similarly given to the
properties. Transferring shear coefficient stress ratio defined as a c, whose value in the case of
open cracks could adopt values between 0 to 1. Both coefficients t and c assumed equal to 0.6.
The cracking due to compression (,,crushing cracks ") were accepted the total degradation of modulus of elasticity of the material, and cracked finite element was losing the ability to transfer any tension.
2.3.Interface Elements
To the reflect the slip occurring at the interface between bricks and mortar observed in the studies [22], it was decided to use the interface elements. Were applied as 10 nodes surface interface elements of Target 174-Contac 170 type available in the ANSYS system - figure 8.
Http://www.ijetmr.com©International Journal of Engineering Technologies and Management Research [26]
Figure 8: Location interface elements in the micromodel (Stage III)
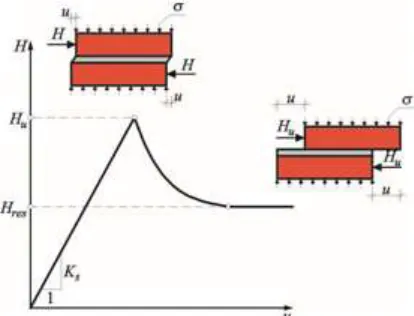
At the maximum compressive and tensile stress contacting surfaces have remained connected,
which means there is an ability to transfer normal and shear stresses. The relationships load (H) -
displacement (u) need the following initial value of the shear stiffness Ks0 in the elastic state.
Figure 9: Shear characteristic of interface elements (Stage III)
To determine the shear strength (fv) it was necessary to determine the initial shear strength (fvo)
and static coefficient of friction (tgα) in the mortar joints. Coulomb-Mohr (C-M) (1)
relationships, as a criterion of shear stress, was used.
tg f
fv = vo+ (1)
The shape of the interface elements the shear criteria are shown in Figure 10. Linear relationship
(1) was valid in the range of the normal stress σ greater than the tensile strength ft of the contact
to the shear stress not more than fvmax = 1019 N/mm2. Decay coefficient dc - Figure 10b was used
to define after cracking the contact was required. Degradation of the static friction coefficient tgα
to the residual coefficient of friction μres was described in the course of the exponential
DOI: 10.5281/zenodo.1412216
Http://www.ijetmr.com©International Journal of Engineering Technologies and Management Research [27] − +
= −dcu
res res e tg 1 1
. (2)
Parameters interface elements necessary to calculate the shear were determined on the basis of the initial shear strength of the wall according to EN-1052-3:2003 Methods of test for masonry - Part 3: Determination
of initial shear strength code. Interface elements parameters in vertical planes were determined by dividing
the value of the parameter (except for the dc coefficient) and quality factor [28] (“quality
factor”), which was adopted equal to 0.5. Parameters of the interface elements shown in Table 2.
Figure 10: Interface elements failure criteria: a) τ – σ relationships, b) graphic illustration of the decay coefficient of friction dc
Table 2: Parameters of interface elements
Parameter Bed joints Vertical joints
initial stiffness of shear wall Ks, kN/mm 138 69
initial shear strength (cohesion) fvo, N/mm2 0,452 0,226
static coefficient of friction tg 1,06 0,503
maximum tensile stress in the contactft,N/mm2 0,011 0,006
residual coefficient of friction res 0,845 0,422
decay coefficient dc 0,030 0,030
2.4.Steel Material Model
Http://www.ijetmr.com©International Journal of Engineering Technologies and Management Research [28]
Figure 11: Huber-Mises-Hencky yeld furface ([27])
Table 3:Mechanical properties of reinforcing steel
Reinforcement and diameter mm Parameter
Es N/mm2
Poisson ratio Rp0,2 N/mm2
ET N/mm2
smooth bars 6 170000 0.3 592 1590
strip of truss 5 183000 701 1090
bracking of truss 3,75 176000 625 742
Es - modulus of elasticity, Rp0,2 - yield stress, ET, - secant modulus.
3. The Results and Analysis of the Researches and Numerical Calculations
Mean values of cracking Hcr,mv and ultimate forces Hu,mv obtained on all series specimens
(described in detail in the work [22]) are shown in Table 4. The results of the numerical
calculations as a cracking Hcr,cal and ultimate Hu,cal forces numerical models used in stage III are
shown as well. Numerical shell models in stage I loaded with the forces of the average values
specified at the time of the destruction of the research elements Hu,mv - Table 4.
The result of model calculations carried out in the first stage was to determine the components of
the displacements of all the nodes on the edge of area of 600600 mm, which linearly elastic
mikromodel charged in stage II, these displacements has been loaded with linearly elastic micromodel in stage II. Displacements of nodes in stage II model obtained along the edge of the
model (278×310×250 (125) mm) in stage III was used. Comparison of shear load H
non-dialatational strain angle Θ tests specimens, at the σc = 1.5 N/mm2 initially compressions and
numerical micromodels used in the phase III are shown in Figure 12.
Strains angle research elements grew in almost direct proportion to the shear loads to load values
of 80% Hcr,mv. The highest stiffness characterized by elements reinforced with truss type
reinforcement and the lowest stiffness was unreinforced specimens. With the increase of shear
load H disproportionate increase angle displacements were visible, especially important after
DOI: 10.5281/zenodo.1412216
Http://www.ijetmr.com©International Journal of Engineering Technologies and Management Research [29]
Table 4: Mean values of cracking and ultimate forces
Series reinforceme nt ratio ρh % σc N/mm 2
Researches [22] FEM model
cal cr mv cr H H , , cal u mv u H H , , cal u mv cr H H , , Crackin g forces Ultimat e forces Crackin g forces Ultimat e forces Hcr,mv kN Hu,mv kN Hcr,cal kN Hu,cal kN Unreinforce d specimens
0 0* 144 163 144 191 1,00 0,85 0,75
0,5 287 341 -- -- -- -- --
1,0 375 445 -- -- -- -- --
1,5* 424 567 181 416 2,34 1,36 1,02
Reinforced
with steel
smooth bars
0,05 0 186 237 -- -- -- -- --
0,5 326 448 -- -- -- -- --
1,0 396 542 -- -- -- -- --
1,5 407 584 -- -- -- -- --
0,1 0* 201 234 167 282 1,20 0,83 0,71
0,5 335 475 -- -- -- -- --
1,0 415 585 -- -- -- -- --
1,5* 441 668 200 585 2,21 1,14 0,75
Reinforced with
with truss
type
reinforceme nt
0,05 0 310 333 -- -- -- -- --
0,5 391 462 -- -- -- -- --
1,0 512 668 -- -- -- -- --
1,5 580 739 -- -- -- -- --
0,1 0* 321 348 193 415 1,66 0,84 0,77
0,5 462 542 -- -- -- -- --
1,0 538 685 -- -- -- -- --
1,5* 609 743 225 576 2,71 1,29 1,06
* - models analyzed in numerical calculations
Figure 12: Comparisons of shear load – non-dilatational strain angle (H-Θ) research series
Http://www.ijetmr.com©International Journal of Engineering Technologies and Management Research [30]
Due to the modeling strategy in stage III used loaded displacements of nodes obtained from the models in stage I and stage II did not occur proportional increase of walls angle deformation
after crcking, and the difference of destructive forces Hu,cal and given in the researches Hu,mv was
Hu,cal / Hu,mv. However, size of the numerical micromodel (stage III) model, allows for
comparison of the cracking forces specimen’s models Hcr,mv to the ultimate forces of numerical
models Hu,cal (Hu,cal / Hcr,mv = 0,77 – 1,06). Selected results of numerical models sheared
horizontally and compressed vertically at σc = 1,5 N/ mm2 reinforced with steel smooth bars and
truss type reinforcement are presented later in this chapter.
3.1.Cracking and Destruction
In the model reinforced with bars, cracks were first observed at a force of Hcr,cal = 200 kN
N/mm2, which is considerably less by about 120% compared to the average force
Hcr,mv = 441 kN strength obtained in research. The first cracks – fig. 13a,b formed in the bed joint
above of corner the bricks placed in head layers. Where there was the reinforced bar present cracking intensity was significantly lower than in areas without reinforcement mortar.
Destruction of the model was observed at a force of Hu,cal = 585 kN of 14% less than the
obtained in experimental studies Hu,mv = 668 kN. The increase in load resulted in the progressive
development of the cracking areas (fig. 13c,d) including internal joint and bricks. At the time of the near destruction of large cracking covered almost all the internal joint head, the supporting brick and joint. In the areas where reinforcement is used, the intensity at the time of destruction of cracking was slightly smaller. However, near to the face of the wall there have more damage and secondary cracks (blue and green in the present step load) providing a clear overload these areas.
Reinforcement strains were also analyzed in the following phases of the load (Figure 14).
After an initial compression to the, the σc = 1,5 N/mm2 the deformation of the reinforced bar
DOI: 10.5281/zenodo.1412216
Http://www.ijetmr.com©International Journal of Engineering Technologies and Management Research [31]
Figure 13: Cracking patterns of reinforced with smooth bars model HC-ZPII-15 series
a) numerical model - view from the face of the wall (Hcr,cal), b) numerical model - view of the
bed joint with the steel bar (Hcr,cal ), c) numerical model - view from the face of the wall (Hu,cal),
d) numerical model - view of the bed joint with the steel bar (Hu,cal), e) cracking of lab element
Figure 14: Strains of the steel smooth bar 6 mm in successive phases of the load HC-ZPII-15
series: a) initial compression H = 0 kN, b) the destruction of model Hu,cal = 585 kN
In the numerical model reinforced with truss type reinforcement cracks were first observed at a
Http://www.ijetmr.com©International Journal of Engineering Technologies and Management Research [32]
visible cracks (Figure 15a, b) of the wall reinforced with steel truss type reinforcement was also observed in the area underlying the bed joint corner of brick, and in places a connected bracking
and strip of truss. The destruction occurred at the load and Hu,cal = 576 kN and was 29% lower
than obtained in the lab model Hcr,mv = 609 kN. In addition, the cracks were visible in bed and
vertical joint (figure 15c, d). With the increase of horizontal load to a growing area of cracking, bed joints and cracks also appear in the bricks. At the time of the destruction cracking covered almost all the head joint. As in the case of walls with steel bars, in places where the truss type reinforcement was located cracking intensity was less than the near the face of wall. Initial deformation of the truss bars, like the smooth bars were tensile and uniform– figure 16a.
With increasing horizontal load there was seen a gradual reduction in strain in bars and change the distribution of the length. On the sections and diagonal bracking and belts lying cracked areas in the bed joints increased tensile strain – fig. 16b after the cracking. At the time of the destruction, strains were significantly changed in relation to the intermediate states. In the place the mortar cracking dominated tensile strains belts and diagonal bracking, while in places where the mortar remains non-cracked compressive strains occurred. Due to the free of the wall deformation in the thickness direction (along the x axis) the greatest strains diagonal bracking was observed.
Figure 15: Cracking patterns of reinforced with smooth bars model HC-ZKII-15 series
a) numerical model - view from the face of the wall (Hcr,cal), b) numerical model - view of the
bed joint with the truss type reinforcement (Hcr,cal ), c) numerical model - view from the face of
the wall (Hu,cal), d) numerical model - view of the bed joint with truss type reinforcement (Hu,cal),
DOI: 10.5281/zenodo.1412216
Http://www.ijetmr.com©International Journal of Engineering Technologies and Management Research [33]
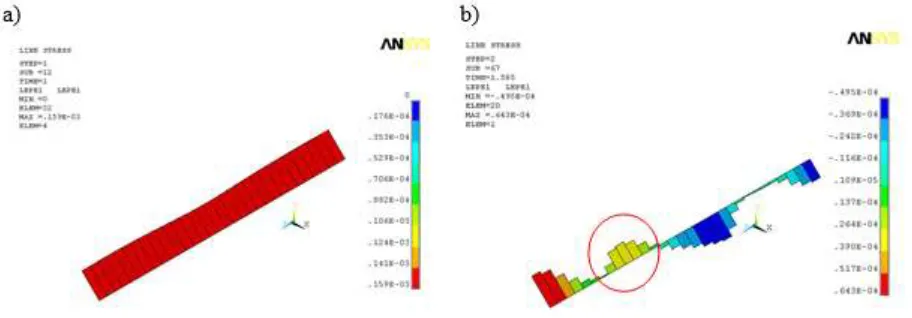
Figure 16: Strains of the truss type reinforcement in successive phases of the load HC-ZKII-15
series: a) initial compression H = 0 kN, b) the destruction of model Hu,cal = 576 kN
3.2.Bed Joints Deformation
A comparison of longitudinal joint strains was also carried out where reinforcement was introduced and compared with models unreinforced. Figures - fig 17a, 18a and 19a show a map of the longitudinal strains of the bed joint at cracking and in Figures 17b, 18b and 19b show the longitudinal strains visible form the face of the model.
The bed joint areas, which were observed first cracks (masonry unit corners) in the joint without reinforcement can be seen the concentration of strain. However, in the joints, in which the reinforcement introduced strain distribution in these areas was different in terms of distribution and deformation values. Significant changes have occurred in places where the bars crossed an area of concentration, the strain decreased of 20% to 50%. In this case the separation of the mortar from bricks was visible only on the head surfaces. The visible reduction of mortar strains in the bed joints was the reason for reduced damages around bars and increase of cracking load and stiffness with respect to unreinforced masonry.
Figure 17: Longitudinal strain εz of unreinforced masonry Hcr,cal = 181 kN HC-15 series: a) bed
Http://www.ijetmr.com©International Journal of Engineering Technologies and Management Research [34]
3.3.Principal Stress in the Brick
According to the well-known Mann-Muller model [28, 29] for shear and compression masonry units can be cracked if the principal stress exceeds the tensile strength. The following figures (fig. 20, 21, 22) presented maps of principal stresses σ1 (σ1 > σ2 > σ3) visible on the surfaces of
the bricks located above and below the reinforced bed joint. Comparisons were made at a force
equivalent to a cracking of unreinforced model HC-15 series (Hcr,cal = 181 kN). The most
significant changes occurred in the state of stress bricks placed longitudinally in the wall. When applied reinforcement was visible, a shift (and increase in value) of extreme stress in the direction of the face of the wall surface in relation to the bricks placed in the model without reinforcement, where the extreme values were almost the entire width of the bricks. This phenomenon substantially reduced the loads of bricks cracking inside the wall, but in turn, caused the cracks near the face surface of the wall. The bricks placed transversely reinforcement effect was much less noticeable.
Figure 20: Principal stress 1 in brick of unreinforced wall (HC-15) Hcr,cal = 181 kN: a) brick
over reinforced bed joint, b) brick below reinforced bed joint
Figure 21: Principal stress 1 in brick of wall reinforced with smooth bars (HC-ZPII-15)
DOI: 10.5281/zenodo.1412216
Http://www.ijetmr.com©International Journal of Engineering Technologies and Management Research [35]
Figure 22: Principal stress 1 in brick of wall reinforced with truss type reinforcement
(HC-ZKII-15) Hcr,cal = 170 kN: a) brick over reinforced bed joint, b) brick over reinforced bed joint
4. Summary and Conclusions
FEM calculations were performed to formulate the following conclusions:
1) In the analysis of large masonry structures is possible use the masonry micromodel part
of the wall and loading external supports deformities (obtained from FEM calculations macro model of the wall) on condition:
• the proper determination of mechanical parameters of wall macro model,
• application of failure and plasticity surface and interface finite elements on surface
contact the masonry units and mortar.
2) The method of structural analysis consisting of separating of the wall area and calculating
it as a discrete micro model can describe the work of the wall until cracking the real wall. This method of modeling were obtained:
• destructive forces of Hu,cal of micro models, determining with reasonable accuracy
cracking the real only sheared walls (σc =0 N/mm2) Hcr,mv/Hu,cal = 0,71÷0,77 and the
sheared and maximum compressed (σc = 1,5 N/mm2) Hcr,mv / Hu,cal = 0,75÷1,02,
• the cracking forces of Hcr,cal considerably smaller than the value obtained in the
researches Hcr,mv the only sheared elements (σc = 0 N/mm2) Hcr,mv / Hu,cal = 1,0÷1,66, and
the shear and maximum compressed (σc = 1,5 N/mm2) Hcr,mv / Hu,cal = 2,21÷2,71,
• relationship load (H) – non-dilatational strain angle (Θ) was similar to the results of research only the cracking.
3) A numerical micro model of masonry confirmed the influence (qualitatively) of the
applied reinforcement on the mechanism of cracking formation;
• cracking each time were created in the same areas of mortar - in the bed joint located at
the corners of brick
• confirmed the overall variability of the observed deformation of the reinforcement
Http://www.ijetmr.com©International Journal of Engineering Technologies and Management Research [36]
• longitudinal strains the bed joint mortar were significantly reduced in places where it was
placed reinforcement,
• significant reductions in the lateral deformation of mortar in the bed joint observed in the
case of truss type reinforcement,
• applied reinforcement changed the value of the largest principal stress on the visible
surfaces of bricks placed longitudinally in the wall,
• load value at which cracking was observed of the numerical models was significantly
lower than that observed in studies,
• value of the failure load of the horizontal walls of the numerical models was similar to the value of cracking loads obtained in experimental studies.
References
[1] Lourenço P.B., Rots J.G., Blaauwendraad J.: Two Approaches for the Analysis of Masonry Structures: Micro and Macro-Modeling. Heron. Vol. 40, No. 4, 1995, pp. 313 ÷ 340.
[2] Lourenço P.B.: Two Aspect Related to the Analysis of Masonry Structures: Size Effect and Parameter Sensibility. TNO. Building and Construction Research 1997.
[3] Lourenço P.J.B.B.: Computational Strategies for Masonry Structures. PhD Thesis. Delf University Press. 1996.
[4] Shing P.B., Cao L.: Analysis of Partially Grouted Masonry Shear Walls. U.S. Department of Commerce National Institute of Standard and Technology Building and Fire Research Laboratory. Gaithersburg, MD 20899. Report NIST GCR 97-710, 1997.
[5] Sieczkowski J., Szołomicki J.: Metody komputerowej analizy konstrukcji murowych. Inżynieria I Budownictwo Nr 7 / 1998, pp. 376 ÷ 379.
[6] Sieczkowski J., Szołomicki J.: Metody obliczeń statyczno-wytrzymałościowych sklepień w budynkach gotyckich. Oficyna Wydawnicza Politechniki Wrocławskiej. Wrocław 1999.
[7] Szojda L.: Analiza numeryczna współdziałania murowanych budynków ścianowych z deformującym się podłożem. Praca Doktorska. Gliwice 2001.
[8] Drobiec Ł.: Analiza murów z cegły pełnej ze zbrojeniem w spoinach wspornych poddanych obciążeniom pionowym. PhD Thesis. Gliwice 2004.
[9] Lourenço P.B., Rots J.G.: An Anisotropic Failure Criterion Suitable for Numerical Implementation. Proceedings of 7th North American Masonry Conference, 2 ÷ 5 June 1996,
University of Notre Dame, South Bend, Indiana, pp. 282 ÷ 293.
[10] Lourenço P.B.: Anisotropic Softening Model for Masonry Plates and Shells. Journal of Structural Engineering. Vol. 126, No. 9, September 2000, pp. 1008 ÷ 1016.
[11] Szojda L.: Możliwości analizy numerycznej konstrukcji murowej. XLVII Konferencja Naukowa Komitetu Inżynierii Lądowej i Wodnej PAN i Komitetu Nauki PZITB. Opole-Krynica 2001. Tom 3, pp. 385 ÷ 392.
[12] Szojda L., Majewki S.: Analiza numeryczna sił wewnętrznych w budynku murowanym pod wpływem deformacji terenu. XLIX Konferencja Naukowa Komitetu Inżynierii Lądowej i Wodnej PAN i Komitetu Nauki PZITB. Warszawa-Krynica 2003. Tom 4, pp. 163 ÷ 170.
[13] Kubica J. Ściany z cegły w złożonym stanie naprężenia. PhD Thesis. Gliwice, 1995.
[14] Kubica J.: Numerical Modelling of the Vertical Shearing Masonry Walls. Proceedings of 11th
International Brick / Block Masonry Conference, 1997 14 ÷ 16 October, Shanghai, pp. 1229 ÷ 1238.
DOI: 10.5281/zenodo.1412216
Http://www.ijetmr.com©International Journal of Engineering Technologies and Management Research [37]
[16] Wrana B.: Metody Numeryczne w analizie konstrukcji budowli zabytkowych. IV Konferencja Naukowo-Techniczna. Inżynierskie Problemy Odnowy Staromiejskich Zespołów Zabytkowych. Kraków 21 ÷ 23 maja 1998, Tom III, pp. 41 ÷ 48.
[17] Wrana B.: Problemy Modelowania i Analizy Numerycznej Murów. V Konferencja Naukowo-Techniczna. Inżynierskie Problemy Odnowy Staromiejskich Zespołów Zabytkowych. Kraków 17 ÷ 19 maja 2000, Tom I, pp. 245 ÷ 258.
[18] Lopez J., Oller S., Onnte E., Lubliner J.: A Homogeneous Constitutive Model for Masonry. International Journal for Numerical Methods in Engineering. Vol. 46, 1999, pp. 149 ÷ 156. [19] Majewski S., Wandzik G., Klemczak B., Szojda L.: Numerical Analysis of Reinforced Masonry
Walls Subjected to the Influence of Mining Ground Subsidence. Proceedings of 7th North
American Masonry Conference. June 2 ÷ 5, 1996. University of Notre Dame-South Bend, Indiana, USA. Vol. I, pp. 559 ÷ 570.
[20] Merlet J.D.: Reinforced Masonry Made of Hollow Units: Finite Element Modelling, Development and Validation. Wall Structures. 29th Meeting, W23 CIB. Padua, October 1992,
pp. 67 ÷ 88.
[21] Cerioni R., Donida G.: A Finite Element Model for the Nonlinear Analysis of Reinforced and Prestressed Masonry Walls. Computers and Structures. Vol. 53, No. 6, pp. 1291 ÷ 1306.
[22] Jasiński R.:,, Study of reinforced clay brick masonry walls horizontally sheared” 8th International
Masonry Conference, Dresden 2010, pp. 1231 ÷ 1242.
[23] Jasiński R.: Nośność i odkształcalność zbrojonych ścian murowych ścinanych poziomo. PhD Thesis. Gliwice 2005.
[24] Brencich A., Corradi C., Gambrotta L., Mantegazza G., Sterpi E.: Compressive Strength of Solid Clay Brick Masonry under Eccentric Loading. Proceedings of 6th International Masonry
Conference. Proceedings No. 9, London 2002, pp. 37 ÷ 46.
[25] Jäger W., Schöps P.: Numerical Modeling of Masonry Under Shear Loading. Proceedings of 13th
International Brick / Block Masonry Conference, 2004 4 ÷ 7 July, Amsterdam.
[26] Drobiec Ł.: FEM micro model of Masonry. 5th International Conference AMCM 2005, Gliwice-Ustroń, Poland, 2005.
[27] Majewski S.: Mechanika betonu konstrukcyjnego w ujęciu sprężysto-plastycznym. Monografia. Wydawnictwo Politechniki Śląskiej. Gliwice 2003 r.
[28] Dialer Ch.: Some Remarks on The Strength and Deformation Behavior of Shear Stressed Masonry Panels Under Static Monotonic Loading. Proceedings of 9th International Brick / Block
Masonry Conference, October 1991, Berlin, pp. 276 ÷ 282.
[29] Müller H.: Untersuchungen zum Tragverhalten von Qerkraftbeanspruchtem Mauerwerk. Bruchverhalten und Bruchtheorie, Auswertung bekannter Sherversuche, Zsätzliche Einflüsse bei Windscheiben. Dissertation, Technischen Hochschule Darmstadt, D17, Darmstadt, 1974.
*Corresponding author.