Ames Laboratory Accepted Manuscripts Ames Laboratory
10-27-2017
Capping Ligand Vortices as “Atomic Orbitals” in
Nanocrystal Self-Assembly
Curt Waltmann
Iowa State University and Ames Laboratory, waltmann@iastate.edu
Nathan Horst
Iowa State University and Ames Laboratory, nhorst@iastate.edu
Alex Travesset
Iowa State University and Ames Laboratory, trvsst@ameslab.gov
Follow this and additional works at:http://lib.dr.iastate.edu/ameslab_manuscripts
Part of theEngineering Physics Commons,Materials Science and Engineering Commons, and theNanoscience and Nanotechnology Commons
This Article is brought to you for free and open access by the Ames Laboratory at Iowa State University Digital Repository. It has been accepted for inclusion in Ames Laboratory Accepted Manuscripts by an authorized administrator of Iowa State University Digital Repository. For more information, please contactdigirep@iastate.edu.
Recommended Citation
Waltmann, Curt; Horst, Nathan; and Travesset, Alex, "Capping Ligand Vortices as “Atomic Orbitals” in Nanocrystal Self-Assembly" (2017).Ames Laboratory Accepted Manuscripts. 94.
Capping Ligand Vortices as “Atomic Orbitals” in Nanocrystal
Self-Assembly
Abstract
We present a detailed analysis of the interaction between two nanocrystals capped with ligands consisting of hydrocarbon chains by united atom molecular dynamics simulations. We show that the bonding of two nanocrystals is characterized by ligand textures in the form of vortices. These results are generalized to nanocrystals of different types (differing core and ligand sizes) where the structure of the vortices depends on the softness asymmetry. We provide rigorous calculations for the binding free energy, show that these energies are independent of the chemical composition of the cores, and derive analytical formulas for the equilibrium separation. We discuss the implications of our results for the self-assembly of single-component and binary nanoparticle superlattices. Overall, our results show that the structure of the ligands completely determines the bonding of nanocrystals, fully supporting the predictions of the recently proposed Orbifold topological model.
Keywords
nanocrystal, self-assembly, skyrmions, superlattices, thermodynamics, vortices
Disciplines
Capping Ligand Vortices as “Atomic Orbitals” in
Nanocrystal Self-Assembly
Curt Waltmann,
†Nathan Horst,
†,¶and Alex Travesset
∗,‡,††Department of Materials Science and Engineering and Ames lab, Ames, IA, 50011, USA
‡Department of Physics and Astronomy and Ames lab, Ames, IA 50011, USA
¶Also a first author
E-mail: trvsst@ameslab.gov
Abstract
We present a detailed analysis of the interaction between two nanocrystals capped
with ligands consisting of hydrocarbon chains by united atom molecular dynamics
simulations. We show that the bonding of two nanocrystals is characterized by
lig-and textures in the form of vortices. These results are generalized to nanocrystals
of different types (differing core and ligand sizes) where the structure of the vortices
depends on the softness asymmetry. We provide rigorous calculations for the binding
free energy, show that these energies are independent of the chemical composition of
the cores and derive analytical formulas for the equilibrium separation. We discuss
the implications of our results for the self-assembly of single component and binary
nanoparticle superlattices. Overall, our results show that the structure of the ligands
completely determines the bonding of nanocrystals, fully supporting the predictions of
Keywords
self-assembly, nanocrystal, thermodynamics, superlattices, skyrmions, vortices
Nanocrystals (NCs) are nanometer scale crystalline inorganic cores that have been
func-tionalized by capping ligands. Assembling these NCs into materials that perform new and
potentially revolutionary functions is one of the central goals in nanotechnology. The
cap-ping ligand is necessary to direct and program the assembly of NCs into relevant
struc-tures, and plays a role akin to electronic orbitals in materials made of simple elements and
molecules. Typical ligands include DNA, polymers or hydrocarbons,1 leading to periodic and
quasi-periodic structures of NCs,i.e. superlattices, self-assembled by DNA-hybridization,2,3
[image:4.612.74.534.331.653.2]electrostatic phase separation4–6 or solvent evaporation,7–18 just to name a few.
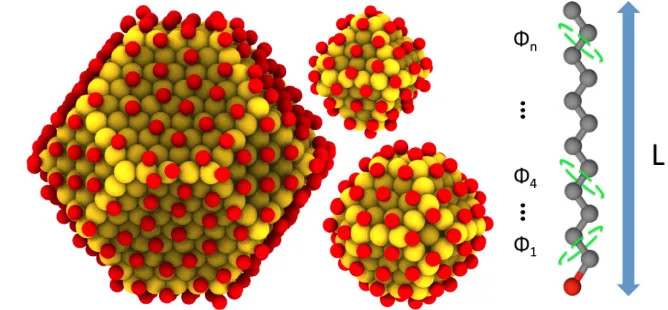
Figure 1: NCs as soft skyrmions: Hedgehog and vortex, with the different parameters Ai
Superlattices involving two NC species, i.e. binary nanoparticle superlattices (BNSLs),
are among the most sophisticated structures assembled to date, and more than twenty
dif-ferent structures of BNSLs in 2D and 3D have already been reported.19 The first theoretical
description of these BNSLs followed previous approaches for micron-size colloids,20 where
NCs are modeled as hard spheres (HS) whose diameter is given by the NC nearest
neigh-bor distance of a single component two dimensional triangular lattice. From these studies,
a correlation between maxima of the HS packing fraction and the presumably equilibrium
structures was obtained.12,21 Yet, such correlation is somewhat rudimentary, as many BNSLs
exist at low HS packing fraction and, furthermore, lattice distances are, more often than
not, inconsistent with the assumed HS radius.22 Attempts to describe those disagreements
in terms of more flexible potentials23,24 or other coarse-grained models25 expanded the
pre-dictable range of equilibrium lattices, but did not resolve the flaws of the HS model.22 It
is only with the advent of the Orbifold Topological Model (OTM),22 that a full and
rigor-ous description of the structural properties of BNSLs was achieved, as demonstrated by the
successful parameter free description of more than 160 experiments.26
The OTM describes each NC as a “Soft Skyrmion”, see Fig. 1. IfLdenotes the maximum
extension of the capping ligand, Ri the core radius and ri the NC radius, the dimensionless
variables
λi =
L Ri
, τOP M =
ri
Ri
, (1)
are introduced. The actual NC radius is given by the Optimal Packing Model(OPM)
for-mula27
τOP M = (1 + 3ξiλi)1/3 , (2)
where ξi = AA0
i,A0 is the smallest possible molecular area and Ai the actual molecular area.
The OPM value will be referred to as the NC radius ri and is generally smaller than the
hydrodynamic radiusrH
i defined as the radius of the free (unperturbed) NC, with associated
variable τH
OTM predicts a smaller radius ¯ri < ri, enabled by vortex textures, see Fig. 1. A detailed
description of how to calculate ¯ri is provided in the original references of the OTM.22,26
For two isolated NCs, the equilibrium distance ˜ri corresponds to the minimum of the
potential of Mean Force (PMF), and has been proposed to be described by the Overlap
Cone Model (OCM)28
τOCM =
1 +λi
2 −1 +
s
1 + 8(1 + 3ξiλi) (1 +λi)3
!
, (3)
where τOCM = ˜ri/Ri < τOP M, see Figure. 1. Since the case of an isolated pair of NCs
corresponds to a coordination of one, the OTM predicts that the NC “atomic orbitals”
created by deformed ligand structures can be realized as two vortex textures, one on each
NC, contained within the OCM cone, see Fig. 1.
In this paper, we analyze the interaction between two NCs within a united atom model
and analyze the postulated vortex configurations, thus identifying further the analogy of
cap-ping ligands as “atomic orbitals”. We include the case of two NCs with different radii and
ex-plore the long hydrocarbon chains investigated in real experiments. Previous studies focused
primarily on the potential of mean force, starting with those performed by Schapotschnikow
et al.28–30 Subsequent investigations have studied the role of solvent,31,32 more detailed
den-sity functional theories,33 as well as different approaches to the PMF34 and three body
effects.35 The relation of this work to our results is discussed further below.
Results
Model Parameters
We consider NCs whose crystalline cores consist of gold atoms and whose ligands are
eliminate hydrogens from our naming convention, instead denoting each one of the CH2 or
CH3 united atoms in our model as C. We studied three core sizes Au140(SCj)62, Au201(SCj)80
and Au1289(SCj)258, considering three distinct chain lengths of j = 9, 12 and 19 carbons. The
shapes of the cores follow truncated octahedral or cuboctahedral geometries, resulting in the
[111] and [001] families of planes as the exposed surfaces of the fcc crystalline cores (Figure
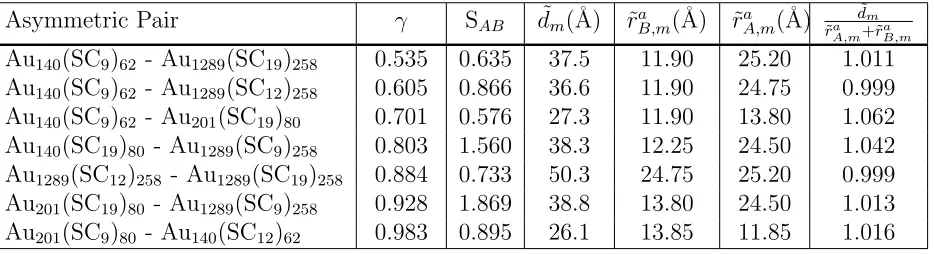
[image:7.612.132.466.222.377.2]2).
Figure 2: Nanocrystal cores Au1289(SCj)258 (left), Au201(SCj)80 (bottom right), and
Au140(SCj)62 (top right) with Au atoms shown in yellow and S atoms shown in red.
Hydro-carbon chains are not drawn. The Au-Au distance is ∼ 2.8 ˚A. The geometry of the cores expose [001] and [111] planes. Average S-S distances are ∼ 4.1 ˚A. HC chains are attached at the sulfur sites, described by maximum length Li and having n =j −2 defined dihedral
angles where j is the number of carbons in the chain.
We follow the work of Luedtkeet al.36and choose sulfur binding sites as geometric points
on the surface of the core. These binding sites were grouped into three types: hollow, bridge,
and on-top, as described in the work of Tachibana et al.,37 based on the relative location of
the site to the close packed spheres of Au that comprise the core surface. The final positions
of the bound sulfur atoms were determined by adding a distance normal to the plane of the
core surface, where the distance is dependent on the type of binding site.37 The resulting
sulfur binding configuration on each nanocrystal core is shown in Figure 2. We note that
all ligand grafting densities studied in this work are high, close to the maximum allowed, so
grafting density will not be one of the parameters varied in this study.
assumptions. We define it by 2Ri =Di =Di,s+dAu−S whereDi,s is the diameter of a sphere
with equal surface area to that of the core, and dAu−S is the distance between the sulfur
atoms to the surface normal of the gold face. Another reasonable definition D0
i is given as
twice the radius of gyration of the sulfur atoms, with an additional term of 0.24˚A added due
to relative lengths of the S-C and C-C bonds. We define grafting densities as per molecule
areas of grafting sites, and note that the difference between our two definitions of the core
[image:8.612.69.544.267.374.2]is negligible for all practical purposes, as shown in Table 1.
Table 1: Core Diameters and Grafting Densities, see the main text for description.
2Ri =Di(˚A) 2R0i =D
0
i(˚A) σ(˚A
−2) σ’(˚A−2)
Au140(SCm)62 18.57 18.33 17.47 17.02
Au201(SCm)80 20.30 20.22 16.18 16.06
Au1289(SCm)258 40.60 40.44 20.07 19.91
We use a united-atom model for the hydrocarbon surfactant chains, with each sulfur
and carbon in the chain grouped with their surrounding bonded hydrogen atoms into one
effective “atom”. Our force field follows Hautman and Klein,38 see SI for further details.
Table 2: NC Parameters Ri, L, λi. Hydrodynamic radius ri,mH and minimum of the PMF
2˜ri,m, the subscript m is meant to remind that this is the result found in the simulation.
Also, the same radii are given in the variableτ.
NC Ri(˚A) L λi rHi,m(˚A) 2˜ri,m τi,mH τ˜i,m
Au140(SC9)62 9.285 13.42 1.445 19.2 23.8 2.07 1.28
Au140(SC12)62 9.285 17.22 1.855 20.9 23.7 2.25 1.27
Au140(SC19)62 9.285 26.10 2.811 23.7 24.5 2.55 1.32
Au201(SC9)80 10.15 13.42 1.322 20.5 27.7 2.02 1.36
Au201(SC12)80 10.15 17.22 1.697 22.3 27.1 2.20 1.33
Au201(SC19)80 10.15 26.10 2.571 27.4 27.6 2.70 1.36
Au1289(SC9)258 20.30 13.42 0.661 29.5 49.0 1.45 1.21
Au1289(SC12)258 20.30 17.22 0.848 31.8 49.5 1.57 1.22
[image:8.612.71.545.534.684.2]Configurational Characteristics
Potential of Mean Force
We only discuss the PMF in vacuum, i.e. for dry conditions, in the absence of solvent, and
included the nine cases described in Table 2. Note that this considers a range of λi, see
Eq. 1, over the interval [0.66,2.81]. Four representative cases for the PMF calculation are
provided in Fig. 3, see SI for the remaining cases. The method followed to perform these
calculations is described briefly in Materials and Methods and in more detail within the SI.
Our PMF figures clearly illustrate the competition between the attractive Van der Waals
forces and the entropically driven chain repulsion. The binding free energies are very strong,
in the range of several hundreds of kBT, an issue that we further discuss below. Note that
even at distances ρ ≈ 2rH
i,m there is a very significant attraction between NCs, driven by
the stretching of the chains towards each other. This effect becomes quite obvious for the
Au1289(SC19)258 NC, as shown in Fig. 3. Note that we introduce the subscript ”m” to our
notation to denote results calculated directly from our simulations.
Chain Structure
The OCM angle is given by:
cos(χOCM) =
˜ ri
Ri+Li
= τOCM
1 +λi
, (4)
and defines a cone where the hydrocarbons fill the entire space (melt condition), drawn as
a solid red cone in Fig. 1. This same cone is illustrated in Fig. 4 as a purple conical region.
A plot of the percentage of dihedrals in the trans configuration within the OCM cone is
provided in Fig. 4, where a noticeable decrease in the percentage of dihedrals in the trans
state occurs for the first and the third dihedrals in the inner OCM cone, χinner =χOCM/2,
depicted in cyan, where the numbering of dihedrals is elucidated in Fig. 2. This decreasing
main conformational changes are associated with the chains next to the center of the cone.
In Fig. 5 we present averaged configurations for both free and interacting NCs (taken at
the minimum of the free energy), shown from the side and from the front. For the case of a NC
in free space, the configuration resembles a hedgehog, where all the chains lie perpendicular
to the core (neutral lines or surfaces), while for the interacting case, they consist of chains
radiating from a central point with a non-zero projection over the core, denoted as vortices,
see Fig. 1. Note that beyond the OCM-cone, the configurations of the chain are very much
the same as for the free NC, resembling hedgehog configurations or neutral lines. It is also
apparent that there is negligible chain interdigitation among chains belonging to different
[image:11.612.94.517.315.579.2]NCs, with chains entirely contained to the right or the left of the interaction plane.
Figure 4: Representation of the OCM and the inner OCM cone. The breaking of φ1 and φ3
Figure 5: Average configuration for the Au140(SC9)62 (a) average free particle, consisting of
a neutral surface (b) side view of the vortex at pair potential minimum (c) view of NC at the minimum of the pair potential including the vector projections illustrating the vortex configuration.
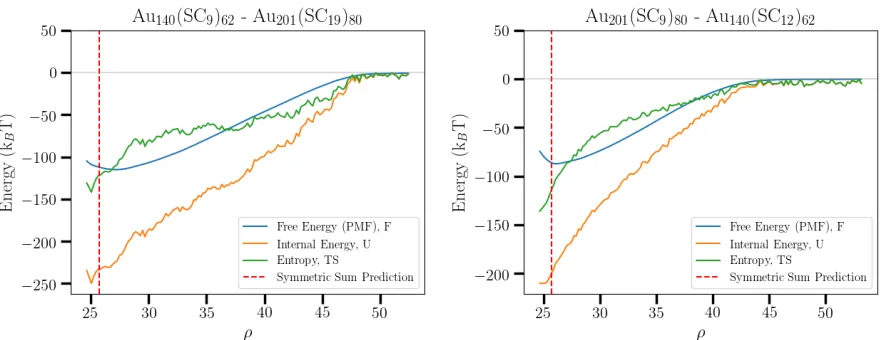
Table 3: Parameters describing the asymmetric cases analyzed in this study. The parameters are γ, Eq. 5, softness asymmetry Eq. 6. The distance at the minimum of the PMF is ˜dm.
Asymmetric Pair γ SAB d˜m(˚A) r˜aB,m(˚A) r˜aA,m(˚A)
˜
dm ˜
ra
A,m+˜raB,m
Au140(SC9)62 - Au1289(SC19)258 0.535 0.635 37.5 11.90 25.20 1.011
Au140(SC9)62 - Au1289(SC12)258 0.605 0.866 36.6 11.90 24.75 0.999
Au140(SC9)62 - Au201(SC19)80 0.701 0.576 27.3 11.90 13.80 1.062
Au140(SC19)80 - Au1289(SC9)258 0.803 1.560 38.3 12.25 24.50 1.042
Au1289(SC12)258 - Au1289(SC19)258 0.884 0.733 50.3 24.75 25.20 0.999
Au201(SC19)80 - Au1289(SC9)258 0.928 1.869 38.8 13.80 24.50 1.013
[image:12.612.76.543.533.660.2]Asymmetric Nanocrystals
Here we consider two NCs with different radii rA, rB, such that rB < rA. These radii are
given by the OPM formula Eq. 2, which is the equivalent HS radius for NCs, as discussed
further above. Distances corresponding to the minima of calculated asymmetric PMFs will be
denoted with the superscript ”a” while keeping all other notation the same as the symmetric
case i.e. r˜i,m →r˜ai,m. The parameter
γ = rB rA
<1 (5)
is very important, as the equilibrium BNSLs22–24,26are mostly determined by this parameter.
Another important parameter is the softness asymmetry,24 defined as
SAB =
rH B −RB
rH A −RA
, (6)
note that SAB can be larger or smaller than one. A summary of all the cases considered is
given in Table. 3 showing that our study explores γ values in the range [0.535,1.0] and SAB
[image:13.612.85.526.473.643.2]values between [0.58,1.9].
Figure 6: Representative examples of calculated PMFs show good agreement with a naive prediction based on the sum of symmetric cases.
Figure 7: Au201(SC9)80NC (purple) and Au140(SC12)62NC (gray) atFmin. There is negligible
interdigitation, and clear vortices and planar interaction surfaces are apparent.
Figure 8: Surface projections of two distinct asymmetric cases, where SAB < 1 (left) and
SAB > 1 (right). The surface distributions shift in location relative to the corresponding
surfaces for the symmetric case of the same particle. This shift always occurs towards large ¯
[image:14.612.98.516.463.613.2]the remaining cases shown in the SI. Due to the lack of chain interdigitation, the mid-plane
between two NCs in a symmetric pair defines the interaction plane where space left(right)
of the plane contains all the chains of the left(right) NC. For an asymmetric NC pair, there
is still negligible interdigitation, but the interaction plane requires a precise definition. We
calculate this plane by considering an arbitrary C-united atom in the A-NC and computing
the closest C-united atom in the B-NC, and vice-versa. Iterating over all C-united atoms
in this way, a sub-group of C-united atoms can be selected for each NC (CA, CB). For each
unique atom inCA, the vector joining it to the center of the A NC is computed and projected
along the line connecting the A and B centers. We then used all these projections to define
a histogram that is basically Gaussian. The average of this Gaussian µ effectively defines
the location of the interaction plane, and its standard deviation σ gives an idea of plane
[image:15.612.95.525.371.540.2]roughness or curvature.
Figure 9: Histograms defining the interaction plane for the Au140(SC9)62NC interacting with
Au140(SC9)62(cyan), Au1289(SC12)258(red), Au201(SC19)80 (blue), Au1289(SC19)258(green).
The location and roughness of the interaction plane are realized in the surface histograms as the mean and standard deviation, respectively. SAB decreases from the top left to bottom
left cases, circling clockwise.
The location of the interaction plane is not a function of the NC radius rA, rB, but
rather, is a function of the softness asymmetry SAB. Vortex textures can be realized as a
vectors experience an increase in curvature. The location of this structural curvature change
along the ligand chain determines the location of the interaction plane relative to the NC
grafting surface. In general, chains on the ”softer” NC show outward movement of curvature
location along the chain, while chains in the ”harder” NC experience an opposite effect. This
is illustrated in Fig. 8, where relative to the symmetric case, the plane of interaction moves
away from the ”softer” NC, irrespective of which NC has the largest radius. The softness
asymmetry also correlates well with the width, as shown in Fig. 9, where we compare four
cases of an asymmetric pair interaction containing an Au140(SC9)62 NC. These cases show
increasing σ values corresponding with SAB = 1.0,0.866,0.635,0.576, again, irrespective of
which NC has the largest radii. These considerations show that the “atomic orbitals” for
asymmetric NCs are vortices whose detailed structure is a function of the softness asymmetry
SAB.
Discussion
0
1
2
3
λ
(L/R)
1
.
0
1
.
5
2
.
0
2
.
5
τ
(R
min/D)
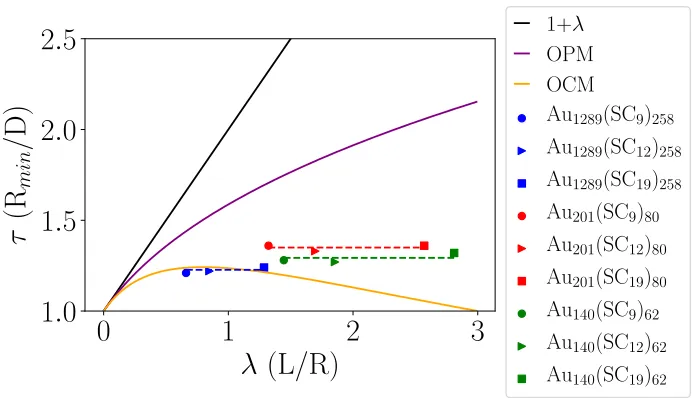
1+λ OPM OCMAu1289(SC9)258
Au1289(SC12)258
Au1289(SC19)258
Au201(SC9)80
Au201(SC12)80
Au201(SC19)80
Au140(SC9)62
Au140(SC12)62
[image:16.612.132.480.428.627.2]Au140(SC19)62
General Considerations
The location of the minima of the PMF, 2˜ri,mfor symmetric NC, is expected to be described
by the OCM formula, but instead, a clear breakdown is observed for large curvature, that
is λ > 1, as evident from Fig. 10. Interestingly, as Table 1 shows, the distance is very
sensitive to the NC core radius, but quite insensitive to the chain length L. This is because
for sufficiently large curvature, the chains within the inner OCM cone (see previous section),
extend beyond the actual OCM cone, and therefore the melt condition is not satisfied. A
formula for 2˜ri,m can be elucidated based on our observations, where the separation is given
by the adjusted OCM formula
τA−OCM =
Ri+ ∆i,m
Ri
= 1 + ∆i,m Ri
(7)
where ∆i,m = ri,m − Ri is directly determined by our simulations. The function ∆i,m is
related to the location of gauche chain configurations (broken dihedrals), with values of 5, 7
[image:17.612.77.541.526.653.2]and 9 ˚A for Au140(SCm)62, Au201(SCm)80 and Au1289(SCm)258, respectively.
Table 4: Predicted values of ˜dm are not simply the sum of symmetric midpoint values, but
correspond to differences in softness. In all cases, the softer NC of the pair increases its asymmetric radius while the harder NC decreases its asymmetric radius, where asymmetric radii are calculated as averages of surface distributions. Rows shaded gray correspond to cases where NC B is softer than NC A.
Asymmetric Pair r˜B,m(˚A)˜rB,ma (˚A)
˜
ra
B,m−r˜B,m ˜
rB,m r˜A,m(˚A) ˜r
a A,m(˚A)
˜
ra
A,m−˜rA,m ˜
rA,m
Au140(SC9)62 - Au1289(SC19)258 11.90 9.32 -0.22 25.20 28.2 0.12
Au140(SC9)62 - Au1289(SC12)258 11.90 10.9 -0.08 24.75 25.7 0.04
Au140(SC9)62 - Au201(SC19)80 11.90 10.1 -0.15 13.80 17.2 0.25
Au140(SC19)80 - Au1289(SC9)258 12.25 14.4 0.18 24.50 23.9 -0.02
Au1289(SC12)258 - Au1289(SC19)258 24.75 23.4 -0.05 25.20 27.0 0.07
Au201(SC19)80 - Au1289(SC9)258 13.80 15.8 0.14 24.50 23.0 -0.06
Table 5: Free Energy values at the PMF minimum. ∆F = Fmina −
1
2(Fmin,A +Fmin,B) is
always positive, indicating that the system prefers like particle interactions over asymmetric ones in the pair case. Results are given in units ofkBT where T =Tm.
Asymmetric Pair Fa
min Fmin,A Fmin,B ∆F F∆aF
min
Au140(SC9)62 - Au1289(SC19)258 -141 -77 -289 42.0 0.30
Au140(SC9)62 - Au1289(SC12)258 -96 -77 -148 16.5 0.17
Au140(SC9)62 - Au201(SC19)80 -115 -77 -207 27.0 0.23
Au140(SC19)80 - Au1289(SC9)258 -120 -181 -88 14.5 0.12
Au1289(SC12)258 - Au1289(SC19)258 -213 -148 -289 5.5 0.03
Au201(SC19)80 - Au1289(SC9)258 -136 -207 -88 11.5 0.08
Au201(SC9)80 - Au140(SC12)62 -87 -75 -115 8.0 0.09
[image:18.612.190.424.420.598.2].
For asymmetric NCs the minimum of the PMFdmis well predicted by the simple formula:
dm = ˜rA,m+ ˜rB,m, (8)
shown clearly in Table 3. Note, however, that the location of the interacting plane is not a
function of the radius, but rather, is a function of the softness asymmetry, as is evident in
Table 4. We propose a mechanism that drives the plane location change, shown in Figure 11,
based on solving for a plane of interaction with equal contributed area from each NC. This
is an indication of the system’s preference for the symmetric case, supported by the free
energy information in Table 5. We would expect this mechanism to have some degree of
universality, so that any sufficiently short organic ligand would act in a similar manner. The
OTM model supports this claim, as it makes no assumption of ligand type and shows good
agreement with both hydrocarbon and polymer based experimental systems.26
Additional free energy contributions
There are a number of effects that have been neglected in our calculations:
• Core-Core VdW forces.
• Dipole moments.
• Finite cut-off in simulations.
The core-core VdW energy is given by28,39
Uc−c(ρ) =−
AH
6
2RARB
ρ2−(R
A+RB)2
+ 2RARB
ρ2−(R
A−RB)2
+ log
ρ2−(R
A+RB)2
ρ2−(R
A−RB)2
(9)
where the Hamaker constant for gold is AH = (3− 5) ·10−19J,39 see Table 11.2. The
calculations shown in Table 6 are computed with the value AH = 5·10−19J. Note that the
but typically less, rendering our conclusions valid in these cases also. There is usually an
attenuation of Hamaker theory with solvent,39 but solvent effects will not be considered in
this study.
The dipole-dipole moment is given by elementary electrostatics
Ud−d(ρ) =−
~pA·~pB−3(~pA·~n)(~pB·~n)
4π0ρ3
, (10)
where~nis the unit vector joining the centers of A and B. The dipole moment of a CdSe and
PbSe NC is estimated to be of the order of p ≈100D.40–42 Hopefully, ab-initio calculations
will be able to provide a more rigorous estimate for this number. For the calculations shown
in Table 6 we assume a constant dipole density of 100D in a sphere of diameter 5.5 nm,
consistent with Ref.42
All our simulations were conducted with a finite cut-off rcut. A cut-off free result can be
obtained by adding the correction
Ucut(ρ) =
Z
d3rd3r0
ϑ(|r−r0| −rcut)VLJ(|r−r0|)ρH(r)ρH(r0) (11)
where ϑ(x) is the Heaviside function, VLJ is the Lennard-Jones potential between two
hy-drocarbon groups and ρH(r) is the hydrocarbon equilibrium number density.
The magnitude of the different contributions from neglected effects is summarized in
Table 6, which clearly shows none of the effects modify any of the previous conclusions.
An order of magnitude for the magnitude of the Van Der Waals attraction is obtained by
computing the attraction between two planes of area Ac separated a distance D.
U =−Ah
12π Ac
D2 ≈
Ah
12π
(2˜rmtan(χOCM))2
D2 ≈
Ah
12π
(2˜rm)2
D2 (12)
Here, we assumed that the area of contact is 4˜r2tan(χ
over the range of systems studied, which are of the same order of magnitude as the values
listed in Figure 3 for the internal energy, up to a factor of ≈ 4 or 5 that we attribute to
neglected roughness and boundary contributions.
Another possible effect is the reduction in configuration space of hydrogen motion as
the chains form vortices. This effect is ignored in our calculations, as our simulation used
a united model, but might enhance the entropic repulsion. Without a model describing
explicit hydrogens, this effect cannot be properly estimated. However, we argue that all
chains within a given vortex are separated sufficiently, so that motion of hydrogen atoms is
not significantly hampered and the effect should be small. More detailed atomistic models
[image:21.612.77.540.366.517.2]will hopefully address this issue.
Table 6: Corrections to free energy by the different contributions: c-c Eq. 9, d-d Eq. 10, cut Eq. 11 in units of kBTm and in % relative to Fmin.
NC Fmin c-c d-d rcut c-c % d-d % rcut %
Au140(SC9)62 -77 -2.3 ±0.03 -2 3.0 0.04 2.6
Au140(SC12)62 -115 -2.4 ±0.03 -4 2.1 0.03 3.5
Au140(SC19)62 -181 -1.7 ±0.03 -8 0.9 0.02 4.4
Au201(SC9)80 -75 -1.2 ±0.03 -3 1.6 0.04 4.0
Au201(SC12)80 -118 -1.5 ±0.04 -5 1.3 0.03 4.2
Au201(SC19)80 -207 -1.3 ±0.03 -12 0.6 0.02 5.8
Au1289(SC9)258 -88 -4.4 ±0.38 -5 5.0 0.43 5.7
Au1289(SC12)258 -148 -3.9 ±0.33 -8 2.6 0.22 5.4
Au1289(SC19)258 -289 -3.2 ±0.33 -21 1.1 0.11 7.3
Conclusions
The main result of this paper is the identification of vortex configurations, see Figs. 5 and 7,
as characteristic ligand structures that determine the bonding between two NCs. In this way,
these vortices play the same role as “atomic orbitals” in determining the covalent bonding
different sizes through a single parameter, the softness asymmetry Eq. 6, in such a way that
for the softer NC in an asymmetric pair, ˜ra
i,m > r˜i,m. The equilibrium separation distance
is consistent with the OCM formula Eq. 3 for small curvature λ < 1 only, but for large
curvature λ >1 the data is consistent with a formula based on the positions of the broken
dihedrals, independent of ligand length Eq. 7.
The binding free energies are very strong, of the order of several hundreds of kBT with
a significant energy-entropy cancellation, and other effects, namely Van der Waals forces
between cores or dipole-dipole interactions become negligible at this scale, see Table 6. Thus,
the binding of two NCs is determined by the structure of the ligands, that is the vortices,
in complete agreement with the predictions of the OTM.22,26 In extending these results to
BNSLs, it should be noted that the OTM shows that equilibrium distances are dependent
on coordination in the local environment. Therefore, the binding energy of two NCs within
a superlattice is generally lower than that for two isolated ones, but still of the order of
several hundred kBT, see Fig. 3. The relative contribution of the other effects, see Table 6
becomes even smaller, as those decrease much faster with increasing separation. Although
the simulations presented have assumed cores consisting of gold atoms, Table 6 shows that
the validity of our results extends to any type of core, regardless of chemical composition or
physical property, whether insulator, semiconductor or conductor.
Solvent effects have been ignored in our calculations. This is because they are mostly
irrelevant for equilibrium, as BNSLs are completely free from solvent. Yet, such effects are
relevant during the dynamics of self-assembly. In systems assembled by solvent evaporation,
for example, the PMF is repulsive in solvent, and only becomes attractive at low solvent
content, a point nicely illustrated in Ref.31 This critical balance between NC repulsion and
attraction driven by solvent concentration needs to be addressed to obtain complete control
of crystal quality during the process of solvent evaporation.
evap-component lattices are observed. As shown in Table 5, our results indicate that mixing of
two different isolated NCs is not a favorable process. Still, as predicted by the OTM, there
are many other considerations that may favor mixing, which we are currently investigating.
There are a number of relevant experimental parameters that we have not investigated:
chains with different degrees of unsaturation, the low curvature limit λ << 1 and smaller
grafting densities. Based on our detailed calculations, inclusions of those effects are unlikely
to modify any of the conclusions in this paper, although may result in some quantitative
differences that we will report in the near future.
Materials and Methods
Simulations were carried out in parallel on the GPU resources of the XSEDE Comet cluster
at SDSC. MPI was handled using mpi4py43 across 8 GPUs. MD simulations were carried
out with the HOOMD-blue44,45 MD package in the canonical ensemble at a temperature of
Tm = 387K and non-bonded cut-off of 24˚A. During MD simulations, the Au and S atoms
of each nanocrystal were treated as a rigid body by standard HOOMD-blue commands46 to
preserve the sulfur locations at the “pinning sites” first discussed by Luedtke.47
Pair potential simulations adhered to the following protocol. First, two NCs, bonded at
their centers by a harmonic bond, are simulated at an equilibrium bond distance where the
NCs are not able to interact with one another through the non-bonded interaction cutoff.
Then, the equilibrium bond distance is changed in a stepwise manner, decreasing gradually
in distance to cover the entire range of the pair potential we wish to calculate. At each bond
distance, NCs are allowed to equilibrate, and a configuration to be used in future MPI jobs
is outputted. The configurations created during this stepwise process are then used as initial
states for the further calculation of each window, which is done in parallel.
Simulations in parallel undergo a parallel tempering routine that allows for
landscape. Final data is taken periodically from simulations 10 million timesteps in length.
The PMF is reconstructed by the WHAM method.48 All the simulations, analysis, etc. are
completely reproducible as they are included as part of the HOODLT49 software. Further
details are provided in SI.
Supporting Information Available
Supplementary information contains one file with:
• Description of the force field and other simulation details.
• Example of the WHAM method and reconstruction of PMF.
• Explanation of parallel tempering method.
• Formulas used to compute the internal energy and Entropy.
• All calculated PMF plots.
This material is available free of charge via the Internet at http://pubs.acs.org/.
Acknowledgement
We acknowledge many discussions and clarifications of their work with M. Boles, D. Talapin
and D. Vaknin. G. Galli provided us insights into the magnitude of dipole contributions. This
work used the Extreme Science and Engineering Discovery Environment (XSEDE), which is
supported by National Science Foundation grant number ACI-1548562. Our project within
XSEDE is supported by grant TG-MCB140071. C.W was initially supported by a
DOE-SULI program and later by NSF. He was in charge of running and analyzing simulations,
de-the polymer work supported by DOE U.S. Department of Energy (DOE), Office of Science,
Basic Energy Sciences, Materials, Materials Science and Engineering Division and performed
at the Ames Laboratory, which is operated for the US DOE by Iowa State University under
contract number DE-AC02-07CH11358. A.T. designed the project, contributed to the
soft-ware HOODLT and his work is supported by NSF, DMR-CMMT 1606336 “CDS&E: Design
Principles for Ordering Nanoparticles into Super-crystals”. AT wants to acknowledge the
Aspen Center for Physics where some of this work was performed, which is supported by
NSF, PHY-1607611
References
1. Whetten, R. L.; Shafigullin, M. N.; Khoury, J. T.; Schaaff, T. G.; Vezmar, I.;
Al-varez, M. M.; Wilkinson, A. Crystal Structures of Molecular Gold Nanocrystal Arrays.
Acc. Chem. Res. 1999,32, 397–406.
2. Nykypanchuk, D.; Maye, M. M.; van der Lelie, D.; Gang, O. DNA-Guided Crystallization
of Colloidal Nanoparticles. Nature 2008, 451, 549–552.
3. Park, S. Y.; Lytton-Jean, A. K. R.; Lee, B.; Weigand, S.; Schatz, G. C.; Mirkin, C. A.
DNA-Programmable Nanoparticle Crystallization. Nature 2008, 451, 553–556.
4. Zhang, H.; Wang, W.; Mallapragada, S.; Travesset, A.; Vaknin, D. Macroscopic and
Tunable Nanoparticle Superlattices. Nanoscale 2017, 9, 164–171.
5. Zhang, H.; Wang, W.; Mallapragada, S.; Travesset, A.; Vaknin, D. Ion-Specific Interfacial
Crystallization of Polymer-Grafted Nanoparticles. J. Phys. Chem. C 2017,121, 15424–
15429.
6. Zhang, H.; Wang, W.; Akinc, M.; Mallapragada, S.; Travesset, A.; Vaknin, D. Assembling
and Ordering Polymer-Grafted Nanoparticles in Three Dimensions.Nanoscale 2017,9,
7. Shevchenko, E. V.; Talapin, D. V.; O’Brien, S.; Murray, C. B. Polymorphism in AB13
Nanoparticle Superlattices: An Example of Semiconductor-Metal Metamaterials.J. Am.
Chem. Soc. 2005, 127, 8741–8747.
8. Shevchenko, E. V.; Talapin, D. V.; Murray, C. B.; O’Brien, S. Structural
Characteriza-tion of Self-Assembled MultifuncCharacteriza-tional Binary Nanoparticle Superlattices.J. Am. Chem.
Soc. 2006, 128, 3620–3637.
9. Chen, Z.; OBrien, S. Structure Direction of II-VI Semiconductor Quantum Dot Binary
Nanoparticle Superlattices by Tuning Radius Ratio. ACS Nano 2008,2, 1219–1229.
10. Talapin, D. V.; Shevchenko, E. V.; Bodnarchuk, M. I.; Ye, X.; Chen, J.; Murray, C. B.
Quasicrystalline Order in Self-Assembled Binary Nanoparticle Superlattices. Nature
2009,461, 964–967.
11. Bodnarchuk, M. I.; Kovalenko, M. V.; Heiss, W.; Talapin, D. V. Energetic and Entropic
Contributions to Self-Assembly of Binary Nanocrystal Superlattices: Temperature as
the Structure-Directing Factor. J. Am. Chem. Soc. 2010,132, 11967–11977.
12. Evers, W. H.; Nijs, B. D.; Filion, L.; Castillo, S.; Dijkstra, M.; Vanmaekelbergh, D.
Entropy-Driven Formation of Binary Semiconductor-Nanocrystal Superlattices. Nano
Lett. 2010,10, 4235–4241.
13. Ye, X.; Chen, J.; Murray, C. B. Polymorphism in Self-Assembled AB6 Binary
Nanocrys-tal Superlattices. J. Am. Chem. Soc. 2011, 133, 2613–2620.
14. Boneschanscher, M. P.; Evers, W. H.; Qi, W.; Meeldijk, J. D.; Dijkstra, M.;
Van-maekelbergh, D. Electron Tomography Resolves a Novel Crystal Structure in a Binary
Nanocrystal Superlattice. Nano Lett. 2013, 13, 1312–1316.
16. Yang, Z.; Wei, J.; Bonville, P.; Pileni, M.-P. Beyond Entropy: Magnetic Forces Induce
Formation of Quasicrystalline Structure in Binary Nanocrystal Superlattices. J. Am.
Chem. Soc. 2015, 137, 4487–4493.
17. Ye, X.; Zhu, C.; Ercius, P.; Raja, S. N.; He, B.; Jones, M. R.; Hauwiller, M. R.; Liu, Y.;
Xu, T.; Alivisatos, A. P. Structural Diversity in Binary Superlattices Self-Assembled
from Polymer-Grafted Nanocrystals. Nat. Commun. 2015,6, 10052.
18. Boles, M. A.; Talapin, D. V. Many-Body Effects in Nanocrystal Superlattices: Departure
from Sphere Packing Explains Stability of Binary Phases.J. Am. Chem. Soc.2015,137,
4494–4502.
19. Boles, M. A.; Engel, M.; Talapin, D. V. Self-Assembly of Colloidal Nanocrystals: From
Intricate Structures to Functional Materials. Chem. Rev. 2016,116, 11220–11289.
20. Murray, M. J.; Sanders, J. V. Close-Packed Structures of Spheres of Two Different Sizes
II. The Packing Densities of Likely Arrangements. Philos. Mag. A. 1980, 42, 721–740.
21. Chen, Z.; Moore, J.; Radtke, G.; Sirringhaus, H.; O’Brien, S. Binary Nanoparticle
Super-lattices in the Semiconductor-Semiconductor Systems: CdTe and CdSe. J. Am. Chem.
Soc. 2007, 129, 15702–15709.
22. Travesset, A. Topological Structure Prediction in Binary Nanoparticle Superlattices.Soft
Matter 2017, 13, 147–157.
23. Travesset, A. Binary Nanoparticle Superlattices of Soft-Particle Systems. Proc. Natl.
Acad. Sci. 2015, 112, 9563–9567.
24. Horst, N.; Travesset, A. Prediction of Binary Nanoparticle Superlattices from Soft
Po-tentials. J. Chem. Phys. 2016,144, 014502.
25. Tkachenko, A. V. Generic Phase Diagram of Binary Superlattices.Proc. Natl. Acad. Sci.
26. Travesset, A. Soft Skyrmions, Spontaneous Valence and Selection Rules in Nanoparticle
Superlattices. ACS Nano 2017, 11, 5375–5382.
27. Landman, U.; Luedtke, W. D. Small is Different: Energetic, Structural, Thermal, and
Mechanical Properties of Passivated Nanocluster Assemblies. Faraday Discuss. 2004,
125, 1–22.
28. Schapotschnikow, P.; Vlugt, T. J. H. Understanding Interactions between Capped
Nanocrystals: Three-Body and Chain Packing Effects. J. Chem. Phys. 2009, 131,
124705.
29. Schapotschnikow, P.; Pool, R.; Vlugt, T. J. H. Coarse-Grained Model for Gold
Nanocrys-tals with an Organic Capping Layer. Mol. Phys.2007, 105, 3177–3184.
30. Schapotschnikow, P.; Pool, R.; Vlugt, T. J. H. Molecular Simulations of Interacting
Nanocrystals. Nano Lett. 2008,8, 2930–2934.
31. Jabes, B. S.; Yadav, H. O. S.; Kumar, S. K.; Chakravarty, C. Fluctuation-Driven
Anisotropy in Effective Pair Interactions between Nanoparticles: Thiolated Gold
Nanoparticles in Ethane. J. Chem. Phys. 2014,141, 154904.
32. Yadav, H. O. S.; Shrivastav, G.; Agarwal, M.; Chakravarty, C. Effective Interactions
between Nanoparticles: Creating Temperature-Independent Solvation Environments for
Self-Assembly. J. Chem. Phys. 2016,144, 244901.
33. Milowska, K. Z.; Stolarczyk, J. K. Role of Ligand-Ligand vs. Core-Core Interactions in
Gold Nanoclusters. Phys. Chem. Chem. Phys. 2016, 18, 12716–12724.
34. Lange, A.; Danecker, F.; Bauer, G.; Gribova, N.; Gross, J. Different Ways of Looking at
the Force between Two Nanocrystals. J. Chem. Phys. 2015, 143, 244115.
36. Luedtke, W. D.; Landman, U. Structure and Thermodynamics of Self-Assembled
Mono-layers on Gold Nanocrystallites. J. Phys. Chem. B 1998, 102, 6566–6572.
37. Tachibana, M.; Yoshizawa, K.; Ogawa, A.; Fujimoto, H.; Hoffmann, R. Sulfur/Gold
Orbital Interactions which Determine the Structure of Alkanethiolate/Au(111)
Self-Assembled Monolayer Systems. J. Phys. Chem. B 2002, 106, 12727–12736.
38. Hautman, J.; Klein, M. L. Simulation of a Monolayer of Alkyl Thiol Chains. J. Chem.
Phys. 1989, 91, 4994–5001.
39. Israelachvili, J. Intermolecular and Surface Forces; Academic Press: London, 2000.
40. Shim, M.; Guyot-Sionnest, P. Permanent Dipole Moment and Charges in Colloidal
Semi-conductor Quantum Dots. J. Chem. Phys. 1999, 111, 6955–6964.
41. Li, L.-s.; Alivisatos, A. P. Origin and Scaling of the Permanent Dipole Moment in CdSe
Nanorods. Phys. Rev. Lett. 2003,90, 097402.
42. Talapin, D. V.; Shevchenko, E. V.; Murray, C. B.; Titov, A. V.; Kral, P. Dipole-Dipole
Interactions in Nanoparticle Superlattices. Nano Lett. 2007,7, 1213–1219.
43. Dalcin, L.; Paz, R.; Storti, M. MPI for Python. J. Parallel Distrib. Comput. 2005, 65,
1108–1115.
44. Hoomd-Blue. http://codeblue.umich.edu/hoomd-blue/, Accessed on 24-10-2017.
45. Anderson, J. A.; Lorenz, C. D.; Travesset, A. General Purpose Molecular Dynamics
Simulations Fully Implemented on Graphics Processing Units. J. Comput. Phys. 2008,
227, 5342–5359.
46. Nguyen, T. D.; Phillips, C. L.; Anderson, J. A.; Glotzer, S. C. Rigid Body Constraints
Realized in Massively-Parallel Molecular Dynamics on Graphics Processing Units.
47. Luedtke, W. D.; Landman, U. Structure, Dynamics, and Thermodynamics of Passivated
Gold Nanocrystallites and Their Assemblies. J. Phys. Chem. 1996, 100, 13323–13329.
48. Kumar, S.; Rosenberg, J. M.; Bouzida, D.; Swendsen, R. H.; Kollman, P. A. The
Weighted Histogram Analysis Method for Free-Energy Calculations on Biomolecules.
I. The Method. J. Comput. Chem.1992,13, 1011–1021.
49. Travesset, A. Phase Diagram of Power Law and Lennard-Jones Systems: Crystal Phases.