Inzinerine Ekonomika-Engineering Economics, 2015, 26(1), 67–74
The Analysis of FMCG Product Availability in Retail Stores
Aleksandar Grubor, Nikola Milicevic
University of Novi Sad
Segedinski put 9-11, Subotica 24000, Serbia
E-mail. [email protected]
,
[email protected]http://dx.doi.org/10.5755/j01.ee.26.1.7070
Seeking to reduce consumer purchasing effort, retailers strive to provide adequate product availability levels in retail stores. Otherwise, consumers may find themselves in stock-out situation, which may be a waste of their time, money and energy. As the mentioned situation intends to make a negative impact on the business performance of retailers and their suppliers, the issue of on-shelf product availability deserves particular attention. This article analyses this issue from the aspect of certain characteristics of product sales. Product availability, expressed by means of out-of-stock rate, is compared within various categories of sales variation and speed of turnover variables. In addition to these characteristics, product availability is also analysed from the aspect of various retail formats. The results have indicated that products with the highest sales variation, as well as slow turning products, are the most problematic in terms of on-shelf availability; in other words, they are characterised by the highest out-of-stock (OOS) rates. On the other hand, unlike large-scale retail formats, average store availability is the lowest in superettes, which indicates that the average OOS rate declines with the size of retail formats. In addition to serving as a basis for further research related to product availability in retailing, the given results may be used by retail managers when optimising customer service levels.
Keywords: product availability, out-of-stock, sales variation, speed of turnover, retail store.
Introduction
The development of technology over the past several decades has been accompanied by an increase in the amount of information possessed by customers, whose needs and demands are becoming the initial point of business activities in marketing channels. Inadequate comprehension of these needs may not only result in reduced efficiency, but also cause conflicts in marketing channels (Gudonaviciene et al., 2008, Banyte et al., 2011).
In such a business setting, retailers strive to enhance both inventory turnover and customer service (Ellram et al., 1999). Consequently, providing adequate product availability level, which according to Trautrims et al. (2009) is used for manifesting customer service in retail stores, features as one of the crucial tasks, facing not only retailers but also the other supply chain members (Fernie & Sparks, 2009). In cases when the above mentioned task is not fulfilled, customers may be faced with the out-of-stock problem, placing them in a situation where, in addition to wasted time, money and energy, they can also suffer personal disappointment in not achieving the desired goal (Ehrenthal et al., 2014), i.e. purchase a product of the desired category, shape and size. Due to this problem, they lose 21 % of their allocated time, while every 13th product on their shopping list is not located on the designated place on the isle (Gruen, 2007). According to (Campo et al., 2000), customers in such situations are exposed to not only transaction and substitution costs (caused by searching for alternative solutions), but also opportunity costs (if the purchase does not occur at all).
Based on the report published by Roland Berger Consultants (2003), besides shorter till queues (67 %) and
more frequently organised promotion activities (52 %), higher product availability in retail stores (30 %) features as one of the most significant consumer demands. The results of the Consumer Trends project (EFMI & CBL, 2005) indicate that, out of the six most frequent problems faced by customers, as many as three are related to stock-outs (the classical product stock-stock-outs, promotion product stock-outs and stock-outs due to reduction in assortment). Similar results were obtained in the Supermarket Guru Consumer Panel (2011) study, where 28 % of customers consider stock-outs to be the greatest problem in shopping.
In addition to shoppers, stock-outs in retail stores tend to make a negative impact on the business performance of retailers and their suppliers. The degree of impact on individual members of the supply chain depends primarily on the customer response in particular situation. Faced with an out-of-stock (OOS) situation, they may opt for substitution (of a brand, item or a retail store), delaying or giving up the purchase (Corsten & Gruen, 2004). The least favourable response for both retailers and suppliers is giving up the purchase. In that case, both members of the supply chain will lose a part of sales, directly or indirectly. According to Roland Berger Consultants Report, (2003), 9% of shoppers tend to opt for this response, thus costing all European supply chains together over 4 billion euros a year. Sales reduction will also occur due to retail store switching or purchasing a cheaper substitute (item or brand). (Gruen & Corsten 2007) estimated direct sales loss to up to 4 % (including both retailers and their suppliers). Also, each reduction in product availability by 3 % may contribute to sales loss by 1 % (ECR Rus, 2009).
marketing efforts as well as investments into information and operations systems (Ehrenthal et al., 2014). It can cause not only occurrence of errors in ordering and logistics operations, but it can also decrease the effects of promotional activities.
Moreover, frequent out-of-stock situations in retail stores threaten the area of business loyalty. Whereas producers are faced with the problem of brand loyalty, retailers are exposed to the risk of losing loyal customers. If the desired brand is out-of-stock, customer may buy different one and become locked-in to that rival brand (Goldfarb, 2006). On the other hand, the stock-out situation can lead to longer term sale losses due to the decrease of customer loyalty and satisfaction (Anderson et al., 2006; Musalem et al., 2010). One should also not neglect the costs of disrupting the relationship between the members of the supply chain, or the costs of hiring additional staff in charge of resolving this problem.
Bearing in mind all negative effects of low product availability, i.e. out-of-stock situation, especially for retailers, FMCG product availability has been studied from the aspect of different product and/or store characteristics (Angerer, 2005; Fernie & Grant, 2008; Aastrup & Kotzab, 2009; Eroglu et al., 2011). The scientific problem of this article is determination of FMCG product availability level in the context of product sales indicators and store formats. The subject of this article includes product availability (presented through out-of-stock rate), sales coefficient of variation and speed of turnover for 80 different FMCG products in 30 retail stores.
The aim of this research is to compare FMCG product availability from the aspects of product characteristics (sales variation, speed of turnover) and store formats.
Research methods are based on comparative analysis of scientific literature as well as on empirical analysis, with the application of POS estimation method (for calculating out-of-stock rates), statistical techniques (One-Way ANOVA and Welch ANOVA) and qualitative interviews conducted with store managers and supply chain directors. Novelty is manifested in the fact that the research results would serve as a significant information resource for retailers’ and their suppliers’ decision making related to increasing product availability and organising logistic operations in retail stores.
Literature Review
Product availability in retail stores is considered mostly through the stock-out problem (Roland Berger Consultants, 2003). According to (Gruen & Corsten, 2007), stock-outs occur when the product is unavailable to customers for a certain period of time (from the moment the last unit is removed from the shelf to its replenishment). It can be expressed in percentage, as the stock-out rate (Che et al., 2012). Its average value amounts to 8,3 % at the global level, 8,6 % in Europe, and 7.8% in the United States (Gruen, 2007). The situation is somewhat better in Asia and Australia, where it does not exceed 5 % (from 1 % in Japan to 18 % in Thailand) (ECR AP, 2012).
The first publications on the issue of retail store stock-outs appeared in the 1960s and 1970s. Most authors in this period were primarily focused on customer response to
such situations (Peckham, 1963; Walter & Grabner, 1975; Schary & Christopher, 1979). However, with the increase in concentration on the retail situation and strengthening the role of retailers in the marketing channels, the stock-out problem gains significance. Unlike earlier research, when the dominant position was taken up by producers and their brands, the emergence of contemporary retail system and the growth in the importance of customer loyalty resulted in the creation of a far more complex approach to the analysis of the given problem (Fernie & Sparks, 2009). The need to resolve has launched numerous initiatives by major production and retail companies. The most notable among these is the Efficient Consumer Response (ECR) concept, stemming from the Quick Response (QR) strategy. A variety of research, case studies and conferences dealing with the stock-out issue are conducted under the auspices of ECR organisations (ECR Europe, ECR Baltic, ECR Australasia, and ECR Asia Pacific).
Within the ECR Baltic organisation, with the technical support of its members GS1 Lithuania, GS1 Latvia, 1WorldSync and Edisync Estonia, the Baltic pilot project was implemented in 2013, related to the application of the RIMI/ERP system in retail supply chains (Staeder, 2013). In addition to improvements to the ordering process and shortening the stock delivery time, the positive effects of its application are also manifested in the decline in the stock-out rate from 8 % to 3 %.
The out-of-stock problem in retail trade has been analysed from various aspects. Attention has been devoted to measuring (Roland Berger Consultants, 2003; Gruen & Corsten, 2007), identifying (Papakiriakopoulos et al., 2008; Papakiriakopoulos & Doukidis, 2011), main root causes (McKinnon et al., 2007; Fernie & Grant, 2008), effects (Anderson et al., 2006; Gruen, 2007; Musalem et al., 2010), and specifics of customer responses in OOS situations (Sloot et al., 2005; van Woensel et al., 2007; Zinn & Liu, 2008). Besides brick-and-mortar conditions, this problem has been analyzed in an online context too (Breugelmans et al., 2006; Jing & Lewis, 2011; Pizzi & Scarpi, 2013).
stores of a European retail chain and 100 different FMCG products, (Angerer, 2005) partially confirmed the hypothesis that products with higher sales variations also tend to have higher stock-out rates. The market share of individual products has also been in the focus of consideration of some authors. In a study conducted on a sample of 4 categories of consumer goods in two retail chains, (Bayle-Tourtoulou et al., 2006) confirmed the impact of this variable on “total” and “partial” stock-outs. In addition to sales performance indicators (sales frequencies, sales variance and market share), other product features, including packaging (Eroglu et al., 2011), price, item size and shelf life (Angerer, 2005) are also related to their levels of availability in retail chains.
Same as in the case of product categories, OOS rates also differ between retail stores. According to Roland Berger Consultants (2003), in terms of sales formats, product availability is slightly higher (by 3 %) in supermarkets than in hypermarkets. They see the root of it in a less complex assortment, more employees per stock keeping unit (SKU), better salesroom management and more FMCG products. However, when writing about product availability, some authors (Fernie & Grant, 2008; Aastrup & Kotzab, 2009), give preference to larger retail stores. (Aastrup & Kotzab, 2009) performed a comparative analysis of OOS rates on a sample of 17 retail stores (8 larger and 9 smaller), where higher stock-out rates were recorded in smaller retail stores. Similarly, Fernie and Grant (2008) (in the research which consisted of a single case study of the focal retailer, where visits and interviews were conducted at nine stores) have also reported lower level of product availability in smaller stores, compared to larger ones. The results of mentioned (Roland Berger Consultants, 2003; Aastrup & Kotzab, 2009), but other studies as well (Gruen et al., 2002; Stolzle & Placzek, 2004) have shown that the stock-out rate also differs between retail stores within the same format. This is also contributed to by their characteristics in terms of assortment, size and number of employees. According to (Angerer, 2005), retail stores with too many or too few staff per square meter of salesroom, as well as those with high SKU density, have higher stock-out rates. As regards product availability, the same author gives advantage to retail stores with smaller storage space and higher managerial experience (expressed in the number of years of employment at the given retail store).
Research Methodology and Definition of Variables
In our study, we used 80 different FMCG products classified into 10 basic categories: 6 personal hygiene care products, 6 household care products, 6 soft drinks, 8 products made from sugar (including sugar), 4 edible oils and fats, 12 cereal-based products and flour, 11 spices and aromas, 6 coffee brands, 15 sweets, and 6 salty snacks. We chose several products within each of the categories, devoting attention to both best-sold and products of special importance for customers (difficult to substitute).
The research was conducted in 30 retail stores of two retail chains on the territory of Serbia, where all the sampled FMCG products had to be present (on the stock list) in each store. In terms of size, all the stores were classified into three groups: superettes (up to 400 square
meter salesroom), supermarkets (400–2000 square meter) and hypermarkets (over 2000 square meter) (Lovreta et al., 2009).
Table 1
Retail stores
Retail formats N Salesroom (m
2
)
Mean (s.d.) Median
Hypermarkets 10 5,268 3,226 4,120 Supermarkets 12 909,1 402,33 909,36 Superettes 8 277,69 61,88 258,08
Total 30 2,194 2,871,5 1,024,3
In order to achieve a more detailed analysis of product availability, during the research period we conducted qualitative interviews with managers of these stores and supply chain directors. Direct and telephone conversations were used for considering the key root causes and specific features of this problem in different retail formats.
In this analysis we used data obtained from POS terminals for each product in all the retail stores over the period July-December 2013. Thus, the study used a database comprising 80 (products) * 30 (retail stores) * 180 (days) = 432,000 daily views. Processing these we calculated the following variables: out-of-stock rate, speed of turnover and sales coefficient of variance.
The POS sales estimation method (Gruen & Corsten, 2007) was used for calculating out-of-stock rates. By its application, out-of-stock rate (OOS) for product i in the retail store s is obtained as the quantifier of the lost (LS) and expected sales (ES) in units over a certain time period, where the lost sales is the difference between the average and actual sales:
OOSis = LSis * 100 / ESis
(1)
Under the auspices of ECR Europe, (Hausruckinger, 2005) used daily sales data analysis to set the principles of calculating the ranges within which the expected sales move. However, as his approach is applicable only to a small number of FMCG products with low sales volatility (Papakiriakopoulos et al., 2009), when calculating variables in formula (1), we used additional data in this study, as proposed by (Papakiriakopoulos & Doukidis, 2011):Average number of items sold until the current date, Average sales frequency and Standard deviation of sales frequency.
Product sales frequency for each retail store is represented by speed of turnover (ST) – mean sales of an SKU per day (Angerer, 2005). On the other hand, coefficient of variation (CV) was used for measuring sales variations. It is calculated as the ratio of standard deviation of daily sales (σ) and average daily sales (μ) in units, for product i, in store s:
CVit =
σis
/μis
* 100(2)
Descriptive statistics for variables OOS, ST and CV are presented in Table 2.
Table 2
Descriptive statistics for OOS, ST and CV
Variables Mean (s.d.) Median
The average product out-of-stock rate amounts to 4,3 %, where average daily sale is 20,796 units with the average coefficient of sales variation of 1,519.
The above variables were used for proving several hypotheses. The first two hypotheses refer to the relations between product availability (measured in out-of-sale rates) and their sale characteristics (frequency and sales variation). Following managerial practices in retail companies and results in other research papers (Stolzle & Placzek, 2004; Angerer, 2005), hypotheses H1 and H2 read as follows:
H1: The products with the highest speed of turnover have significantly lower OOS rates than the slow turning products.
H2: The products with the highest sales variation have significantly higher OOS rates than the products with a low sales variation.
This research also analysed product availability from the aspect of retail store size. Following the results of earlier research (Roland Berger Consultants, 2003; Fernie & Grant, 2008; Aastrup & Kotzab, 2009), we tested the existence of significant difference in average stock-out rates between different retail formats. The following hypothesis was set with regard to this:
H3: There is statistical significant difference between store formats with regard to OOS level.
Comparative statistics methods (One-Way ANOVA, Welch ANOVA) were used for proving the set hypotheses. The given methods were processed in the SPSS 20.0 statistical program.
Results
OOS and Product Characteristics. Similar to Angerer (2005), when testing the hypotheses H1 and H2, the variables speed of turnover and sales coefficient of variation were divided into three categories (low, medium and high) by using three quantiles (33,33 % percentiles). The analysis of the average OOS rates was commenced by initiating the One-Way ANOVA procedure separately for each variable. Speed of turnover (ST). The speed of turnovervariable was used as a category factor in the first model. Table 3 presents the basic descriptive statistics for its three categories (low, medium and high). The highest average OOS rate was recorded in the low speed of turnover category (7,1 %), and the lowest in high (2,86 %).
Table 3
Descriptives for Speed of turnover categories
Categories N Mean
OOS
Std.
Deviation Std. Error
Low 800 0,0710 0,10878 0,00385 Medium 800 0,0304 0,05734 0,00203 High 800 0,0286 0,05892 0,00208 Total 2400 0,0433 0,08109 0,00166
The assumption of homogeneity was tested by applying the Levene’s test. However, as Levene statistic is significant (with p<0,01), we carried out Welch Test (Welch ANOVA) that does not require homogeneity of variances.
Table 4
Robust Test of Equality of Means – ST categories
Statistic df1 df2 Sig.
Welch 51,027 2 1523,218 0,000
As we can see in Table 4, significance level is below 0,01 (p=0,000); therefore, there is a statistically significant difference in the mean product OOS rates between the different Speed of turnover categories. As the assumption of homogeneity was not met, for comparing OOS means of these groups we used Games-Howell test in the post-hoc analysis.
Table 5
Games-Howell multiple comparisons for ST categories
Categories Mean
Difference Std. Error Sig.
Low Medium 0,04062 0,00435 0,000
High 0,04237 0,00437 0,000
Medium Low -0,04062 0,00435 0,000
High 0,00175 0,00291 0,819
High Low -0,04237 0,00437 0,000
Medium -0,00175 0,00291 0,819
Based on the obtained results, it can be concluded that the average OOS rate of the low group is statistically significantly higher in relation to the medium and high group (p<0,01 in both cases). On the other hand, the difference between the medium and high group is not statistically significant (p=0,819). Given that the average OOS rate of the high group is statistically significantly lower compared to the low group (by 4,273 %), hypothesis H1 is confirmed.
Sales Coefficient of Variation (CV). In another model, sales coefficient of variation variable is the factor category. Descriptive statistics for its groups (low, medium and high) are presented in Table 6. Unlike speed of turnover categories, the average product OOS rate at coefficient of variation variable is the highest in the high group (8,47 %), whereas its lowest value is related to the low group (1,59 %).
Table 6
Descriptives for CV categories
Categories N Mean OOS Deviation Std. Std. Error
Low 800 0,0159 0,03471 0,00123 Medium 800 0,0293 0,05091 0,00180 High 800 0,0847 0,11522 0,00407 Total 2400 0,0433 0,08109 0,00166
Like in the previous model, the assumption of homogeneity was tested by means of the Levene’s test. However, as this assumption was not met in this case either (p value for Levene test is under 0,01), we carried out the Welch Test (Welch ANOVA).
Table 7
Robust Test of Equality of Means – CV categories
Statistic df1 df2 Sig.
Welch 137,013 2 1414,514 0,000
The statistics for Welch test (presented in Table 7) is significant at the level below 0,01 (p < 0,01). This points to the existence of a statistically significant difference between the mean product OOS rates of CV categories (low, medium and high). The Games-Howell test was also used for examining particular differences in the post hoc analysis. Its results are presented in Table 8.
of the high group is statistically significantly higher in comparison with the medium (by 5,54 %) and the low group (by 6,879 %), hypothesis H2 is also confirmed.
Table 8
Games-Howell multiple comparisons for CV categories
Categories Mean
Difference Std. Error Sig.
Low Medium -0,01339 0,00218 0,000
High -0,06879 0,00425 0,000
Medium Low 0,01339 0,00218 0,000
High -0,05540 0,00445 0,000
High Low 0,06879 0,00425 0,000
Medium 0,05540 0,00445 0,000
OOS and Store Formats. The One-Way ANOVA method was also used to analyse the average product stock-out rate of different retail formats (superettes, supermarkets and hypermarkets). Out of these, the highest stock-out rate was found in superettes (6,62 %), followed by supermarkets (4,51 %), and finally hypermarkets (2,28 %). Their values are presented in Table 9.
Table 9
Descriptive statistics for store formats
Formats N Mean OOS Std.
Deviation Std. Error
Supererres 8 0,0662 0,00841 0,00322 Supermarkets 12 0,0451 0,01306 0,00377 Hypermarkets 10 0,0228 0,00911 0,00266 Total 30 0,0433 0,01993 0,00364
The assumption of homogeneity was tested with Levene’s test. Its results are presented in the table below.
Table 10
Test of Homogeneity of Variances
Levene Statistic df1 df2 Sig.
1,483 2 27 0,245
As the Levene statistics is not significant (p=0,245), the assumption of homogeneity was met. Table 11 gives the results of the ANOVA test.
Table 11
Store formats One-Way ANOVA on OOS
Sum of Squares df
Mean
Square F Sig. Between Groups 0,008 2 0,004 36,739 0,000
Within Groups 0,003 27 0,000
Total 0,012 29
The significance level of this test is below 0.01 (p=0,000). We can therefore conclude that there is a statistically significant difference in the average stock-out rate, which confirms hypothesis H3.
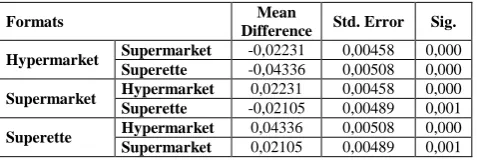
Table 12
Tukey multiple comparisons for store formats
Formats Mean
Difference Std. Error Sig.
Hypermarket Supermarket -0,02231 0,00458 0,000 Superette -0,04336 0,00508 0,000
Supermarket Hypermarket 0,02231 0,00458 0,000 Superette -0,02105 0,00489 0,001
Superette Hypermarket 0,04336 0,00508 0,000 Supermarket 0,02105 0,00489 0,001
Given that the assumption of homogeneity of variance is met, Tukey test was used in post hoc analysis. Its results indicated that with the increase in the size of retail formats (by switching from superettes to hypermarkets) the average store OOS rate declines.
Bearing in mind the last result of quantitative research, additional qualitative research was conducted. The difference in average FMCG product availability between store formats was the subject of interviews with supply chain directors and store managers. The interviewees, especially those who worked in both smaller and larger store formats, were not surprised regarding this difference and they identified two reasons for lower product availability rates in smaller retail stores.
According to store managers, the main reason for this difference is inappropriate store personnel management. Whereas in larger retail stores have a clear delegation of obligations and responsibilities, where all the store and assortment management activities are conducted in compliance with category management, the staff of smaller stores perform multiple activities for different product categories, including work at the tills. In their opinion, a considerable number of store personnel are not even sufficiently familiar with the OOS problem. In addition to the permanently employed staff, merchandising and promotion activities in major retail stores also involve suppliers, whether directly through their own employees, or indirectly, using the services of specialised organisations, which can also make a positive impact on product availability. Consequently, smaller stores experience more frequent errors related to shelf replenishment, inventory control, damages, shrinkage, store ordering, and thus lower product availability.
As the second cause of higher OOS rates in smaller stores, supply chain directors mention difficulties in stock delivery. Opposite to hypermarkets which are built in suburban, easily accessible locations, smaller stores are mostly located in areas with traffic congestion, complex approach routes and lack of parking space. This can result in delays or changes in delivery schedule, and, consequently, decrease in product availability. With most of these problems supply chain directors usually confront when planning and organizing deliveries for stores in “city centre” areas.
Scientific discussion
of possible errors. That problems and errors in sales forecasts feature as one of the essential root causes of retail store stock-outs is indicated in several studies. According to (Berger Consultants, 2003), forecasting inaccuracy ranges into 13 major OOS root cases. (Costen & Gruen, 2003) also devote attention to this problem in their study, considering store forecasts as fourth most frequent cause of stock-outs in retail stores. That inaccurate forecasts may result not only in surplus stock but also significant inventory shortages is also argued by (Ching-Chin et al., 2010). Increased OOS levels in retail stores due to errors in the forecasting process also stems from their negative impact on other areas of business operations, such as store ordering and inventory accuracy. Accordingly, due to lower forecast accuracy, products with higher sales variations are prone to higher stock-out rates in comparison with products with constant sales.
Even contrary to some research results (Andersen Consulting, 1996), this study has shown that higher stock-out rates characterise FMCG products with low average daily sales (low speed of turnover). According to (Stolzle Placzek, 2004), unlike high speed turnover products, this group receives much less attention. On the Serbian retail market, characterised by lower purchasing power compared to the average of the EU countries (GFK, 2013), with the lack of working capital (Lovreta, 2009) retailers focus on products with high speed of turnover when performing shelf space and assortment management activities. In addition to neglect, Eroglu et al., (2011) see the root cause of higher stock-out rates of slow moving FMCG products in unreliable backroom-shelf operations. (Waller et al., 2010) present the given problem as „backroom logistics effect“. Under the influence of this effect, higher stock levels in backrooms may result in lower product availability on shelves. (Gruen & Corsten, 2007). According to (Eroglue et al., 2011), backroom inventory levels of slow moving products are mostly on a higher level, which increases their stock-out possibilities. Backroom logistics effect is particularly more manifest in slow moving products, especially bearing in mind neglect and smaller number of facings.
From the aspect of retail stores, contrary to the results of other studies (Roland Berger Consultants, 2003), we have found that the availability of FMCG products is higher in larger retail formats (hypermarkets). In addition to reasons given by supply chain directors and store managers during the quality interviews (Aastrup & Kotzab, 2009) also see the advantage of larger over smaller stores in terms of product availability in better space allocation possibilities for both products with high and lower turnover.
In view of the research results, managers should devote particular attention both to products with high sales variations and products with low turnover rate, as to smaller retail formats. To reduce the stock-out rate of the presented problematic products and retail outlets, they can apply the Shelf Availability Management model (Roland Berger Consultants, 2003). By implementing it, retailers and suppliers together participate in the joint implementation of category management, which enables a better coordination of buying, merchandising and pricing activities within different product categories (Basuroy et al., 2001). Specially marked shelf tags (Gruen & Corsten, 2007) can be used to
facilitate monitoring and controlling the critical items. However, as tagging individual products only mitigates, but does not resolve the OOS problem, it is necessary to revise and enhance certain business processes. In the case of products with high sales variations, special attention should be devoted to establishing up-to-date forecasting and ordering systems, based on constant exchange of information between the retailers and their suppliers. Furthermore, processes such as assortment planning and space allocations should also be improved, by implementing the demand-based planogram (Gruen & Corsten, 2007).
As regards smaller retail formats, avoiding bottlenecks and delays requires a more serious approach to planning and organising deliveries, i.e. investing effort into synchronising logistic activities between retailers and their suppliers. Various software solutions related to optimising these activities (Pramatari & Militios, 2008) can also be helpful for managers. In addition to deliveries, a special focus should also be placed on staff organisation. Implementing various training, learning and motivation models can improve people engagement in OOS problems, thus contributing to an increase in product availability in retail stores (ECR UK, 2007).
Conclusion
Providing an adequate level of FMCG product availability represents one of the main tasks for retailers. In this way, they meet the basic assumption for realization of transactions. Therefore, this term is usually analysed in the context of customer service.
The importance of product availability is especially emphasised when considering problems caused by its low level, manifested through out-of-stock situation. In addition to the loss of customers’ money, time and energy, negative effects of OOS situation on sales, store and brand loyalty have also been presented in this study. However, even though this phenomenon is well described in the literature and it has been the subject of many researches, case studies and conferences under the auspices of ECR organisations, it is still very actual, especially for retailers.
For its better understanding, FMCG product availability has been investigated in the context of several product and store characteristics. Focusing on sales indicators, as product related, and retail formats, as store related features, we reached the following conclusions:
concerning the speed of turnover, product availability level is the lowest at slow moving FMCG products; its average OOS level (7,1 %) is more than twice higher than the OOS level of products with the highest speed of turnover rates (2,8 %);
from the aspect of sales volatility, product availability level is the lowest at FMCG products with the highest sales variations; comparing to products with the lowest sales variations, its average OOS level is more than five times higher (8,4 % to 1,5 %);
The difference in levels of FMCG product availability in larger and smaller retail formats was additionally examined by conducting qualitative interviews with supply chain directors and store managers. According to them main problems of higher out-of-stock rates in smaller stores are related to poor store personnel management and difficulties in stock delivery. Besides causes, in discussion
part of this study, similar researches and some managerial implications have been presented as well.
For future researches additional variables can be used. As FMCG product availability depends on human factor, it would be interesting to expand this analysis with quantitative and qualitative employee indicators.
References
Aastrup, J., & Kotzab, H. (2009). Analyzing out-of-stock in independent grocery stores: an empirical study. International Journal of Retail & Distribution Management, 37(9), 765–789. http://dx.doi.org/10.1108/09590550910975817 Andersen Consulting. (1996). Where to look for incremental sales gain; the retail problem of out-of-stock. Atlanta: The
Coca-Cola Research Council.
Anderson, E., Fitzsimons, G., & Simester, D. (2006). Measuring and Mitigating the Costs of Stockouts. Management Science, 52 (11), 1751–1763. http://dx.doi.org/10.1287/mnsc.1060.0577
Angerer, A. (2005).The Impact of Automatic Store Replenishment Systems on Retail. University of St. Gallen: Graduate School of Business Administration, Economics, Law and Social Sciences.
Angulo, A., Nachtmann, H., & Waller, M. A. (2004). Supply chain information sharing in a vendor managed inventory partnership. Journal of Business Logistics, 25(1), 101–120. http://dx.doi.org/10.1002/j.2158-1592.2004.tb00171.x Banyte, J., Gudonaviciene, R., & Grubys, D. (2011). Changes in Marketing Channels Formation. Inzinerine
Ekonomika-Engineering Economics, 22(3), 319–329.
Basuroy, S., Mantrala, M. K., & Walters, R. G. (2001). The impact of category management on retailer prices and performance: theory and evidence. Journal of Marketing, 65(4), 16–33. http://dx.doi.org/10.1509/jmkg.65.4.16.18382 Bayle-Tourtoulou, A., Laurent, G., & Mace, S. (2006). Assessing the Frequency and Causes of Out-of-Stock Events Through
Store Scanner Data. HEC Paris.
Breugelmans, E., Campo, K., & Gijsbrechts, E. (2006). Opportunities for active stock-out management in online stores: The impact of the stock-out policy on online stock-out reactions. Journal of Retailing, 82 (3), 215–228. http://dx.doi.org/10.1016/j.jretai.2006.05.001
Campo, K. Gijsbrechts, E., & Nisol, P. (2000). Towards Understanding Consumer Response to Stock-Outs, Journal of Retailing, 76(2), 219–242. http://dx.doi.org/10.1016/S0022-4359(00)00026-9
Che, H. Chen, X. & Chen, Y. (2012). Investigating Effects of Out-of-Stock on Consumer Stockkeeping Unit Choice. Journal of Marketing Research, 49, 502–513. http://dx.doi.org/10.1509/jmr.09.0528
Ching-Chin, C., Ieong Ka Ieng, A., Ling-Ling, W., & Ling-Chieh, K. (2010). Designing a decision-support system for new product sales forecasting. Expert Systems with Applications, 37, 1654–1665. http://dx.doi.org/10.1016/j.eswa. 2009.06.087
Corsten, D., & Gruen, T. (2003). Desperately seeking shelf availability: an exanimation of the extent, the causes, and the efforts to address retail out-of-stock. International Journal of Retail & Distribution Management, 31 (12), 605–-617. Corsten, D., & Gruen, T. (2004). Stock-Outs Cause Walkouts. Harvard Business Review, 82, 26–28.
http://dx.doi.org/10.1108/09590550310507731
ECR AP. (2012). On Shelf Availability in Asia Pacific. Efficient Consumer Response Asia Pacific, Accenture, Unilever and Diageo.
ECR Rus. (2009). ECR ePoS Step-by-Step Manual for FMCG Supplier . Available at www.ecr-all.org/wp.../ePoS-step-by-step-Suppliers.pdf .
ECR UK. (2007). Availability 2007. England: Institute of Grocery Distribution.
EFMI, CBL. Consumenten trends 2005. (2005). Rotterdam/ Leidschendam: Technical report.
Ehrenthal, J., Gruen, T., & Hofstetter, J. (2014). Value attenuation and retail out-of-stocks, A service-dominant logic perspective. International Journal of Physical Distribution & Logistics Management, 44(1/2), 39-57. http://dx.doi.org/10.1108/IJPDLM-02-2013-0028
Ellram, L., Londe, B., & Weber, M. (1999). Retail logistics. International Journal of Physical Distribution & Logistics Management, 29, 477–494. http://dx.doi.org/10.1108/09600039910291993
Eroglu, C., Williams, B., & Waller, M. (2011). Consumer-driven retail operations - The moderating effects of consumer demand and case pack quantity. International Journal of Physical Distribution & Logistics Management, 41(5), 420– 434. http://dx.doi.org/10.1108/09600031111138808
Fernie, J., & Grant, D. (2008). On-shelf availability: the case of a UK grocery retailer. The International Journal of Logistics Management, 19(3), 293–308. http://dx.doi.org/10.1108/09574090810919170
Goldfrab, A. (2006). The medium-term effects of unavailability.Quantitative Marketing and Economics, 4(2), 143–171. http://dx.doi.org/10.1007/s11129-006-8128-8
Gruen, T. (2007). Retail Out-Of-Stocks. Colorado Springs: University of Colorado. Available from internet: http://www.uccs.edu/~tgruen/Retech%20Gruen%20OOS%20Presentation%20Complete.pdf
Gruen, T., Corsten, D., & Bharadwaj, S. (2002). Retail Out-of-Stocks: A Worldwide Examination of Extent, Causes and Consumer Responses. Grocery Manufacturers of America. Available from internet: http://knowledge.emory.edu/ papers/1030.pdf.
Gruen, T., & Corsten, D. (2007). A Comprehensive Guide To Retail Out-of- Stock Reduction In the Fast-Moving Consumer Goods Industry. Colorado: Grocery Manufacturers’ Association.
Gudonaviciene, R., Alijosiene, S., & Aukscionis, L. (2008). The Peculiarities of Conflicts Management in Marketing Channels. Ekonomika ir vadyba – Economics and Management, 13, 261–271.
Hausruckinger, G. (2005). Approaches to measuring on-shelf availability at the point of sale. München: ECR Europe. Jing, X., & Lewis, M. (2011). Stockouts in Online Retailing.Journal of Marketing Research, 48(2), 342–354. http://dx.doi.org/10.1509/jmkr.48.2.342
Lovreta, S. (2009). Strategija razvoja trgovine Republike Srbije. Belgrade: Faculty of Economics. Lovreta, S. Petkovic, G., & Koncar, J. (2009). Marketing Channels. Belgrade: Faculty of Economics.
McKinnon, A. Mendes, D. & Nabateh, M. (2007). In-store logistics: an analysis of on-shelf availability and stockout response for three product groups. International Journal of Logistics: Research and Applications, 10(3), 251–268. http://dx.doi.org/10.1080/13675560701478075
Musalem, A., Olivares, M., Bradlow, E., Terwiesch, C., & Corsten, D. (2010). Structural Estimation of the Effect of Out-of-Stocks. Management Science, 56(7), 1180–1197. http://dx.doi.org/10.1287/mnsc.1100.1170
Papakiriakopoulos, D., & Doukidis, G. (2011). Classification Performance for Making Decisions about Products Missing from the Shelf. Advances in Decision Sciences, 1–13. http://dx.doi.org/10.1155/2011/515978
Papakiriakopoulos, D., Pramatari, K., & Doukidis, G. (2008). A decision support system for detecting products missing from the shelf based on heuristic rules. Decision Support Systems, 46, 685–694. http://dx.doi.org/10.1016/j.dss.2008.11.004 Peckham, J. (1963). The consumer speaks. Journal of Marketing. 21–26. http://dx.doi.org/10.2307/1248641
Pizzi, G., & Scarpi, D. (2013). When Out-of-Stock Products DO Backfire: Managing Disclosure Time and Justification Wording. Journal of Retailing, 89(3), 352–359. http://dx.doi.org/10.1016/j.jretai.2012.12.003
Pramatari, K., & Miliotis, P. (2008). The impact of collaborative store ordering on shelf availability. Supply Chain Management: An International Journal, 13/1, 49–61. http://dx.doi.org/10.1108/13598540810850319
Roland Berger Strategy Consultants. (2003). ECR – Optimal Shelf Availability Increasing Shopper Satisfaction at the moment of truth. ECR Europe. Available from internet: www.ecr-austria.at/index.php?...optimal-shelf.
Schary, P., & Christopher, M. (1979). The anatomy of a stock-out. Journal of Retailing, 55, 59–67.
Sloot, L., Verhoef, P., & Franses, P. (2005). The impact of brand equity and the hedonic level of products on consumer stock-out reactions. Journal of Retailing, 81, 15–34. http://dx.doi.org/10.1016/j.jretai.2005.01.001
Staeder, J. (2013). Connecting the World´s Product Data - Baltic Pilot. Tallinn: GS1 Lithuania, GS1 Latvia, 1WorldSync i Edisync Estonia.
Stolzle, W., & Placzek, T. (2004). Umsetzung von Optimal Shelf Availability – Messkonzepte und Standardisierun-gspotenziale. Presentation at the BVL congress.
Supermarket Guru Consumer Panel. (2011). Shoppers Cite Store annoyances. Available at http://supermarketnews.com/ Trautrims, A., Grant, D., Fernie, J., & Harrison, T. (2009). Optimizing On-shelf Availability for Customer Service and Profit.
Journal of Business Logistics, 30(2), 231–247. http://dx.doi.org/10.1002/j.2158-1592.2009.tb00122.x
Van Woensel, T., van Donselaar, K., Broekmeulen, R., & Fransoo, J. (2007). Consumer responses to shelf out-of-stocks of perishable products. International Journal of Physical Distribution & Logistics Management, 37(9), 704–718. http://dx.doi.org/10.1108/09600030710840822
Waller, M. A. Williams, B. D. Tangari, A. H., & Burton, S. (2010). Marketing at the retail shelf: exploring moderating effects of logistics on SKU market share. Journal of the Academy of Marketing Science, 38 (1), 105–117. http://dx.doi.org/10.1007/s11747-009-0146-0
Walter, C. K., & Grabner, J. (1975). Stockout Models: Empirical Tests in a Retail Situation. Journal of Marketing, 39, 56–68. http://dx.doi.org/10.2307/1250902
Zinn, W., & Liu, P. (2008). A comparison of Actual and Intended Consumer Behaviour in Response to Retail Stockouts. Journal of business logistics, 29 (2), 141–159.
The article has been reviewed.