Knowledge-Intensive Business Services and R&D Diffusion: a Comparative
Assessment of Some EU27 Countries
Mercedes Rodriguez
University of Granada
Campus Universitario de Cartuja s/n E-18071 Granada, Spain e-mail: [email protected]
http://dx.doi.org/10.5755/j01.ee.24.4.2081
In this article we develop a measure to approximate the diffusion of product-embodied R&D that takes place by means of the intermediate purchases of KIBS in 19 of the EU27 countries over the period 2000-2005. The results obtained confirm a rising trend in the use of KIBS as intermediate consumptions as well as the predominance of the domestic provision of this type of services with two exceptions: Ireland and, to a lesser extent, Finland. Leaving aside the two countries with the lowest intensities, Estonia and Hungary, four major groups of countries in terms of the R&D intensity of their KIBS sector were distinguished: very high (Finland, Sweden and Austria), high (Ireland, Czech Republic and Spain), medium (Greece, Belgium, Slovakia, Romania, Slovenia and Germany) and low (Portugal, Netherlands, Poland, Italy and Lithuania).
Overall, a high correspondence between R&D intensity and product-embodied R&D diffusion was found, although Ireland, Romania, Belgium and the Netherlands displayed a disappointing diffusion per unit of value added in comparison with the R&D expenditures developed. The existence of weak linkages between the KIBS sector and the rest of industries can be identified as the main explanation for this “diffusion gap”. In brief, the results obtained confirm that KIBS are essential industries for improving innovation performance as they carry out strong efforts in R&D that spill over to the rest of the production system.
Keywords: Knowledge-intensive business services, R&D, diffusion, input-output, European Union.
Introduction
It is widely recognized that services are playing an increasing role in the economies of the EU27, particularly in those countries subject to deep processes of structural change. Service industries are accounting for growing shares of value added and employment and becoming more and more important for the whole industrial dynamics (Tomlinson, 2000; Lundvall, 2002; Castaldi, 2009; Camacho et al., 2012). One feature of this process is that the boundaries between goods and services are blurring (Miles & Boden, 2000) and we are facing the development of a new type of society where the secondary and tertiary sectors are more and more intimately intertwined. Howells (2000) employs the term “encapsulation” to highlight the fact that manufacturing firms obtain an increasing percentage of their turnover from the provision of service activities. He explains that there are two main ways in which this phenomenon occurs: the good can be offered in combination with services as a “package”, which includes both the good and some services (for instance in the case of cars, the financial, insurance and maintenance services) or a service can replace the good itself (in aerospace engines you buy a certain number of hours of flight, independently from the number of engines you would use). In this scenario to understand how services innovate, and, in the particular case of those services mainly provided to other firms, how they can help other firms to innovate becomes extremely important.
development. In their review of the literature on KIBS, Muller and Doloreux (2009) highlight that KIBS are mainly concerned with providing knowledge-intensive inputs to other organizations, so they are essential for the production, diffusion and use of knowledge and hence for innovation and competitiveness (Snieska & Draksaite, 2007). Focusing on R&D, Doloreux and Shearmur (2012) note that KIBS can compensate for internal R&D missing in a firm or complement and strength internal R&D. More precisely, they distinguish four major stages to which R&D conducted by KIBS firms can contribute, namely, the research on potential innovations, the validation of new knowledge prior entering new markets, the application of new knowledge to modify operations or the production and marketing of new products. Moreover, in many occasions, the relationship between KIBS firm and its client is so close that both depend on the other´s R&D efforts to stay competitive (Czarnitzki & Spielkamp, 2003). Overall, small and medium size enterprises (SMEs) are the major beneficiaries of the R&D developed by KIBS (Czarnitzki & Spielkamp, 2003; Muller & Doloreux, 2009; Muller & Zenker, 2001; Yam et al., 2011).
The Lisbon Strategy adopted in 2000 was aimed at turning the European Union in the most competitive and dynamic knowledge-based economy in the world (European Council, 2000). However, the evaluation of outcomes reveals not only that this major goal has not been achieved, but also the existence of great differences in the performance of the EU27 countries (Balezentis & Balezentis, 2011). The current Europe 2020 tries to address the need for increasing knowledge and innovation, although its success will require taking into consideration a multiplicity of aspects and the solution of many problems (Melnikas, 2007; 2008; 2010).
To achieve an R&D intensity of 3 % by 2020 is one of the five headline targets established for the EU27 countries (European Commission, 2010). R&D expenditure is one of the traditional indicators of innovation inputs. But direct R&D expenditure tends to underestimate innovation efforts. When analyzing production systems, the computation of product-embodied R&D can help to provide a better picture of R&D intensities because intermediate consumptions contain R&D created by other industries1, and as a result, the use of intermediate consumptions from high-innovative industries can contribute to the development of innovations in the client industries. The measurement of these flows of product-embodied R&D can be made using input-output analysis.
As the contribution of science based industries varies considerably across European countries due to different specialization patterns (Fagerberg, 2000; Castaldi, 2009), this article aims to compare the role of KIBS across new and old member countries of the EU27. As far as our knowledge, there are no cross-country explorations of the R&D diffuser role of KIBS for the EU27: prior studies on product-embodied R&D have focused attention on
1 Intermediate consumptions can be domestic or imported. Capital goods are an additional source of acquiring embodied R&D. In this article our aim is to compare the role played by KIBS at the domestic level so we focus on domestic intermediate consumptions.
incorporation in high developed OECD countries. The purpose here is to apply an alternative methodology to measure and compare diffusion in a wide context: 19 of the EU27 countries. The results of the analysis can be useful in order to design economic policies both at national and at European level.
The structure of the article is as follows. Section 2 presents the methodology. Section 3 describes the dataset. Then, in section 4 we show how KIBS are accounting for a growing share of intermediate consumptions and how R&D intensity differs across countries, particularly as refers to the manufacturing sector. Next, we examine the relationship between R&D intensity and product-embodied R&D diffusion. The final section outlines the main findings.
Methodology
The first authors who calculated technological flows using input-output tables were Terleckyj (1974), Davis (1982, 1988) and Scherer (1982). The methodology employed here (Rodriguez, 2003; Rodriguez & Camacho, 2008) reformulates the model elaborated by Papaconstantinou et al. (1998) and applied to some service activities by Amable & Palombarini (1998), Hauknes & Knell (2009) and Mas-Verdu et al. (2011). Whereas these previous works focus on the incorporation of product-embodied R&D, we develop a measure to approximate the diffusion of product-embodied R&D that takes place by means of the intermediate purchases of KIBS.
We start with the domestic supply model (Ghosh, 1958). In the equilibrium it can be represented as a follows:
o -1 o
x = w(I- A ) = wB (1)
where xis the vector of domestic gross outputs, w is the vector of value added and Ao represents the matrix of domestic inter-industry output coefficients. o
B is the Ghosh output inverse matrix. The i-th row of the Ghosh output inverse matrix measures the impact on domestic production of industry j when the use of primary inputs (valued added) of industry i varies by one unit.
The direct R&D intensity for industry i can be defined as R&D expenditures per value added:
i i
i
R r =
W (2)
We can obtain a matrix of total domestic product-embodied R&D diffused per unit of value added of industry i, by multiplying the diagonalized matrix of R&D intensities by the Ghosh output inverse matrix:
o
ˆ = B
T r (3)
We define Ao
i as the matrix
o
A without the row and the column of industry i and o
i
a as the i-th row vector of matrix o
A without the i-th column. Vector
b
oi*is calculated as:* -1
i -i
b
oi= a (I- A )
o o (4)and we obtain matrix 0*
B as follows:
o* 1 o* o* 2 o* i b´ b´ B = b´ (5)
where vectors o* i
b´ are vectors bo*
i with a zero in the
i-th column. The domestic product-embodied R&D diffused per unit of value added of industry i can be obtained from the sum of the i-th row of matrix ˆrBo*:
n ´o*
i i ij
j=1
D = r b (6)
Data
The data used in this article were drawn from Eurostat. In particular two databases were employed: the input-output database and the Business Enterprise R&D Expenditures (BERD) database.
In most countries input-output tables are displayed by product whereas BERD data are provided by industry. Product-by-product symmetric input-output tables show technological relations between products and homogeneous units of production (branches). They are believed to be theoretically more homogeneous, since a single element of industry-by-industry tables can refer to products that are characteristic in other industries. As a result, it is assumed that they are better suited for most of input-output analyses (Eurostat, 2008).
Eurostat statistics on R&D expenditures are compiled using the guidelines laid out in the Frascati Manual (OECD, 2002). The Manual establishes that research and experimental development (R&D) “comprise creative work undertaken on a systematic basis in order to increase the stock of knowledge, including knowledge of man, culture and society and the use of this stock of knowledge to devise new applications". The main breakdown of R&D is by institutional sector of performance: business enterprise sector, government sector, higher education sector and private non-profit sector. We employ data referred to the R&D developed by businesses (BERD), where the statistical unit is business entity.
While the databases exist both at the first and second revision of the NACE, only the former classification was used since the coverage of the latter was much more limited in terms of time span and countries. In addition, because of differences in reporting, we had to merge the two classifications. This left us with 35 branches2. The
2 The 35 branches were: Agriculture and fishing products; Mining and quarrying products; Food products and beverages; Tobacco products;
group of KIBS included three types of services: computer and related services, research and development services and other business services. The years 2000 and 2005 were chosen since this combination allowed us to include the largest number of the EU27 countries. Some EU27 countries did not report data for BERD (Denmark, France, Luxembourg and the United Kingdom) and domestic symmetric input-output tables for 2005 were lacking for other countries (Bulgaria, Cyprus, Latvia and Malta) so they were excluded from the analysis. This left us with 19 countries: Austria, Belgium, Czech Republic, Estonia, Finland, Germany, Greece, Hungary, Ireland, Italy, Lithuania, Netherlands, Poland, Portugal, Romania, Slovakia, Slovenia, Spain and Sweden. To ensure comparability across the countries, all the variables were calculated in percentages and/or units.
Results
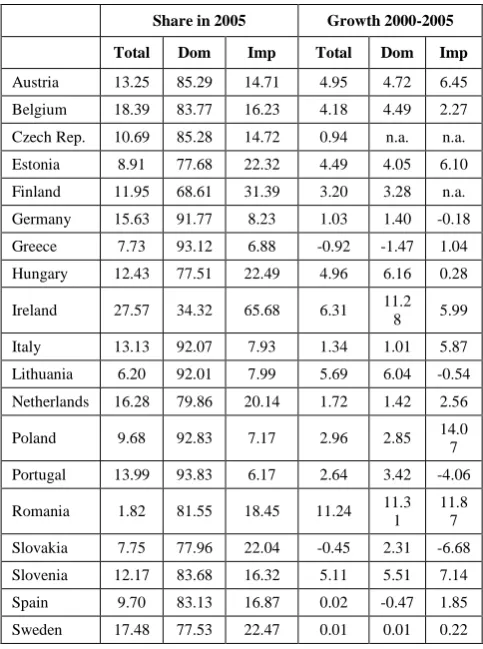
First of all, we examine the evolution of the share of KIBS in intermediate consumptions. Table 1 reports the use of KIBS as intermediate consumptions (in percentage) as well as its average annual growth over the period 2000-2005. The columns “Dom” and “Imp” represent the share of domestic and imported intermediate consumptions.
Overall, the share of KIBS in total intermediate consumptions grew in all the countries analyzed with the only exceptions of Greece and Slovakia, where there were very slight declines: in Greece because of the drop in domestic intermediate consumptions and in Slovakia due to the drop in imported intermediate consumptions. This confirms the arguments exposed in the introduction about the rising importance of services, and, to be more precise, of KIBS, within the production systems. At the very top, the share of KIBS in total intermediate consumptions in 2005 was superior to 27 % in Ireland. Countries like Belgium, Sweden, the Netherlands and Germany displayed shares higher than 15 %. On the contrary, Romania exhibited the lowest participation: only 1.82 % of total intermediates, although it was the country which experienced the largest growth rate over the period, almost twice the Irish growth rate, which was the second highest growth rate. In Lithuania and Slovenia the share of KIBS grew more than 5 % per year and Hungary and Austria exhibited growth rates near to this figure.
Table 1
Share of KIBS in intermediate consumptions, 2000-2005
Share in 2005 Growth 2000-2005
Total Dom Imp Total Dom Imp
Austria 13.25 85.29 14.71 4.95 4.72 6.45
Belgium 18.39 83.77 16.23 4.18 4.49 2.27 Czech Rep. 10.69 85.28 14.72 0.94 n.a. n.a.
Estonia 8.91 77.68 22.32 4.49 4.05 6.10
Finland 11.95 68.61 31.39 3.20 3.28 n.a. Germany 15.63 91.77 8.23 1.03 1.40 -0.18
Greece 7.73 93.12 6.88 -0.92 -1.47 1.04 Hungary 12.43 77.51 22.49 4.96 6.16 0.28
Ireland 27.57 34.32 65.68 6.31 11.2 8 5.99 Italy 13.13 92.07 7.93 1.34 1.01 5.87 Lithuania 6.20 92.01 7.99 5.69 6.04 -0.54
Netherlands 16.28 79.86 20.14 1.72 1.42 2.56
Poland 9.68 92.83 7.17 2.96 2.85 14.0 7 Portugal 13.99 93.83 6.17 2.64 3.42 -4.06
Romania 1.82 81.55 18.45 11.24 11.3 1
11.8 7 Slovakia 7.75 77.96 22.04 -0.45 2.31 -6.68
Slovenia 12.17 83.68 16.32 5.11 5.51 7.14 Spain 9.70 83.13 16.87 0.02 -0.47 1.85
Sweden 17.48 77.53 22.47 0.01 0.01 0.22
Comparing domestic and imported intermediate consumptions we find a general pattern which is common to all countries excepting Ireland: the predominance of domestic intermediate consumptions. So, if we rank the countries in terms of their use of imported intermediate consumptions the most striking case is Ireland, where more than 65 % of KIBS used as intermediate consumptions were imported in 2005. The share was even higher in 2000: in this year more than 76 % of the intermediate consumptions of KIBS were imported. The following countries in the ranking displayed a share considerably lower: Finland imported 31 % of its intermediate consumptions and Hungary, Sweden, Estonia and Slovakia about 22 %. On the opposite side, countries like Portugal, Greece, Poland, Italy or Lithuania relied mainly on domestic intermediate consumptions and imported less than 8 % of the KIBS they used. The share was slightly higher in Germany: 8.23 % of total intermediate consumptions were imported in 2005.
Once corroborated the rising role of the intermediate consumptions of KIBS, we calculate R&D intensity of the KIBS sector, defined as business expenditures on R&D per domestic value added3, and compare it with manufacturing and service sectors. In Table 2 we present the R&D intensities (in percentage) for manufacturing, services and KIBS in 2005 and the annual average growth rates over the
3 In order to avoid temporary changes, the average yearly BERD in the periods 1999-2001 and 2004-2006 were employed instead of the BERD in the years 2000 and 2005.
period 2000-2005. The table reveals that differences in R&D intensities are large across the countries. Sweden and Finland were the countries with the highest R&D intensities. On the other hand, Estonia was, with difference, the country with the lowest R&D intensities in all sectors: although it displayed large growth rates this growth was “substantial, but not sufficient” (Kirch, 2010, p. 279). A noteworthy exception within the group of high R&D intensive countries was Germany whose service sector was much less R&D intensive than the manufacturing one: Germany ranked the 3rd in manufacturing but dropped to the 11th and 12th position in services and in KIBS, respectively. A possible explanation, as Hauknes and Knell (2008) point out, is that often German firms prioritize in-house supply of services, and more concretely of KIBS, so the R&D carried out by a manufacturing industry in statistical terms can be developed in practice by a KIBS activity.
Table 2
Sectoral average R&D intensities, 2000-2005
R&D intensity in 2005 Growth 2000-2005
Man Ser KIBS Man Ser KIBS
Austria 4.70 0.72 4.45 n.a. n.a. n.a.
Belgium 4.32 0.56 2.26 -0.30 0.56 -3.41 Czech Rep. 1.83 0.55 3.13 n.a. n.a. n.a.
Estonia 0.04 0.03 0.16 11.09 25.63 13.45 Finland 7.07 0.83 5.39 1.47 -0.96 -2.43
Germany 6.54 0.25 1.45 0.59 0.24 5.35
Greece 0.57 0.12 2.29 -3.90 1.77 9.45 Hungary 1.35 0.14 0.32 8.02 3.00 -4.15
Ireland 2.83 0.46 3.45 11.79 -0.07 5.92 Italy 1.61 0.23 1.18 -1.16 3.11 0.24
Lithuania 0.32 0.16 0.80 -6.08 75.14 n.a. Netherlands 4.09 0.31 1.24 0.74 -0.67 1.47
Poland 0.34 0.15 1.22 -10.05 3.25 52.71 Portugal 0.71 0.29 1.28 6.38 5.94 5.14
Romania 0.41 0.07 1.74 -7.17 27.58 31.83
Slovakia 0.33 0.25 2.15 n.a. n.a. n.a. Slovenia 2.80 0.25 1.64 5.13 -1.63 -9.30
Spain 1.34 0.43 2.71 1.50 6.10 4.88 Sweden 8.42 1.10 5.00 -3.31 3.42 -0.61
Comparing the three sectors (manufacturing, services and KIBS) one notices that the R&D intensity of KIBS is substantially superior to the average R&D intensity of the service sector in all countries. Nevertheless, in almost half of the countries examined the average R&D intensity of the manufacturing sector was superior to the R&D intensity of KIBS: Germany, Sweden, Netherlands, Belgium Finland, Slovenia, Hungary, Italy and Austria. This could be an indication of a higher specialization in high-tech manufacturing activities.
(Ireland, Czech Republic and Spain), medium (Greece, Belgium, Slovakia, Romania, Slovenia and Germany) and low (Portugal, Netherlands, Poland, Italy and Lithuania).
Turning to the dynamics of R&D intensity, a first observation is that there is no general convergence pattern in R&D intensity in manufacturing: it increased the most in Ireland, a country with a medium-high intensity in 2000 whereas countries with low R&D intensities in 2000 experienced both high growth rates (Estonia and Portugal) and negative growth rates (Poland, Romania, Lithuania and Greece). On the contrary, a certain convergence trend is found for R&D intensity in services. It increased the most in Lithuania, Romania and Estonia, the countries with the lowest R&D intensities in services in 2000, and diminished in Slovenia, Finland and the Netherlands, with medium and high intensities in 2000. As far as the evolution of R&D intensity in KIBS, a similar trend is observed: it increased the most in Poland, Romania, Estonia, all countries with low intensities in 2000, and diminished in Slovenia, and, to a lesser extent, in Hungary, Belgium and Finland, all of them countries (excepting Hungary) with medium and high intensities in 2000. The reduction was much lower in Sweden.
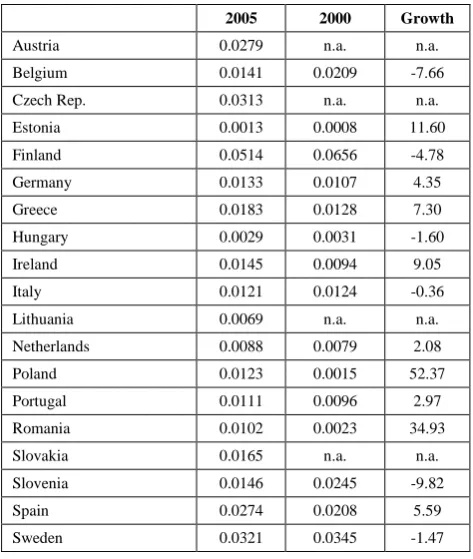
After the examination of R&D intensities, we can use the methodology described in section 2 to calculate the product-embodied R&D flows between KIBS and the rest of industries. Table 3 reports the diffusion flows per unit of value added in 2005 and 2000 as well as their annual average growth.
Table 3
Product-embodied R&D per unit of value added diffused by KIBS, 2000-2005
2005 2000 Growth
Austria 0.0279 n.a. n.a.
Belgium 0.0141 0.0209 -7.66
Czech Rep. 0.0313 n.a. n.a. Estonia 0.0013 0.0008 11.60
Finland 0.0514 0.0656 -4.78
Germany 0.0133 0.0107 4.35 Greece 0.0183 0.0128 7.30
Hungary 0.0029 0.0031 -1.60 Ireland 0.0145 0.0094 9.05
Italy 0.0121 0.0124 -0.36 Lithuania 0.0069 n.a. n.a.
Netherlands 0.0088 0.0079 2.08 Poland 0.0123 0.0015 52.37
Portugal 0.0111 0.0096 2.97 Romania 0.0102 0.0023 34.93
Slovakia 0.0165 n.a. n.a.
Slovenia 0.0146 0.0245 -9.82
Spain 0.0274 0.0208 5.59
Sweden 0.0321 0.0345 -1.47
Taking the KIBS sector in 2005, the ranking of countries according to the diffusion of domestic product-embodied R&D per unit of value added indicates that Finland is the country where KIBS played the most
important diffuser role. Sweden, the Czech Republic, Austria and Spain can also be classified as high diffusion countries. On the other hand, Estonia and Hungary exhibited very low product-embodied R&D diffusion per unit of value added for their KIBS sector. The remaining countries had product-embodied diffusion levels which varied from 0.0183 in Greece to 0.0069 in Lithuania.
The role of the KIBS sector as R&D diffuser is a function of its R&D intensity and the way each country uses the intermediate consumptions of KIBS in its domestic production system. As can be noticed, there is a high correspondence between R&D intensity and product-embodied R&D diffusion: those countries described above as high diffusers were the countries with higher R&D intensities. On the other hand, Estonia and Hungary were the countries with lowest R&D intensities and displayed low flows of product-embodied R&D per unit of value added. However, there are differences that cannot be explained by R&D expenditures carried out but by KIBS sector but by its linkages with the rest of industries. Hence, we can differentiate between “strong” and “weak” diffuser countries, depending on whether they are able to diffuse more or less product-embodied R&D through the intermediate purchases of KIBS.
Among the group of “strong” diffusers the case of the Czech Republic stands out: its KIBS sector had R&D intensity of 3.13 %, much lower than that of Sweden (5 %) but it diffused almost the same product-embodied R&D per unit of value added (0.0313 in comparison with 0.0321). Slovenia, Poland and Italy also took advantage of R&D expenditures of KIBS, as they ranked higher in terms of diffusion (8th, 12th and 13thpositions) than in terms of R&D intensity (11th, 15th and 16th positions).
On the contrary, Ireland, Romania, Belgium and the Netherlands do not seem to be able to diffuse product-embodied R&D as efficiently as the rest of countries analyzed. The most surprising example of “weak” diffusion is Ireland: in spite of having a high R&D intensive KIBS sector (it ranked 4th in terms of R&D intensity) it only diffused 0.0145 product-embodied R&D per unit of value added, less than Slovenia, a country with the half R&D intensity. Romania is another example of poor diffuser role in comparison with R&D expenditure carried out: comparing again with Slovenia, in spite of having a similar R&D intensity, their diffusion flows per unit of value added were quite different - 0.0102 in comparison with 0.0146. Other similar cases are Belgium and the Netherlands. R&D intensity of KIBS in Belgium was 2.26 %, very close to the figures of Greece (2.29 %) and Slovakia (2.15 %) but the differences in terms of diffusion per unit of value were considerably higher: Belgium diffused 0.0141 product-embodied R&D in comparison with 0.0183 in Greece and 0.0165 in Slovakia. Something similar happens with the Netherlands, with R&D intensity of 1.24 %, it only diffused 0.0088 product-embodied R&D per unit of value added, less than countries with similar intensities like Portugal or Poland.
diminished over the period: Slovenia, Belgium, Finland, Hungary and Sweden. In all cases the major reason for the decrease was a reduction in R&D intensity.
Conclusions
The achievement of higher R&D intensity is one of the five headline targets established for the EU27 countries. It is well known that the service sector is accounting for a growing share of production and employment in the EU27 but, as the lion´s share of innovation (and R&D) efforts has traditionally been the manufacturing sector, the number of studies on the contribution of services to innovation performance has been very scarce until recent dates. Within the service sector industries differ considerably in terms of innovation. Sectoral taxonomies have proposed several categories of service industries but all classify a common group of services, those called knowledge-intensive business services (KIBS), as major innovators. Moreover, KIBS are more and more seeing as key agents in knowledge production, diffusion and use.
While most empirical works using input-output techniques carried out so far have examined the incorporation of product-embodied R&D starting from the demand model, this article has tried to present an assessment of the diffusion of domestic product-embodied R&D in a wide context: 19 of the EU27 countries. The comparative perspective allowed us to analyze both the individual performance of countries as well as the common features at the European level.
To inquire into the diffuser role of KIBS, the evolution’s three aspects have been examined: their share in intermediate consumptions, their R&D intensity, and, finally, their product-embodied R&D diffusion per unit of value added.
First, a key point raised in this article is the increasing importance of the use of intermediate consumptions of KIBS. In almost all countries the share of KIBS in total intermediate consumptions grew in the period considered, the rate being particularly high in new member countries like Romania, Lithuania or Slovenia. Probably the reason for this rising share may be found in an increasing necessity in the production of goods and services to make use of KIBS to preserve competitiveness (Franke & Kalmbach, 2005). Overall, countries tend to use KIBS produced in their own country, with a notable exception for Ireland, mainly due to the use of imported research and development services (88 % of the total) and other business services (70 % of the total). Finland was another country where the share of imported intermediate consumptions of research and development services was very high (97 % of the total). In the rest of the countries domestic intermediate consumptions accounted for more than 75 % of total intermediate consumptions and even more as in Portugal, Greece, Poland, Italy, Lithuania and Germany, where the share was superior to 90%. The need for face to face contacts in order to adequately diffuse tacit knowledge, and, in some cases, the language barrier, can be possible explanations.
Second, we have confirmed that the EU27 countries differ in terms of R&D intensities, both in the
manufacturing, services and KIBS sector. As far as R&D intensity dynamics, while the service sector and KIBS sector were characterized by a certain convergence for most countries, there is no pattern of convergence or divergence in R&D intensities as far as the manufacturing sector is concerned. Anyway, leaving aside the two countries with the lowest intensities, Estonia and Hungary, four major groups of countries in terms of R&D intensity of their KIBS sector were distinguished: very high (Finland, Sweden and Austria), high (Ireland, Czech Republic and Spain), medium (Greece, Belgium, Slovakia, Romania, Slovenia and Germany) and low (Portugal, Netherlands, Poland, Italy and Lithuania).
Third, we found that, for most countries product-embodied R&D diffusion was critically connected to R&D intensity. This implicitly confirms that countries that specialize in KIBS industries, as far as they are actively engaged in the development of R&D activities, can enjoy high rates of innovation compared to other countries. The clearest examples were Finland, whose high R&D intensive KIBS sector diffused much more product-embodied R&D per unit of value added than any other country, and Sweden, the Czech Republic, Austria or Spain. On the opposite side we find countries like Estonia or Hungary with low R&D intensities and low diffusion levels. In our analysis we also identified a group of “weak” diffusion countries like Ireland, Romania, Belgium or the Netherlands where a different explanation may be put forward to justify their disappointing diffusion per unit of value added in comparison with R&D expenditures developed by their KIBS sector. The existence of weak linkages between KIBS sector and the rest of industries, and more specifically of weak forward linkages, can be the major reason for the “diffusion gap” of these countries.
As in other studies, one weakness is that R&D data employed include only R&D performed by enterprises. The inclusion of R&D from other sources, in particular public sources would be interesting. Another way to analyze further the R&D diffuser role of KIBS would be to include the diffusion through imported KIBS once data for key exporter countries like France or the United Kingdom, were available. Moreover, once input-output tables for more years were released by the OECD, statistical tests to assess the stability of the results should be conducted.
References
Amable, B., & Palombarini, S. (1998). Technical Change and Incorporated R&D in the Service Sector. Research Policy, 27(7), 655-675.
Balezentis, A., & Balezentis, T. (2011). Framework of Strategic Management Model for Strategy Europe 2020: Diachronic Analysis and Proposed Guidelines. Inzinerine Ekonomika-Engineering Economics, 22(3), 271-282.
Camacho Ballesta, J. A., Melikhova, Y., & Hernandez Peinado, M. (2012). Services in the EU Productive Systems: a Comparative Study of the New and Old Member States. Inzinerine Ekonomika-Engineering Economics, 23(3), 223-232. Camacho, J. A., & Rodriguez, M. (2008). Patterns of Innovation in the Service Sector: Some Insights from the Spanish Innovation Survey. Economics of Innovation and New Technology, 17(5), 459-471. http://dx.doi.org/10.10 80/10438590701362874
Castaldi, C. (2009). The Relative Weight of Manufacturing and Services in Europe: An Innovation Perspective. Technological Forecasting & Social Change, 76(6), 709-722. http://dx.doi.org/10.1016/j.techfore.2008.08.001
Castellacci, F. (2008). Technological Paradigms, Regimes and Trajectories: Manufacturing and Service Industries in a New Taxonomy of Sectoral Patterns of Innovation. Research Policy, 37(6-7), 978-994. http://dx.doi.org/10.1016/ j.respol.2008.03.011
Czarnitzki, D., & Spielkamp, A. (2003). Business Services in Germany: Bridges for Innovation. Service Industries Journal, 23(2), 1-30. http://dx.doi.org/10.1080/02642060412331300862
Davis, A. L. (1982). Technology Intensity of U.S. Output and Trade. Washington, DC: U.S. Department of Commerce. Davis, A. L. (1988). Technology Intensity of U.S. Canadian and Japanese Manufactures Output and Exports. Washington,
DC: U.S. Department of Commerce.
Doloreux, D., & Shearmur, R. (2012). How Much Does KIBS Contribute to R&D Activities of Manufacturing Firms?. Economia Politica, 3, 319-342.
Evangelista, R. (2000). Sectoral Patterns of Technological Change in Services. Economics of Innovation and New Technology, 9, 183-221. http://dx.doi.org/10.1080/10438590000000008
EUROPEAN COUNCIL. (2000). Presidency Conclusions. Lisbon, 23 and 24 March, SN 100/00.
EUROPEAN COMMISSION. (2010). Communication from the Commission: Europe 2020. A Strategy for smart, sustainable an inclusive growth. 3.3.2010, COM (2010) 2020.
EUROSTAT. (2008). Eurostat Manual of Supply, Use and Input-Output Tables. Luxembourg: Eurostat.
Fagerberg, J. (2000). Technological Progress, Structural Change and Productivity Growth: a Comparative Study. Structural Change and Economic Dynamics, 11, 393-411. http://dx.doi.org/10.1016/S0954-349X(00)00025-4
Franke, R., & Kalmbach, P. (2005). The Relative Weight of Manufacturing and Services in Europe: An Innovation Perspective. Structural Change and Economic Dynamics, 16, 476-488.
Ghosh, A. (1958). Input-Output Approach to an Allocative System. Economica, 25, 58-64. http://dx.doi.org/10.2307/2550694 Hauknes, J., & Knell, M. (2009). Embodied Knowledge and Sectoral Linkages: an Input–Output Approach to the Interaction
of High- and Low-Tech Industries. Research Policy, 38(3), 459-469. http://dx.doi.org/10.1016/j.respol.2008.10.012 Hipp, C., & Grupp, H. (2005) Innovation in the Service Sector: The Demand for Service-Specific Innovation Measurement
Concepts and Typologies. Research policy, 34(4), 517-535. http://dx.doi.org/10.1016/j.respol.2005.03.002
Hollenstein, H. (2003). Innovation Modes in the Swiss Service Sector: a Cluster Analysis Based on firm-level data. Research Policy, 32(5), 845-863. http://dx.doi.org/10.1016/S0048-7333(02)00091-4
Howells, J. (2000). Innovation & Services: New Conceptual Frameworks. CRIC Discussion Paper No. 38. Manchester: University of Manchester.
Kirch, A. (2010). Process of the Implementation of Knowledge Triangle in Estonia. Inzinerine Ekonomika-Engineering Economics(3), 274-282.
Lundvall, B. A. (2002). Innovation, Growth and Social Cohesion. The Danish Model. Cheltenham: Edward Elgar. http://dx.doi.org/10.4337/9781781008348
Mas-Verdu, F., Wensley, A., Alba, M., & Garcia Alvarez-Coque, J.M. (2011). How Much Ddoes KIBS Contribute to the Generation and Diffusion of Innovation?. Service Business, 5(3), 195-212. http://dx.doi.org/10.1007/s11628-011-0110-1 Melnikas, B. (2007). New Challenges for the Cultural and Economic Development in the European Union: the Long Term
Transformations. Inzinerine Ekonomika-Engineering Economics(2), 34-43.
Melnikas, B. (2008). The Knowledge Based Economy in the European Union: Innovations, Networking and Transformation Strategies. Transformations in Business and Economics, 7, 3(15), 170-192.
Melnikas, B. (2010). Europe of Knowledge: Sustainable Development. European Integration Studies, 4, 60-71.
Miles, I., Kastrinos, N., Flanagan, K., Bilderbeek, R., den Hertog, P., Huitink, W., & Bouman, M. (1995). Knowledge-Intensive Business Services: Their Role as Users, Carriers and Sources of Innovation. Report to the EC DG XIII Sprint EEIMS Programme. Luxembourg.
Miozzo, M., & Soete, L. (2001). Internationalisation of Services: a Technology Perspective. Technological Forecasting and Social Change, 67(2/3), 159-185. http://dx.doi.org/10.1016/S0040-1625(00)00091-3
Muller, E., & Doloreux, D. (2009). What We Should Know About Knowledge-Intensive Business Services (KIBS). Technology in Society, 31(1), 64-72. http://dx.doi.org/10.1016/j.techsoc.2008.10.001
Muller, E., & Zenker, A. (2001). Business Services as Actors of Knowledge Transformation: the Role of KIBS in Regional and National Innovation System. Research Policy, 30(9), 1501-1516. http://dx.doi.org/10.1016/S0048-7333(01)00164-0 OECD (2002). Frascati Manual: Proposed Standard Practice for Surveys on Research and Experimental Development.
Paris: OECD.
Papaconstantinou, G., Sakurai, N., & Wyckoff, A. (1998). Domestic and International Product-Embodied R&D Diffusion. Research Policy, 27(3), 301-314. http://dx.doi.org/10.1016/S0048-7333(98)00044-4
Pavitt, K. (1984). Sectoral Patterns of Technical Change: Towards a Taxonomy and a Theory. Research Policy, 13, 343-373. http://dx.doi.org/10.1016/0048-7333(84)90018-0
Rodriguez, M. (2003). Services and Innovation: towards the Knowledge-based Economy. PhD thesis. University of Granada. Rodriguez, M., & Camacho, J. A. (2008). Are KIBS More than Intermediate Inputs? An Examination Into their R&D
Diffuser Role in Europe. International Journal of Services Technology and Management, 10(2/3/4), 254-272. http://dx.doi.org/10.1504/IJSTM.2008.022122
Tomlinson, M. (2000). Information and Technology Flows from the Service Sector: a U.K.-Japan Comparison. In M. Boden & I. Miles (Eds.), Service and the Knowledge-based Economy (209-221). London: Continuum.
Scherer, F. M. (1982). Inter-Industry Technology Flows in the United States. Research Policy, 11, 227-245. http://dx.doi.org/10.1016/0048-7333(82)90011-7
Snieska, V., & Draksaite, A. (2007). The Role of Knowledge Process Outsourcing in Creating National Competitiveness in Global Economy. Inzinerine Ekonomika-Engineering Economics(3), 35-41.
Terleckyj, N. J. (1974). Effects of R&D on the Productivity Growth of Industries: an Exploratory Study. Washington, DC: National Planning Association.
Van Ark, B., Broersma, L., & den Hertog, P. (2003). Services Innovation, Performance and Policy: A Review. Synthesis Report in the Framework of the Project on Structural Information Provision on Innovation in Services (SIID) for the Ministry of Economic Affairs of the Netherlands. Groningen: University of Groningen and DIALOGIC.
Yam, R. C. M., Lo, W., Tang, E. P. Y., & Lau, A. K. W. (2011). Analysis of Sources of Innovation, Technological Innovation Capabilities, and Performance: An Empirical Study of Hong Kong Manufacturing Industries. Research Policy, 40(3), 391-402. http://dx.doi.org/10.1016/j.respol.2010.10.013
Young, A. (1996). Measuring R&D in the Services. STI Working Papers 1996/7. Paris: OECD. http://dx.doi.org/ 10.1787/686633754184
Mercedes Rodriguez
Žinioms imlių verslo paslaugų ir mokslinių tyrimų bei projektavimo-konstravimo darbų paplitimas: kai kurių ES27 šalių lyginamasis vertinimas
Santrauka
Plačiai pripažinta, kad paslaugos užima svarbią vietą Europos Sąjungos (ES) šalyse, ypač tose, kurios priklauso nuo procesų, lemiančių gilius struktūrinius pokyčius. Paslaugų verslas skaičiuoja vis didėjančią pridėtinę vertę, o užimtumas tampa vis svarbesniu veiksniu kalbant apie pramonės dinamiką. Teigiama, kad paslaugų sektorius tradiciškai yra blogas novatorius. Šis požiūris atsirado išnagrinėjus statistinius duomenis. Tiksliai įvertinti paslaugų sektoriaus novatyvumą yra sudėtinga, nes dabartinėse duomenų bazėse dažnai yra neįvertinamos paslaugų mokslinių tyrimų ir projektavimo-konstravimo darbų (MTPKD) išlaidos kai kuriose šalyse. Nepaisant to, kad naujausi tyrimai „juda į priekį“, pateikdami tikslesnį supratimą apie naujoves paslaugų sektoriuje, reikia nepamiršti svarbaus fakto, kad paslaugų sektorius apima pramonės šakas, kurios labai skiriasi viena nuo kitos, vertinant inovacines pastangas ir rezultatus. Tarp naujoviškiausios veiklos (dažniausiai apibūdinamos kaip mokslu pagrįsta pramonė), išsiskiria grupė paslaugų, vadinamų žinioms imlios verslo paslaugos (ŽIVP). Skirtingai nuo daugelio paslaugų pramonės šakose, jas lemia didelės MTPKD išlaidos. Svarbu tai, kad jos atlieka pagrindinį vaidmenį kuriant, paskirstant ir naudojant žinias. ŽIVP gali kompensuoti vidinius MTPKD, kuriems trūksta tvirtumo arba papildyti ir sustiprinti vidinius MTPKD. Pavyzdžiui, jos gali prisidėti prie potencialių naujovių tyrimo, naujų žinių įtvirtinimo prieš patenkant į naujas rinkas, naujų žinių pritaikymo norint modifikuoti operacijas arba naujų gaminių rinkodarą. Dažniausiai ryšiai tarp ŽIVP įmonės ir jos klientų yra tokie glaudūs, kad abu priklauso nuo vienas kito ir MTPKD pastangų, kad išliktų konkurencingais.
Pasiekti 3% MTPKD intensyvumą iki 2020 metų yra vienas iš penkių, pagrindinių tikslų 27 ES šalyse. Tačiau todėl, kad inovacijų (ir MTPKD) pastangų „liūto“ dalis tradiciškai priklauso gamybos sektoriui, tyrimų apie paslaugų įnašus į inovacinę veiklą buvo labai mažai. Dauguma empirinių tyrimų apie ŽIVP vaidmenį buvo atliktos įmonės mastu, tam panaudojant apklausos duomenis. Šiame straipsnyje mes naudojame makroekonominius duomenis. Tiksliau tariant, buvo panaudotos dvi Eurostato duomenų bazės: sąnaudų-išeigos duomenų bazė ir Verslo įmonių išlaidų mokslinių tyrimų ir projektavimo konstravimo darbams duomenų bazė.
Ankstesniuose tyrimuose, kuriuose naudojamos sąnaudų-išeigos technologijos, dėmesys buvo sutelktas į prisijungimą prie labai išsivysčiusių EBPO šalių. Šiame darbe kuriama priemonė, kuria naudojantis būtų galima palyginti su gaminiais susijusių MTPKD paplitimą, kuris atsiranda naudojant vidinius ŽIVP pirkimus. Tikslas yra pritaikyti alternatyvią metodiką 19-oje iš 27 ES šalių (Austrijoje, Belgijoje, Čekijos respublikoje, Estijoje, Suomijoje, Vokietijoje, Graikijoje, Vengrijoje, Airijoje, Italijoje, Lietuvoje, Olandijoje, Lenkijoje, Portugalijoje, Rumunijoje, Slovakijoje, Slovėnijoje, Ispanijoje ir Švedijoje) 2000-2005 metų laikotarpiu. ŽIVP grupė apėmė tris paslaugų tipus: kompiuterines ir su jais susijusias paslaugas, tyrimų ir plėtros paslaugas ir kitas verslo paslaugas.
Pirmiausia mes ištyrėme ŽIVP dalies vidinių sąnaudų kitimą. ŽIVP dalis, analizuojant vidines sąnaudas, augo visose nagrinėtose šalyse, išskyrus Graikiją ir Slovakiją, kur nustatytas labai nežymus smukimas. Lyginant vietinį ir importuotą tarpinį vartojimą, nustatytas bendras pavyzdys visoms šalims, išskyrus Airiją ir Suomiją. Jose dominuoja vietinės vidinės sąnaudos.
Išsiaiškinus ŽIVP vidinių sąnaudų vaidmenį, mes apskaičiavome MTPKD intensyvumą ŽIVP sektoriuje, apibūdinome kaip verslo išlaidos MTPKD turi įtaką vietinei pridėtinei vertei ir palyginome jį su gamybos ir paslaugų sektoriais. Paliekant nuošalyje dvi šalis: Estiją ir Vengriją, kurių intensyvumas mažiausias, buvo išskirtos keturios pagrindinės šalių grupės pagal jų ŽIVP sektoriaus MTPKD intensyvumą: labai aukštas (Suomija, Švedija ir Austrija), aukštas (Airija, Čekijos respublika ir Ispanija), vidutinis (Graikija, Belgija, Slovakija, Rumunija, Slovėnija ir Vokietija) ir žemas (Portugalija, Olandija, Lenkija, Italija ir Lietuva). Lyginant tris sektorius (gamybos, paslaugų ir ŽIVP) galima pastebėti, kad ŽIVP, MTPKD intensyvumas yra daug aukštesnis už vidutinį, visų šalių paslaugų sektoriaus MTPKD intensyvumą. Nepaisant to, beveik pusėje tirtų šalių, vidutinis gamybos sektoriaus R&D intensyvumas buvo aukštesnis už ŽIVP, MTPKD intensyvumą: Vokietijoje, Švedijoje, Olandijoje, Belgijoje, Suomijoje, Slovėnijoje, Vengrijoje, Italijoje ir Austrijoje. Tai gali būti modernių technologijų veiklos, aukštesnės specializacijos rodiklis. Kalbant apie MTPKD intensyvumo dinamiką, pirmas pastebėjimas būtų tas, kad nėra bendro konvergencijos modelio gamybos MTPKD intensyvumui. Priešingai, egzistuoja tam tikra konvergencijos tendencija paslaugų ir ŽIVP MTPKD intensyvumui.
Ištyrus MTPKD intensyvumą, mes apskaičiavome su gaminiais susijusių MTPKD srautus tarp ŽIVP ir likusių pramonės šakų. Išanalizavus 2005 metų ŽIVP sektorių, šalių klasifikavimas pagal vietinių, su gaminiais susijusių MTPKD pridėtinės vertės vienetui paplitimą rodo, kad Suomija yra ta šalis, kurioje ŽIVP atliko svarbiausio platintojo vaidmenį. Švedija, Čekijos respublika, Austrija ir Ispanija taip pat gali būti klasifikuojamos kaip didelio paplitimo šalys. Iš kitos pusės, Estija ir Vengrija parodė labai žemą su gaminiais susijusių MTPKD paplitimą pridėtinės vertės vienetui savo ŽIVP sektoriuose.
ŽIVP sektoriaus, kaip su gaminiais susijusių MTPKD platintojo vaidmuo, yra jo MTPKD intensyvumo funkcija ir būdas, kuriuo kiekviena šalis panaudoja ŽIVP vidines sąnaudas savo vietinės gamybos sistemose. Buvo rastas didelis atitikimas tarp MTPKD intensyvumo ir su gaminiais susijusių MTPKD paplitimo: kaip stiprūs platintojai, buvo šalys, turinčios aukštą MTPKD intensyvumą. Iš kitos pusės, Estija ir Vengrija buvo šalys, turinčios žemiausią MTPKD intensyvumą ir rodė žemus, su produktais susijusių MTPKD srautus pridėtinės vertės vienetui. Tačiau tai yra skirtumai, kurių paaiškinti negalima MTPKD išlaidomis, kurias patyrė ŽIVP sektorius. Bet tai galima paaiškinti jų ryšiais su likusiomis pramonės šakomis. Taigi, mes galime įžvelgti skirtumą tarp „stiprių“ ir „silpnų“ šalių platintojų, priklausomai nuo to ar jos sugeba išplatinti daugiau ar mažiau su gaminiais susijusių MTPKD per vidutinius ŽIVP pirkimus. „Stiprių“ platintojų grupėje išsiskiria Čekijos respublika. Slovėnija, Lenkija ir Italija. Jos taip pat pasinaudojo ŽIVP MTPKD išlaidų privalumais, nes paplitimo požiūriu jos vertinamos aukščiau negu MTPKD intensyvumo požiūriu. Priešingai, Airija, Rumunija, Belgija ir Olandija neatrodo pajėgios platinti su gaminiais susijusių MTPKD taip efektyviai, kaip kitos analizuotos šalys.
Analizuojamu laikotarpiu šalių hierarchija truputį pasikeitė, įvykus svarbiausiems pokyčiams Lenkijoje, Rumunijoje ir Italijoje, paplitimo srautas išliko beveik stabilus. Tik penkiose šalyse per nurodytą laikotarpį su gaminiais susijusių MTPKD pridėtinės vertės vienetui paplitimas sumažėjo: Slovėnijoje, Belgijoje, Suomijoje, Vengrijoje ir Švedijoje. Visais atvejais pagrindinė sumažėjimo priežastis buvo MTPKD intensyvumo sumažėjimas.
Apibendrinant galima sakyti, jog gauti rezultatai patvirtina, kad ŽIVP yra svarbi pramonės šaka inovacinei veiklai gerinti, nes ji vykdo stiprias MTPKD pastangas, kurios pasklinda į likusią gamybos sistemą. Nepaisant to, aukštą MTPKD intensyvumą ne visada sudaro didelio išskirstymo veiklos rodikliai. Šiuo atžvilgiu, ekonominė ir ypač inovacinė politika priimant sprendimus, turėtų atsižvelgti į ryšius tarp pramonės šakų.
Raktažodžiai: žinioms imlios verslo paslaugos, MTPKD, paplitimas, sąnaudos-išeiga, Europos Sąjunga.
The article has been reviewed.