79
LIFE CYCLE ASSESSMENT OF WHEAT PRODUCTION AND PROCESSING
SYSTEM
Jekayinfa, S.O
.1, Olaniran, J.A
1, Jaiyeoba, K.F.
2and Olujide, O.S.1
1
Department of Agricultural Engineering,
Ladoke Akintola University of Technology, Ogbomoso, Nigeria. 2
Department of Agricultural Engineering, Adeleke University, Ede, Nigeria.
ABSTRACT
Wheat being the leading source of vegetable protein in the human diets has higher protein content than other major staple grains or cereals like rice or maize; therefore it was necessary to study the environmental impacts associated with its field production and industrial processing using the life cycle assessment tool. The functional unit selected for the study was 1kg of wheat, and emission from various inputs into the system was aggregated into a large inventory table. Four environmental impacts were considered namely; global warming, acidification, eutrophication and ozone layer depletion. It was discovered that global warming has the highest impact score which is closely followed by eutrophication; 4.7153E – 02 kg CO2 equivalent and
3.5907E– 04kg NO3 -
equivalent respectively, while ozone layer depletion has the lowest environmental impact score of 1.1889E – 07 kg R11 equivalent. High emission of CO2 gas from fossil fuel during field operations
and processing of wheat was observed as the reason for the high impact score of global warming. Keywords: Wheat; Functional unit; Inventory; Life cycle assessment; Environmental impact.
1. INTRODUCTION
Previous studies and researches had shown the importance of Life Cycle Assessment (LCA) tool, in that it has been able to effectively determine the potential environmental impacts associated with a product throughout its life cycle, from the raw material acquisition through the production, use, end of life treatment, recycling and to final disposal (that is cradle to grave assessment) (Roy et al., 2009). LCA major function is for the identification of the parts of life cycle where the greatest improvement can be made. Due to great energy used by food industries, which is one of the world’s largest industrial sectors, it is important to take into consideration the effect of food production and processing such as green house gas emission, which has increased remarkably due to tremendous energy use and has resulted in global warming, which seems to be the most serious problem the humankind faces today (Roy et al., 2007). Food production, preservation and distribution consume a considerable amount of energy, which contribute to total CO2 emission, thus, it is essential
to evaluate the environmental impacts and utilization of resources in food production and distribution systems for sustainable consumption and this can be accomplished by the Life Cycle Assessment tool.
For an appropriate life cycle assessment to be conducted there is a need for critical and optimal
analysis of energy input into production and processing systems. Data collected include all energy requirements and emissions attributed to the acquisition, transportation and processing of fuels.’’ The objectives of life cycle assessment were to identify and quantify the potential environmental imparts associated with some agricultural production and processing, so as to identify the activities that are not performing sustainably’’ (Ntiamoah and Afrane 2007). So in order to analyse critically, the sources, causes and effects of the environmental impacts of wheat production and processing system, a critical study, using the life cycle assessment approach was carried out and this is aimed at investigating the possibility of reducing these environmental impacts
80
production and its’ processing into flour was considered.
2. MATERIALS AND METHOD
2.1 Materials: One of the instruments used to obtain data from wheat processing industry was a mercury thermometer (110°C) which was used to measure the ambient temperature of the environment, inlet and outlet temperature of mass flow in and out of the system. Other parameter taken such as fuel consumption rate, mass flow quantities and electric motor power ratings were all obtained from installations in the plant and inquiry from the plant operators.
The data on the wheat production and processing systems were collected using the various methods of data collection which are personal contacts, sites visitation, as well as personal observation on the selected site and main basic energetic parameters measured include; electrical, manual, and thermal energy.
2.2 Life Cycle Assessment Model: Life cycle assessment (LCA) has several standard steps, methods and procedures which had been specified for its application. A life-cycle assessment includes four phases according to the International Standard Organisations (ISO, 1997a), as outlined by Finnveden (1999):
a. Goal and scope definition: As stated in the aim of the study, the various contributions and impacts of emissions from the production and processing of wheat in four major environmental impacts were assessed. The environmental impact includes; global warming, acidification, eutrophication and ozone layer depletion. The functional unit for this study is one kilogram 1(kg). While the transportation of wheat was not included in the study because of the limitation of obtaining relevant data, the production stages of wheat which includes the bed preparation, planting, maintenance, harvesting, threshing and cleaning were considered alongside with its processing into flour and bran.
b. Inventory analysis: This phase deals with the data collection and data analysis of the inputs, outputs and emissions of wheat production and processing throughout its life cycle. The inventory analysis resulted in a large table of all inputs to the system (resources, etc.) and all outputs from the system (emissions such as CO2, SO2, NO2, CO etc.).
c. Life cycle impacts assessment: This phase aims at understanding and evaluating environmental impacts based on inventory analysis, within the framework of the goal and scope of the study. Likely human and ecological effect of material consumption and environmental releases identified during inventory analysis were calculated. According to Ntiamoah and Afrane (2007),
classification and characterisation following the ISO14042 (2000) guidelines were applied to the inventory data in order to assess the potential environmental impacts.
d. Interpretation of results: This was a systematic technique used to identify and quantify, check and evaluate information from the results of the inventory analysis and the impact assessment, in line with the defined goal and scope.
2.3 Method of Data Analysis: The quantities of fuel used for each of the operations in litres per hectare and the quantities in kilogram were found from the density of diesel which was taken as 860kg/m3 as given by Canavate and Hernanz (1997). The output - input ratio, output productivity and net energy gain of the wheat production system were also calculated using the equation given by Garavand et al. (2010) as stated below;
(1)
(2) (3)
As specified in literature, Life Cycle Inventory Assessment was carried out using the emission estimation method. Also from literature the characterization factors used to convert the values related to the functional unit into modelled environmental inputs and output data, aggregated to the inventory table for the Life Cycle Assessment were obtained.
CO2 emission from mobile and stationary engines
CO2 emission (kg) = Fuel combusted × HHV ×EFco2 (4)
N2O and CH4 emission from Mobile engines
N2O and CH4 emission (kg) = As × EFp,s (5)
N2O and CH4 emission from Stationary engines
N2O and CH4 emission (kg) = Fuel × HHV × EF (6)
NOx, SO2 and CO emission from mobile engines (fuel use basis)
Emission= Fuel × LF × EFi (7)
NOx, SO2 and CO emission from stationary engines
Emission= Pkw × OP (hrs) × EFi× (1- ER/100) (8)
Fuel combusted = mass or volume of fuel used in kg or litres
HHV = Default high heat value supplied = 45 MJ/kg for Diesel fuel
EFco2 = Emission factor for CO2 in fuel = 10.15
kg/gal for diesel = 2.91 kg/kg (density used = 860 kg / m3).
As = Activity level (miles 2
)
EF = Emission factor (kg/kg) = 8×10⁻⁶, 4.5×10⁻⁴, 9.84×10⁻³, 1.05 ×10⁻² and 1.14×10⁻³ for N2O, CH4,
CO, NOx and SO2 respectively.
LF = Load factor = 0.55 for wheeled tractor Pkw = engine power in kW
81
ER = emission reduction technology (wt %) (1 – ER/100) = 1.0, 0.8 1nd 1.0 for CO, NOx and
SO2 respectively.
Source: California air resource board institutional guidance for mandatory greenhouse gas Emission Reporting (2008), Emission estimation techniques manual for combustion engines (2002) and direct emission from mobile combustion sources (2008).
The emission of N2O from Nitrogen use in
wheat cultivation was calculated as specified by
Bouwan (1996) and quoted by Delucchi and Lipman (2003) and this is given as;
Loss = 1.00 + (0.0125× kg Nitrogen application) (9)
NOx and CH4 emissions were computed by
assuming 20% of applied Nitrogen and 10g /kg Nitrogen according to Holland et al. (1999) quoted by Delucchi and Lipman (2003).
Table 1: Energy values for various fuel types
Energy Source Energy content Production Total energy costs
Gasoline 38.2 MJ/L 8.1 MJ/L 46.3 MJ/L
Diesel 38.7 MJ/L 9.1 MJ/L 47.8 MJ/L
Fuel oil 38.7 MJ/L 9.1 MJ/L 47.8 MJ/L
LPG 6.1 MJ/L 6.2 MJ/L 32.3 MJ/L
Natural gas 41.4 MJ/m3 8.1 MJ/m3 49.5 MJ/m3
Coal 30.2 MJ/kg 2.4 MJ/kg 32.6 MJ/kg
Electricity 3.6MJ per kWh 8.4MJ per kWh 12.0 MJ/kWh
Source: Canavate and Hernanz (1997)
3. RESULTS AND DISCUSSION
Results of the energy analysis for wheat production system is based on calculations from about four (4) basic operations which are; land preparation (ploughing, harrowing and planting),
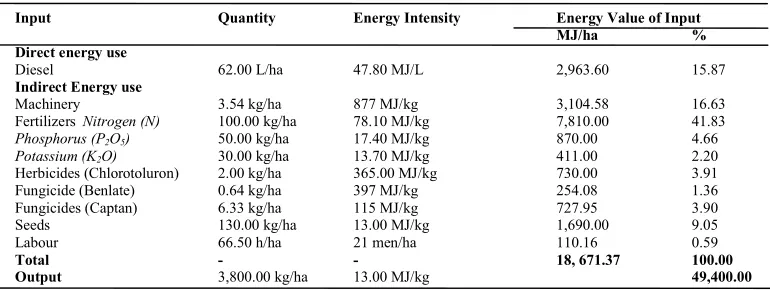
maintenance (fertilizer, pesticide and herbicide application), harvesting (drying, cleaning and threshing) and storage. Table 2 shows the detailed total energy use in the production of wheat based on the direct and indirect energy use.
Table 2: Energy consumption in wheat production
Input Quantity Energy Intensity Energy Value of Input
MJ/ha %
Direct energy use
Diesel 62.00 L/ha 47.80 MJ/L 2,963.60 15.87
Indirect Energy use
Machinery 3.54 kg/ha 877 MJ/kg 3,104.58 16.63
Fertilizers Nitrogen (N) 100.00 kg/ha 78.10 MJ/kg 7,810.00 41.83
Phosphorus (P2O5) 50.00 kg/ha 17.40 MJ/kg 870.00 4.66
Potassium (K2O) 30.00 kg/ha 13.70 MJ/kg 411.00 2.20
Herbicides (Chlorotoluron) 2.00 kg/ha 365.00 MJ/kg 730.00 3.91 Fungicide (Benlate) 0.64 kg/ha 397 MJ/kg 254.08 1.36 Fungicides (Captan) 6.33 kg/ha 115 MJ/kg 727.95 3.90
Seeds 130.00 kg/ha 13.00 MJ/kg 1,690.00 9.05
Labour 66.50 h/ha 21 men/ha 110.16 0.59
Total - - 18, 671.37 100.00
Output 3,800.00 kg/ha 13.00 MJ/kg 49,400.00
The highest energy consumption from Table 2 was observed from the energy sequestered in nitrogen (41.83%) and this is due to the fact that wheat production is associated with the use of large nitrogen fertilizer (100 kg Nitrogen needed). The energy use in machineries in the course of production contributes about 16.63% of the total energy in the system, the fuel quantities needed associated with machinery operations is also quite large (15.87%). The use of manual labour for
82
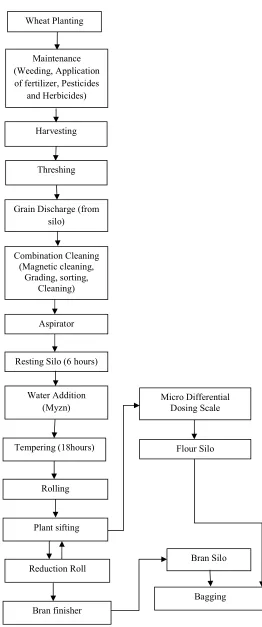
Figure 1: Flow chart of wheat flour production and processing systems.
Combination Cleaning (Magnetic cleaning,
Grading, sorting, Cleaning)
Aspirator Grain Discharge (from
silo)
Plant sifting Rolling Tempering (18hours)
Water Addition (Myzn) Resting Silo (6 hours)
Reduction Roll Wheat Planting
Maintenance (Weeding, Application of fertilizer, Pesticides
and Herbicides)
Harvesting
Threshing
Bran finisher
Bagging Bran Silo Micro Differential
Dosing Scale
83
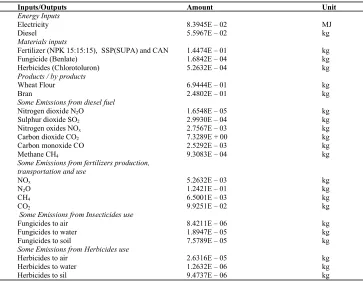
The life cycle assessment of wheat production and processing of one (1) kg wheat seed was performed to include the four phases of life cycle assessment as spelt out by the International Standard Organizations (ISO, 1997a), outlined by Finnveden (1999). The inventory table was formulated by using emission estimation methods for the emission of green house gases. The green house gas emissions from the production and transportation of 100kg SSP, 250kg CAN and 200kg NPK (15:15:15) fertilizers which are needed for fertilizing wheat were calculated from the emission estimation records of Wood and Cowie (2004), while the emission from the fertilizer use were calculated from the estimation methods and assumptions reviewed by Delucchi and Lipman (2003). Similarly, the emissions from insecticide and herbicide use were calculated from the methods specified by Rafaschieri et al. (1999). The Table 3 below shows the detailed Life Cycle inventory (LCI) of wheat production and processing system.
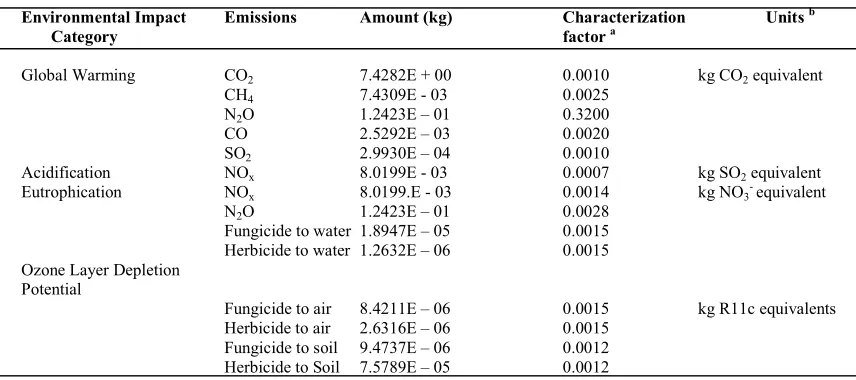
As indicated in Table 4, the impact category assessed by this study is limited to Global warming, Eutrophication, Acidification and Ozone
layer depletion. Table 5 on the other hand indicates the characterization factors and units used for the characterization of the emissions as classified on Table 6
The result of the characterization for production and processing of 1kg wheat as shown on the Table 5 indicated that Global warming has the highest impacts score (4.7153E – 02 kg CO2 equivalent)
and this is due to high combustion of diesel in the production and processing of wheat. Diesel is used as fuel or source of energy in the production of fertilizers, mobile field operations and stationary engines such as generators and threshers for the processing of the grains. Carbon dioxide (CO2)
contributes majorly to the high impact score of global warming and this is due to the incomplete combustion of the high carbon fuel. The impact score of eutrophication closely followed the high impact score of global warming, while ozone layer depletion has the least impact score. Figure 2 compares the impact scores of the four impact categories assessed in this study which shows the very minimal effect of ozone layer depletion and its relationship to other impact categories.
Table 3: Summary of inputs, outputs and emissions for the production and Processing of 1kg of wheat
Inputs/Outputs Amount Unit
Energy Inputs
Electricity 8.3945E – 02 MJ
Diesel 5.5967E – 02 kg
Materials inputs
Fertilizer (NPK 15:15:15), SSP(SUPA) and CAN 1.4474E – 01 kg
Fungicide (Benlate) 1.6842E – 04 kg
Herbicides (Chlorotoluron) 5.2632E – 04 kg
Products / by products
Wheat Flour 6.9444E – 01 kg
Bran 2.4802E – 01 kg
Some Emissions from diesel fuel
Nitrogen dioxide N2O 1.6548E – 05 kg
Sulphur dioxide SO2 2.9930E – 04 kg
Nitrogen oxides NOx 2.7567E – 03 kg
Carbon dioxide CO2 7.3289E + 00 kg
Carbon monoxide CO 2.5292E – 03 kg
Methane CH4 9.3083E – 04 kg
Some Emissions from fertilizers production, transportation and use
NOx 5.2632E – 03 kg
N2O 1.2421E – 01 kg
CH4 6.5001E – 03 kg
CO2 9.9251E – 02 kg
Some Emissions from Insecticides use
Fungicides to air 8.4211E – 06 kg
Fungicides to water 1.8947E – 05 kg
Fungicides to soil 7.5789E – 05 kg
Some Emissions from Herbicides use
Herbicides to air 2.6316E – 05 kg
Herbicides to water 1.2632E – 06 kg
84
Table 4: Classification Results for the production and Processing of 1kg of wheat
Environmental Impact Category Emissions Amount (kg)
Global Warming CO2 7.4282E + 00
CH4 7.4309E - 03
N2O 1.2423E - 01
CO 2.5292E – 03
SO2 2.9930E – 04
Acidification NOx 8.0199E - 03
Eutrophication NOx 8.0199E - 03
N2O 1.2423E - 01
Fungicide to water 1.8947E - 05 Herbicide to water 1.2632E - 06
Ozone Layer Depletion Fungicide to air 8.4211E - 06
Herbicide to air 2.6316E - 06 Fungicide to soil 9.4737E – 06 Herbicide to Soil 7.5789E – 05
Table 5: Characterization results for the production and Processing of 1kg of wheat
Environmental Impact Total Impact Score Units b
Category
Global Warming 4.7206E - 02 kg CO2 equivalent
Acidification 5.6139E - 06 kgSO2 equivalent
Eutrophication 3.5907E - 04 kg NO3- equivalent
Ozone Layer Depletion 1.1889E - 07 kg R11equivalent
Table 6: Characterization Factors for the production and Processing of 1kg of wheat
Environmental Impact Emissions Amount (kg) Characterization Units b
Category factor a
Global Warming CO2 7.4282E + 00 0.0010 kg CO2 equivalent
CH4 7.4309E - 03 0.0025
N2O 1.2423E – 01 0.3200
CO 2.5292E – 03 0.0020
SO2 2.9930E – 04 0.0010
Acidification NOx 8.0199E - 03 0.0007 kg SO2 equivalent
Eutrophication NOx 8.0199.E - 03 0.0014 kg NO3- equivalent
N2O 1.2423E – 01 0.0028
Fungicide to water 1.8947E – 05 0.0015 Herbicide to water 1.2632E – 06 0.0015 Ozone Layer Depletion
Potential
Fungicide to air 8.4211E – 06 0.0015 kg R11c equivalents Herbicide to air 2.6316E – 06 0.0015
Fungicide to soil 9.4737E – 06 0.0012 Herbicide to Soil 7.5789E – 05 0.0012
a: Characterization factors are obtained from Kasmaprapruet et al. (2009) and Frischknecht et al. (2004). b: The units are obtained from Kasmaprapruet et al. (2009) and Ntiamoah (2007).
85 CONCLUSION
The life cycle assessment of wheat production and processing system investigated the various potential environmental impacts associated with the system as a result of the inputs, outputs, emissions, total energy use and losses from the system. The system considered was as a result of the great importance of wheat in the diet and nutrition of man. The assessment showed that global warming has the highest impact score and this is due to the high combustion of diesel in the production and processing of wheat as shown by the carbon dioxide emissions due to the incomplete combustion of diesel. The high impact score of global warming potential of wheat production and processing system can be checked by encouraging the use of fuel derived from biological sources such as biodiesel in combustion engines instead of fossil fuels uses. This will in turn reduce the emission associated with fertilizer production and transportation. Also, the use of organic fertilizer or manure can be encouraged in order to reduce the large use of inorganic fertilizer which causes high pollution to the environment.
REFERENCES
California Air Resource Board Institutional Guidance for Mandatory Greenhouse Gas Emission Reporting (2008), Common calculation methods.
Canavate, J.O. and Hernanz, J.L. (1997): Energy for Biological Systems. In CIGR International Commission of Agricultural Engineering (Ed): CIGR Handbook for Agricultural
Engineering, Energy and Biomass
Engineering, volume 5, pages 13-26
Climate Leaders Greenhouse Gas Inventory Protocol Core Module Guidance (2008): Direct Emission from Mobile Combustion Sources, United State Environmental Protection Agency Office of Air and Radiation.
Delucchi, M.A., and Lipman, T. (2003): Emission Related to Cultivation and Fertilizer Use. An Appendix to the Report: A Life Cycle Emission Model (LEM): Life Cycle Emission from Transportation Fuels, Motor Vehicles, Transportation Modes, Electricity Use, Heating and Cooking Fuels and Material. Institute of Transportation Studies, University of California
Environment Australia (2002): Emission estimation techniques manual for combustion engines. Finnveden, G. (1999):A Critical Review of
Operational Valuation/Weighting Methods for Life Cycle Assessment, Swedish
Environmental Protection Agency
GAFR-Report 253, AFN, Naturvårdsverket Frischknecht, R., Jungbluth, N., Althaus, H.J.,
86
G., Speielmann, M. (2004): The Eco – Invent Database: Overveiw and Methodological Framework. Ecomed Publisher, Landsberg, Germany, and FL Worth / TX, Tokyo, Mumbai, Seoul, Melbourne and Paris
ISO (International Organization for Standardization), (1997): ISO 14040: 1997(a). Environmental Management – Life Cycle Assessment Principles and Framework
ISO (International Organization for Standardization), (2007): ISO 14040: 1997(a). Environmental Management – Life Cycle Assessment Principles and Framework
Kasmaprapraut, S., Paengjuntuek, W., Phungrassami, H. and Saikhwan, P. (2009): Life Cycle Assessment of Milled Rice Production; Case Study of Thailand.
European Journal of Scientific Research
National Agricultural Extension and Research Liaison Services (NAERLS) (2004): Wheat Production in Nigeria, Federal Department of Agricultural Extension Bulletin, No. 62
Ntiamoah, A. and Afrane, G. (2007): Environmental Impacts of Cocoa Production and Processing in Ghana: Life Cycle Assessment Approach. Journal of Cleaner Production, pages 1735- 1740
Rafaschieri, A., Rapaccini, M. and Manfrida, G. (1999): Life Cycle Assessment of electricity production from poplar energy crops compared with conventional fossil fuels. Energy Conversion and Management, pages1482 – 1484
Roy, P., Nei, D., Orikasa, T., Xu, Q., Okadome, H., Nakamura, N. and Shiina, T. (2007): A Review of Life Cycle Assessment of Some Food Products. Journal of Food Engineering, 2009, pages 1-10
Wikipedia, the Free Encyclopaedia (2011): Wheat.
Retrieved June 28, 2011,http: //www.en.wikipedia.org/ wiki/Wheat Wood, S. and Cowie, A. (2004): A Review of