V
OLUMEN
O.
10
(2020),
I
SSUEN
O.
01
(J
ANUARY)
ISSN
2231-5756
A Monthly Double-Blind Peer Reviewed (Refereed/Juried) Open Access International e-Journal - Included in the International Serial Directories
Indexed & Listed at:
Ulrich's Periodicals Directory ©, ProQuest, U.S.A., Cabell’s Directories of Publishing Opportunities, U.S.A., Google Scholar, Indian Citation Index (ICI), J-Gage, India [link of the same is duly available at Inflibnet of University Grants Commission (U.G.C.)],
Index Copernicus Publishers Panel, Poland with IC Value of 5.09 (2012) & number of libraries all around the world.
V
OLUMEN
O.
10
(2020),
I
SSUEN
O.
01
(J
ANUARY)
ISSN
2231-5756
CONTENTS
Sr.
No.
TITLE & NAME OF THE AUTHOR (S)
Page
No.
1
.
SMART CLASS METHOD: AN EFFECTIVE PEDAGOGY OF
TEACHING SOCIAL SCIENCE AT SECONDARY LEVEL
JOHNY K. P. & Dr. H. N VISHWANATH
1
2
.
A STUDY ON CAPITAL STRUCTURE AND FINANCIAL
PERFORMANCE OF SELECTED CEMENT COMPANIES IN
INDIA
H. NAVITHA RANI
4
3
.
EMPLOYEE RETENTION STRATEGY IN IT INDUSTRY: A CASE
STUDY OF TCS LTD.
PRIYANKA PRIYADARSHINI
8
V
OLUMEN
O.
10
(2020),
I
SSUEN
O.
01
(J
ANUARY)
ISSN
2231-5756
FOUNDER PATRON
Late Sh. RAM BHAJAN AGGARWAL
Former State Minister for Home & Tourism, Government of Haryana
Former Vice-President, Dadri Education Society, Charkhi Dadri
Former President, Chinar Syntex Ltd. (Textile Mills), Bhiwani
CO-ORDINATOR
Dr. BHAVET
Former Faculty, Shree Ram Institute of Engineering & Technology, Urjani
ADVISOR
Prof. S. L. MAHANDRU
Principal (Retd.), Maharaja Agrasen College, Jagadhri
EDITOR
Dr. PARVEEN KUMAR
Professor, Department of Computer Science, NIMS University, Jaipur
CO-EDITOR
Dr. A. SASI KUMAR
Professor, Vels Institute of Science, Technology & Advanced Studies (Deemed to be University), Pallavaram
EDITORIAL ADVISORY BOARD
Dr. S. P. TIWARI
Head, Department of Economics & Rural Development, Dr. Ram Manohar Lohia Avadh University, Faizabad
Dr. CHRISTIAN EHIOBUCHE
Professor of Global Business/Management, Larry L Luing School of Business, Berkeley College, USA
Dr. SIKANDER KUMAR
Vice Chancellor, Himachal Pradesh University, Shimla, Himachal Pradesh
Dr. JOSÉ G. VARGAS-HERNÁNDEZ
Research Professor, University Center for Economic & Managerial Sciences, University of Guadalajara,
Guadala-jara, Mexico
Dr. TEGUH WIDODO
Dean, Faculty of Applied Science, Telkom University, Bandung Technoplex, Jl. Telekomunikasi, Indonesia
Dr. M. S. SENAM RAJU
Professor, School of Management Studies, I.G.N.O.U., New Delhi
Dr. A SAJEEVAN RAO
Professor & Director, Accurate Institute of Advanced Management, Greater Noida
Dr. D. S. CHAUBEY
Professor & Dean (Research & Studies), Uttaranchal University, Dehradun
Dr. CLIFFORD OBIYO OFURUM
Professor of Accounting & Finance, Faculty of Management Sciences, University of Port Harcourt, Nigeria
Dr. KAUP MOHAMED
Dean & Managing Director, London American City College/ICBEST, United Arab Emirates
Dr. VIRENDRA KUMAR SHRIVASTAVA
Director, Asia Pacific Institute of Information Technology, Panipat
Dr. MIKE AMUHAYA IRAVO
Principal, Jomo Kenyatta University of Agriculture & Tech., Westlands Campus, Nairobi-Kenya
Dr. SYED TABASSUM SULTANA
Principal, Matrusri Institute of Post Graduate Studies, Hyderabad
Dr. BOYINA RUPINI
Director, School of ITS, Indira Gandhi National Open University, New Delhi
Dr. NEPOMUCENO TIU
V
OLUMEN
O.
10
(2020),
I
SSUEN
O.
01
(J
ANUARY)
ISSN
2231-5756
Dr. SANJIV MITTAL
Professor & Dean, University School of Management Studies, GGS Indraprastha University, Delhi
Dr. RAJENDER GUPTA
Convener, Board of Studies in Economics, University of Jammu, Jammu
Dr. SHIB SHANKAR ROY
Professor, Department of Marketing, University of Rajshahi, Rajshahi, Bangladesh
Dr. SRINIVAS MADISHETTI
Professor, School of Business, Mzumbe University, Tanzania
Dr. NAWAB ALI KHAN
Professor & Dean, Faculty of Commerce, Aligarh Muslim University, Aligarh, U.P.
MUDENDA COLLINS
Head, Operations & Supply Chain, School of Business, The Copperbelt University, Zambia
Dr. EGWAKHE A. JOHNSON
Professor & Director, Babcock Centre for Executive Development, Babcock University, Nigeria
Dr. A. SURYANARAYANA
Professor, Department of Business Management, Osmania University, Hyderabad
P. SARVAHARANA
Asst. Registrar, Indian Institute of Technology (IIT), Madras
Dr. MURAT DARÇIN
Associate Dean, Gendarmerie and Coast Guard Academy, Ankara, Turkey
Dr. ABHAY BANSAL
Head, Department of Information Technology, Amity School of Engg. & Tech., Amity University, Noida
Dr. YOUNOS VAKIL ALROAIA
Head of International Center, DOS in Management, Semnan Branch, Islamic Azad University, Semnan, Iran
WILLIAM NKOMO
Asst. Head of the Department, Faculty of Computing, Botho University, Francistown, Botswana
Dr. JAYASHREE SHANTARAM PATIL (DAKE)
Faculty in Economics, KPB Hinduja College of Commerce, Mumbai
SHASHI KHURANA
Associate Professor, S. M. S. Khalsa Lubana Girls College, Barara, Ambala
Dr. SEOW TA WEEA
Associate Professor, Universiti Tun Hussein Onn Malaysia, Parit Raja, Malaysia
Dr. OKAN VELI ŞAFAKLI
Professor & Dean, European University of Lefke, Lefke, Cyprus
Dr. MOHENDER KUMAR GUPTA
Associate Professor, Government College, Hodal
Dr. BORIS MILOVIC
Associate Professor, Faculty of Sport, Union Nikola Tesla University, Belgrade, Serbia
Dr. LALIT KUMAR
Course Director, Faculty of Financial Management, Haryana Institute of Public Administration, Gurugram
Dr. MOHAMMAD TALHA
Associate Professor, Department of Accounting & MIS, College of Industrial Management, King Fahd University
of Petroleum & Minerals, Dhahran, Saudi Arabia
Dr. V. SELVAM
Associate Professor, SSL, VIT University, Vellore
Dr. IQBAL THONSE HAWALDAR
Associate Professor, College of Business Administration, Kingdom University, Bahrain
Dr. PARDEEP AHLAWAT
Associate Professor, Institute of Management Studies & Research, Maharshi Dayanand University, Rohtak
Dr. ALEXANDER MOSESOV
V
OLUMEN
O.
10
(2020),
I
SSUEN
O.
01
(J
ANUARY)
ISSN
2231-5756
Dr. ASHOK KUMAR CHAUHAN
Reader, Department of Economics, Kurukshetra University, Kurukshetra
Dr. BHAVET
Former Faculty, Shree Ram Institute of Engineering & Technology, Urjani
YU-BING WANG
Faculty, department of Marketing, Feng Chia University, Taichung, Taiwan
SURJEET SINGH
Faculty, Department of Computer Science, G. M. N. (P.G.) College, Ambala Cantt.
Dr. TITUS AMODU UMORU
Professor, Kwara State University, Kwara State, Nigeria
Dr. RAJESH MODI
Faculty, Yanbu Industrial College, Kingdom of Saudi Arabia
Dr. SAMBHAVNA
Faculty, I.I.T.M., Delhi
Dr. THAMPOE MANAGALESWARAN
Faculty, Vavuniya Campus, University of Jaffna, Sri Lanka
Dr. SHIVAKUMAR DEENE
Faculty, Dept. of Commerce, School of Business Studies, Central University of Karnataka, Gulbarga
SURAJ GAUDEL
BBA Program Coordinator, LA GRANDEE International College, Simalchaur - 8, Pokhara, Nepal
FORMER TECHNICAL ADVISOR
AMITA
FINANCIAL ADVISORS
DICKEN GOYAL
Advocate & Tax Adviser, Panchkula
NEENA
Investment Consultant, Chambaghat, Solan, Himachal Pradesh
LEGAL ADVISORS
JITENDER S. CHAHAL
Advocate, Punjab & Haryana High Court, Chandigarh U.T.
CHANDER BHUSHAN SHARMA
Advocate & Consultant, District Courts, Yamunanagar at Jagadhri
SUPERINTENDENT
V
OLUMEN
O.
10
(2020),
I
SSUEN
O.
01
(J
ANUARY)
ISSN
2231-5756
CALL FOR MANUSCRIPTS
We invite unpublished novel, original, empirical and high quality research work pertaining to the recent developments & practices in the areas of Com-puter Science & Applications; Commerce; Business; Finance; Marketing; Human Resource Management; General Management; Banking; Economics; Tourism Administration & Management; Education; Law; Library & Information Science; Defence & Strategic Studies; Electronic Science; Corporate Gov-ernance; Industrial Relations; and emerging paradigms in allied subjects like Accounting; Accounting Information Systems; Accounting Theory & Practice; Auditing; Behavioral Accounting; Behavioral Economics; Corporate Finance; Cost Accounting; Econometrics; Economic Development; Economic History; Financial Institutions & Markets; Financial Services; Fiscal Policy; Government & Non Profit Accounting; Industrial Organization; International Economics & Trade; International Finance; Macro Economics; Micro Economics; Rural Economics; Co-operation; Demography: Development Planning; Development Studies; Applied Economics; Development Economics; Business Economics; Monetary Policy; Public Policy Economics; Real Estate; Regional Economics; Political Science; Continuing Education; Labour Welfare; Philosophy; Psychology; Sociology; Tax Accounting; Advertising & Promotion Management; Management Information Systems (MIS); Business Law; Public Responsibility & Ethics; Communication; Direct Marketing; E-Commerce; Global Business; Health Care Administration; Labour Relations & Human Resource Management; Marketing Research; Marketing Theory & Applications; Non-Profit Or-ganizations; Office Administration/Management; Operations Research/Statistics; Organizational Behavior & Theory; Organizational Development; Pro-duction/Operations; International Relations; Human Rights & Duties; Public Administration; Population Studies; Purchasing/Materials Management; Re-tailing; Sales/Selling; Services; Small Business Entrepreneurship; Strategic Management Policy; Technology/Innovation; Tourism & Hospitality; Transpor-tation Distribution; Algorithms; Artificial Intelligence; Compilers & Translation; Computer Aided Design (CAD); Computer Aided Manufacturing; Computer Graphics; Computer Organization & Architecture; Database Structures & Systems; Discrete Structures; Internet; Management Information Systems; Mod-eling & Simulation; Neural Systems/Neural Networks; Numerical Analysis/Scientific Computing; Object Oriented Programming; Operating Systems; Pro-gramming Languages; Robotics; Symbolic & Formal Logic; Web Design and emerging paradigms in allied subjects.
Anybody can submit the soft copy of unpublished novel; original; empirical and high quality research work/manuscriptanytime in M.S. Word format after preparing the same as per our GUIDELINES FOR SUBMISSION; at our email address i.e. [email protected] or online by clicking the link online
submission as given on our website (FOR ONLINE SUBMISSION, CLICK HERE).
GUIDELINES FOR SUBMISSION OF MANUSCRIPT
1. COVERING LETTER FOR SUBMISSION:
DATED: _____________
THE EDITOR
IJRCM
Subject: SUBMISSION OF MANUSCRIPT IN THE AREA OF______________________________________________________________.
(e.g. Finance/Mkt./HRM/General Mgt./Engineering/Economics/Computer/IT/ Education/Psychology/Law/Math/other, please specify)
DEAR SIR/MADAM
Please find my submission of manuscript titled ‘___________________________________________’ for likely publication in one of your journals.
I hereby affirm that the contents of this manuscript are original. Furthermore, it has neither been published anywhere in any language fully or partly, nor it is under review for publication elsewhere.
I affirm that all the co-authors of this manuscript have seen the submitted version of the manuscript and have agreed to inclusion of their names as co-authors.
Also, if my/our manuscript is accepted, I agree to comply with the formalities as given on the website of the journal. The Journal has discretion to publish our contribution in any of its journals.
NAME OF CORRESPONDING AUTHOR :
Designation/Post* :
Institution/College/University with full address & Pin Code : Residential address with Pin Code : Mobile Number (s) with country ISD code : Is WhatsApp or Viber active on your above noted Mobile Number (Yes/No) : Landline Number (s) with country ISD code :
E-mail Address :
Alternate E-mail Address :
Nationality :
* i.e. Alumnus (Male Alumni), Alumna (Female Alumni), Student, Research Scholar (M. Phil), Research Scholar (Ph. D.), JRF, Research Assistant, Assistant Lecturer, Lecturer, Senior Lecturer, Junior Assistant Professor, Assistant Professor, Senior Assistant Professor, Co-ordinator, Reader, Associate Profes-sor, ProfesProfes-sor, Head, Vice-Principal, Dy. Director, Principal, Director, Dean, President, Vice Chancellor, Industry Designation etc. The qualification of
V
OLUMEN
O.
10
(2020),
I
SSUEN
O.
01
(J
ANUARY)
ISSN
2231-5756
NOTES:
a) The whole manuscript has to be in ONE MS WORD FILE only, which will start from the covering letter, inside the manuscript. pdf.
version is liable to be rejected without any consideration.
b) The sender is required to mention the following in the SUBJECT COLUMNof the mail:
New Manuscript for Review in the area of (e.g. Finance/Marketing/HRM/General Mgt./Engineering/Economics/Computer/IT/ Education/Psychology/Law/Math/other, please specify)
c) There is no need to give any text in the body of the mail, except the cases where the author wishes to give any specific message
w.r.t. to the manuscript.
d) The total size of the file containing the manuscript is expected to be below 1000 KB.
e) Only the Abstract will not be considered for review and the author is required to submit the complete manuscript in the first instance.
f) The journal gives acknowledgement w.r.t. the receipt of every email within twenty-four hours and in case of non-receipt of
acknowledgment from the journal, w.r.t. the submission of the manuscript, within two days of its submission, the corresponding author is required to demand for the same by sending a separate mail to the journal.
g) The author (s) name or details should not appear anywhere on the body of the manuscript, except on the covering letter and the cover page of the manuscript, in the manner as mentioned in the guidelines.
2. MANUSCRIPT TITLE: The title of the paper should be typed in bold letters, centeredand fully capitalised.
3. AUTHOR NAME (S) & AFFILIATIONS: Author (s) name, designation, affiliation (s), address, mobile/landline number (s), and email/al-ternate email address should be given underneath the title.
4. ACKNOWLEDGMENTS: Acknowledgements can be given to reviewers, guides, funding institutions, etc., if any.
5. ABSTRACT: Abstract should be in fully Italic printing, ranging between 150 to 300 words. The abstract must be informative and eluci-dating the background, aims, methods, results & conclusion in a SINGLE PARA. Abbreviations must be mentioned in full.
6. KEYWORDS: Abstract must be followed by a list of keywords, subject to the maximum of five. These should be arranged in alphabetic order separated by commas and full stop at the end. All words of the keywords, including the first one should be in small letters, except special words e.g. name of the Countries, abbreviations etc.
7. JEL CODE: Provide the appropriate Journal of Economic Literature Classification System code (s). JEL codes are available at www.aea-web.org/econlit/jelCodes.php. However, mentioning of JEL Code is not mandatory.
8. MANUSCRIPT: Manuscript must be in BRITISH ENGLISH prepared on a standard A4 size PORTRAIT SETTING PAPER. It should be free
from any errors i.e. grammatical, spelling or punctuation. It must be thoroughly edited at your end.
9. HEADINGS: All the headings must be bold-faced, aligned left and fully capitalised. Leave a blank line before each heading. 10. SUB-HEADINGS: All the sub-headings must be bold-faced, aligned left and fully capitalised.
11. MAIN TEXT:
THE MAIN TEXT SHOULD FOLLOW THE FOLLOWING SEQUENCE:
INTRODUCTION REVIEW OF LITERATURE
NEED/IMPORTANCE OF THE STUDY STATEMENT OF THE PROBLEM OBJECTIVES
HYPOTHESIS (ES)
RESEARCH METHODOLOGY RESULTS & DISCUSSION FINDINGS
RECOMMENDATIONS/SUGGESTIONS CONCLUSIONS
LIMITATIONS
SCOPE FOR FURTHER RESEARCH REFERENCES
APPENDIX/ANNEXURE
V
OLUMEN
O.
10
(2020),
I
SSUEN
O.
01
(J
ANUARY)
ISSN
2231-5756
12. FIGURES & TABLES: These should be simple, crystal CLEAR, centered, separately numbered & self-explained, and the titles must be above the table/figure. Sources of data should be mentioned below the table/figure. It should be ensured that the tables/figures are
referred to from the main text.
13. EQUATIONS/FORMULAE: These should be consecutively numbered in parenthesis, left aligned with equation/formulae number placed at the right. The equation editor provided with standard versions of Microsoft Word may be utilised. If any other equation editor is utilised, author must confirm that these equations may be viewed and edited in versions of Microsoft Office that does not have the editor.
14. ACRONYMS: These should not be used in the abstract. The use of acronyms is elsewhere is acceptable. Acronyms should be defined on its first use in each section e.g. Reserve Bank of India (RBI). Acronyms should be redefined on first use in subsequent sections. 15. REFERENCES: The list of all references should be alphabetically arranged. The author (s) should mention only the actually utilised
references in the preparation of manuscript and they may follow Harvard Style of Referencing. Also check to ensure that everything
that you are including in the reference section is duly cited in the paper. The author (s) are supposed to follow the references as per the following:
All works cited in the text (including sources for tables and figures) should be listed alphabetically. Use (ed.) for one editor, and (ed.s) for multiple editors.
When listing two or more works by one author, use --- (20xx), such as after Kohl (1997), use --- (2001), etc., in chronologically ascending order.
Indicate (opening and closing) page numbers for articles in journals and for chapters in books.
The title of books and journals should be in italic printing. Double quotation marks are used for titles of journal articles, book chapters, dissertations, reports, working papers, unpublished material, etc.
For titles in a language other than English, provide an English translation in parenthesis.
Headers, footers, endnotes and footnotes should not be used in the document. However, you can mention short notes to elucidate
some specific point, which may be placed in number orders before the references.
PLEASE USE THE FOLLOWING FOR STYLE AND PUNCTUATION IN REFERENCES:
BOOKS
Bowersox, Donald J., Closs, David J., (1996), "Logistical Management." Tata McGraw, Hill, New Delhi. Hunker, H.L. and A.J. Wright (1963), "Factors of Industrial Location in Ohio" Ohio State University, Nigeria.
CONTRIBUTIONS TO BOOKS
Sharma T., Kwatra, G. (2008) Effectiveness of Social Advertising: A Study of Selected Campaigns, Corporate Social Responsibility, Edited by David Crowther & Nicholas Capaldi, Ashgate Research Companion to Corporate Social Responsibility, Chapter 15, pp 287-303.
JOURNAL AND OTHER ARTICLES
Schemenner, R.W., Huber, J.C. and Cook, R.L. (1987), "Geographic Differences and the Location of New Manufacturing Facilities," Jour-nal of Urban Economics, Vol. 21, No. 1, pp. 83-104.
CONFERENCE PAPERS
Garg, Sambhav (2011): "Business Ethics" Paper presented at the Annual International Conference for the All India Management Asso-ciation, New Delhi, India, 19–23
UNPUBLISHED DISSERTATIONS
Kumar S. (2011): "Customer Value: A Comparative Study of Rural and Urban Customers," Thesis, Kurukshetra University, Kurukshetra.
ONLINE RESOURCES
Always indicate the date that the source was accessed, as online resources are frequently updated or removed.
WEBSITES
V
OLUMEN
O.
10
(2020),
I
SSUEN
O.
01
(J
ANUARY)
ISSN
2231-5756
SMART CLASS METHOD: AN EFFECTIVE PEDAGOGY OF TEACHING SOCIAL SCIENCE AT SECONDARY LEVEL
JOHNY K. P.
Ph. D. RESEARCH SCHOLAR
BHARATHIAR UNIVERSITY
COIMBATORE
Dr. H. N VISHWANATH
ASST. PROFESSOR
SARADA VILAS COLLEGE OF EDUCATION
MYSORE
ABSTRACT
Social Science, one of the important subjects of school curriculum has been considered as an outdated subject in contemporary educational system. The conventional way of teaching Social Science develops a negative attitude towards the subject which can be overcome by using technology at various levels of teaching learning process. The present article focuses on the effectiveness of Smart Class Method of teaching Social Science at secondary level to create more interest and focused learning among students. The investigator experimented using smart class method on experimental group and normally practiced method on controlled group after equating them using pre-test. After experimentation, post-test was administered on both groups to study the effectiveness of smart class method and normally practiced method for comparative analysis.
KEYWORDS
smart class method, normally practiced method, achievement in social science.
JEL CODES
A20, I20.1. INTRODUCTION
ducation at secondary level focuses on achieving the highest strata of academic excellence in a specific domain and in the overall development of a child. Knowledge gets advanced when students learn all subjects with equal importance at secondary level. However, pupils have a negative perception regarding the learning of Social Science at secondary level, though it has a great importance and application in day today life. Therefore, the present education system adopts smart class method as a techno based pedagogy in the teaching of Social Science to present historical data in an interesting way, so as to enhance motivation and focused learning in secondary level. The present article focuses on the effectiveness of smart class method of teaching in terms of achievement in Social Science of the students of standard IX.
2. CONCEPT OF SMART CLASS
The development of technology has enormous impact on education system in India. Smart Class is one of the recent technological developments in teaching-learning method introduced by private enterprises to improve the quality of teaching and teaching-learning. Smart Class is an advanced version of multimedia approach, which enhances quality in both content and pedagogy. Smart Class method has been executed through digital instructional technologies. Gwak (2010) proposed the concept of smart learning as follows: first, it is focused on learners and content more than on devices; second, it is effective, intelligent, tailored learning based on advanced IT infrastructure. Smart class method is an information software package which brings quality of content and methodology for teaching and learning. Lee et al. (2014) proposed that the features of smart learning include formal and informal learning, social and collaborative learning, personalized and situational learning and more focus on application of content.
3. IMPORTANCE OF THE STUDY
The study focusses on the effectiveness of Smart Class Method on the Achievement in Social Science among the selected students of standard IX in Chennai district. The sample of the study includes two hundred students from eight schools as experimental and control groups. The need and importance of the present study is looked from two perspectives viz. one side there is a negative attitude towards the study of Social Science as outdated and boring subject as teachers use the conventional method of teaching and on the other hand, there is a demand for a technological innovation in teaching and learning of the same. Therefore, the researcher examines the effectiveness of smart class method used by some schools in teaching learning process of Social Science in comparison to the Normally Practiced Method of teaching the same.
4. OBJECTIVES OF THE STUDY
1. To compare the effectiveness of Smart Class method and Normally Practiced Method on the Achievement of IX standard students in Social Science. 2. To compare the effectiveness of Smart Class method on the Achievement of IX standard Boys and Girls in Social Science.
5. HYPOTHESES
There is no significant difference between the effectiveness of Smart Class method and Normally Practiced Method on the Achievement of IX standard students in Social Science.
There is no significant difference between the effectiveness of Smart Class method on the Achievement of IX standard Boys and Girls in Social Science.
6. RESEARCH METHOD
The present study adopted quantitative research method to analyze the effectiveness of smart class method on the academic achievement of children. By applying deductive approach, suitable research hypotheses were framed in line with the study objectives. The hypotheses were tested with the help of the quantitative data collected using quantitative instruments for the same. The data collected were subjected to statistical analyses and meaningful inferences were drawn from the results.
SAMPLING PROCEDURE
The researcher adopted purposive sampling method for the study. The sample consists of selected one hundred students each from both groups studying in class IX in Chennai district who follow samacheerkalvi syllabus. In the present study, the researcher selected the students who secured average score as equated groups in Social Science from the schools selected to be under experimental and control groups.
V
OLUMEN
O.
10
(2020),
I
SSUEN
O.
01
(J
ANUARY)
ISSN
2231-5756
TOOLS USED FOR THE STUDY a) Achievement Tests in Social Science b) Lesson Transcripts for Smart Class Method c) Lesson Plans for Normally Practiced Method d) Socio Economical Status Scale.
STATISTICAL TECHNIQUE USED
The statistical technique used for the present study are a) Socio-Economic status of the participants is analyzed with the help of Descriptive Statistics, b) the psychometric properties, i.e. the reliability and validity of the questionnaire were tested using Split Half Method by Spearman Brown, Cronbach’s Alpha and
Exploratory Factor Analysis (EFA), c) Normality assumptions were carried out using Kolmogorov-Smirnov Test and Shapiro-Wilk Test as the sample size is 100 for each group and d) based on the results of the normality tests, non-parametric test, Wilcoxon Signed Rank test and Mann-Whitney U Test were carried out to compare the groups (pre-test and post-test groups / normally practiced method and smart class method groups).
7. ANALYSIS AND RESULTS
H1: There is no significant difference between the effectiveness of Smart Class method and Normally Practiced Method on the achievement of IX standard students in Social Science.
In order to determine, whether the pre and post test scores varied based on the type of teaching method adopted (SCM or NPM), Mann Whitney U test was conducted. This test was adopted as the dependent variable, i.e. the pre- and post-test scores, was measured on a continuous scale and the independent variable has two groups, Smart Class Method and Normally Practiced Method. It is observed from the results that the pre-test scores of IX standard students who were taught using the NPM (Mean Rank=101.34) was higher than those taught using the SCM (Mean Rank=99.66). However, the pre-test scores of the NPM group were not found to be statistically significantly higher (p>0.05) than those of the SCM group.
TABLE 1: COMPARISON BETWEEN NPM AND SCM IN PRE-TEST AND NPM AND SCM IN POST TEST
Group N Mean Rank Sum of Ranks Mann-Whitney U Sig.
Pre Test NPM 100 101.34 10134.00 4916.000 0.836
SCM 100 99.66 9966.00
Post Test NPM 100 50.51 5051.00 1.000 0.000
SCM 100 150.49 15049.00
Mann-Whitney U test on the post-test scores of IX standard students show that the post-test scores of the SCM group (Mean Rank=150.49) was higher than the post-test scores of the NPM group (Mean Rank=50.51). It can be concluded from the data that the post-test score of SCM group is statistically significantly higher (p<0.05) than the post-test scores of NPM group.
Thus, from the above analysis, it can be inferred that both the methods NPM and SCM produced significant changes in the mean pre- and post-scores. However, the post-test scores of SCM group were found to be significantly higher than that of the NPM group. Therefore, H1 has been rejected and the alternate hypothesis “There exists a significant difference between the effectiveness of Smart Class Method and Normally Practiced Method on the achievement of IX standard students in Social Science” has been accepted.
H2. There is no significant difference in the effectiveness of Smart Class method on the Achievement of IX standard Boys and Girls in Social Science
In order to determine, whether the pre and post test scores of those in the SCM group varied based on their gender (Boys and Girls), Mann Whitney U test was conducted. This test was adopted as the dependent variable, i.e. the pre- and post-test scores, was measured on a continuous scale and the independent variable has two groups, Boys and Girls. The Table 2 depicts that the pre-test scores of IX standard Boys who were taught using the SCM (Mean Rank=54.21) was higher than those of the IX standard girls (Mean Rank=46.79). However, the pre-test scores of the Boys were found not significantly higher (p>0.05) than those of the Girls.
TABLE 2: COMPARISON BETWEEN THE PRETEST SCORE OF BOYS AND GIRLS AND POST TEST SCORE OF BOYS AND GIRLS IN SOCIAL SCIENCE
Gender N Mean Rank Sum of Ranks Mann-Whitney U Sig.
Smart Class-Pre-Test Girls 50 46.79 2339.50 1064.500 0.197
Boys 50 54.21 2710.50
Smart Class-Post Test Girls 50 52.75 2637.50 1137.500 0.432
Boys 50 48.25 2412.50
Mann-Whitney U test on the post-test scores of the SCM group show that the post-test scores of the Girls (Mean Rank=52.75) was higher than the post-test scores of the Boys (Mean Rank=48.25). However, the post-test scores of the Girls were not found to be significantly higher (p>0.05) than those of the Boys. Thus, it can be inferred from the above analysis that the effectiveness of Smart Class Method did not vary between the IX standard boys and girls. Therefore, the hypothesis, H2 has been accepted.
8. MAJOR FINDINGS
1. The post-test scores of IX standard social science students taught using the NPM had a mean rank of 50.51, while the post-test scores of IX standard students taught using the SCM had a mean rank of 150.49, indicating that the post-test score of the SCM was higher than the NPM, found to be significant (0.00 < 0.05). Therefore, it is interpreted as there is a significant difference between the effectiveness of Smart Class Method and Normally Practiced Method on the achievement of IX standard students in Social Science
2. The post-test SCM scores of the IX standard girls in social science was non-significantly higher than the IX standard boys in social science (34.84 ± 2.02 and mean rank of 52.72; 34.48 ± 1.96 and mean rank of 48.25; 0.43 > 0.05). Therefore, the result indicated that the smart class method is effective to enhance the achievement in social science but did not differ between the boys and girls of IX standard pursuing Social Science.
9. RECOMMENDATIONS
The study emphasizes that teachers dealing Social Studies need to develop multimedia learning skills for uplifting the all-round excellence of students. The study propose that teachers can incorporate techno based strategic approach to increase their performance. The present work implemented a pre and post achievement test which is highly informative to the students, teachers, parents and to the members formulating the educational policies in terms of focused learning. The study adds a definite educational message in India, where the usual chalkboard teaching method is followed. The benefits clearly necessitate the attention of the poli-cymakers to incorporate a greater number of smart class method in school curriculum to create an optimistic atmosphere of learning.
10. CONCLUSIONS
V
OLUMEN
O.
10
(2020),
I
SSUEN
O.
01
(J
ANUARY)
ISSN
2231-5756
REFERENCES
1. Creswell, J. W. (2007). Research Design: Qualitative, Quantitative, and Mixed Methods Approaches, Sage Publications.
2. Crotty, M. (2003): The Foundations of Social Research: Meaning and Perspectives in the Research Process, London: Sage Publications, 3rd edition, 10. 3. D. Gwak, (2010). The Meaning and Predict of Smart Learning, Smart Learning Korea Proceeding, Korean e-Learning Industry Association.
4. Dr. Sreedevi, P.S., (2016) Professional Development and ICT in Education, (ICT tools a Boon for Teaching and Learning of History), APH Publishing Corporation, New Delhi.
5. G.J. Hwang, (2008) Criteria, Strategies and Research Issues of Context-Aware Ubiquitous Learning. J. Educ. Technol. Soc 11(2), 81–91. 6. https://edufocus.blogspot.com/2012/01/social-science-meaning-nature-and-scope.html
7. J. Lee, H. Zo, H. Lee, (2014) Smart Learning Adoption in Employees and HRD Managers. Br. J. Educ. Technol. 45(6), 1082–1096. 8. J.C, Aggarwal (2014). Teaching of Social Science, a Practical Approach, Vikas Publish House, Pvt., Ltd. Noida,
9. Kasyap, A K. Teaching of Social Studies, Pearl Books, New Delhi, 2015.
10. Silverman, D. (2013). Doing qualitative research: A practical handbook. SAGE Publications Limited.
11. Tageja, R (2014). Effect of teaching in smart classroom on the achievement, retention and creativity of high secondary school students of commerce (PhD thesis). Retrieved from http:hgl.handle.net/10603/54124.
V
OLUMEN
O.
10
(2020),
I
SSUEN
O.
01
(J
ANUARY)
ISSN
2231-5756
A STUDY ON CAPITAL STRUCTURE AND FINANCIAL PERFORMANCE OF SELECTED CEMENT COMPANIES IN
INDIA
H. NAVITHA RANI
LECTURER
PRAGATI MAHAVIDYALAYA JUNIOR, DEGREE & P.G. COLLEGE
KOTI
ABSTRACT
The capital structure refers to the relationship between the various long term in the forms of financials such as debenture, preference share capital and equity in financing the firm’s assets are in every business proper mix of debt and equity capital in financing the firm’s asset. The long term fixed interest bearing debt and preference share capital along with equity share is called financial leverage or trading equity. The financial performance is the analysis of process of financial strength and weakness of the firm. It can be establishing the relationship between the items of balance sheet and profit and loss account. It helps in short and long term forecasting and growth can be identified with the help of financial performance analysis. The study is made to attempt to analyze the capital structure and financial performance of selected cement companies in India.
KEYWORDS
cement companies, capital structure, financial performance, conception frame work.
JEL CODES
L611. INTRODUCTION
he company’s assets can be financed by increasing the owners claim or the creditors claim. The owners, claims increase when the firm raises funds by using ordinary shares or by retaining the earnings, the creditors’ claims increase by borrowing. The various means of financing represents the financial structure of an enterprise. The capital structure is used to represent the proportionate relationship between debt and equity. Equity includes paid up share capital share premium and reserves and surplus. The capital structure decision is a significant managerial decision, it influences on the shareholders returns and risk. Financial performance is the act or performing financial activity and it refers to the degree of the financial objectives has been accomplished. It is the process of measuring the results of a company’s policies and operations and it measures companies overall financial health over a period of time. The performance of any organization can be measured by using financial results of earnings; riskiness and profitability are two major factors determine the value of a business.
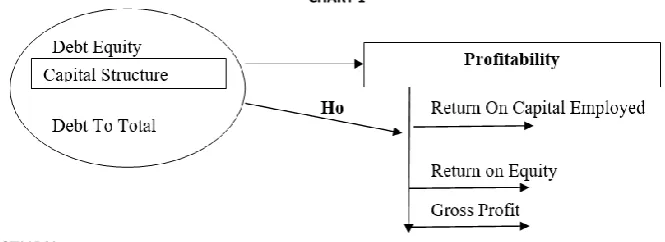
Capital Structure: In finance, capital structure refers to the way a corporation finances its assets through some combination of equity, debt, or hybrid securities.
A firm’s capital structure is then the composition or ‘structure’ of its liabilities. The variables used to study the capital structure of a firm are, Debt to equity and
Debt to total funds.
Debt To Equity: A measure of a company’s financial leverage calculated by dividing its total liabilities by stockholders equity. It indicates what proportion of equity
and debt the company is using to finance its assets.
Total Liabilities
Debt To Equity = --- Share holders Equity
Debt To Total Funds: A measurement of a company’s financial leverage, calculated as the company’s debt divided by its total capital Debt includes all short-term
and long-term obligations. Total capital includes the company’s debt and shareholders ’equity, which includes common stock, preferred stock, minority interest and net debt.
Calculated as:
Debt
Debt To Capital Ratio = ---
Shareholders’ equity +Debt
Profitability: The state or condition of yielding a financial profit or gain. It is often measured by different profitability ratios which are a class of financial metrics that are used to assess a business’s ability to generate earnings as compared to its expenses and other relevant costs incurred during a specific period of time.for most of these ratios, having a higher value relative to a competitor’s ratio from a period is indicative that the company is doing well. The variables or profitability ratio’s used in this study are
Return on capital employed (ROCE) Return on equity (ROE)
Return On Capital Employed: A financial ratio that measures a company’s profitability and the efficiency with which its capital is employed. Return on Capital
Employed (ROCE) is calculated as:
Earnings before Interest and Tax (EBIT)
ROCE = ---
Capital Employed
“Capital Employed “as shown in the denominator is the sum of shareholders’ equity and debt liabilities; it can be simplified as (Total Assets-Current Liabilities). Instead of using capital employed at an arbitrary point in time, analysis and investors often calculate ROCE based on” Average Capital Employed,”which takes the average of opening and closing capital employed for the time period. A higher ROCE should be higher than the company’s capital cost, otherwise it indicates that the company is not employing it effectively and is not generating shareholder value.
Return On Equity: The amount of net income returned as a percentage of shares holders equity. Return on equity measures a corporation’s profitability by revealing how much profit a company generates with the money shareholders have invested. ROE is expressed as a percentage and calculated as:
Net Income
Return On Equity = --- Shareholder’s Equity Gross Profit Ratio
Gross Profit ratio is the ratio of gross profit to net sales that is sales less sales returns. The ratio reflects the margin of profit that concern is able to earn on its trading and manufacturing activity. It is the most commonly calculated ratio.
V
OLUMEN
O.
10
(2020),
I
SSUEN
O.
01
(J
ANUARY)
ISSN
2231-5756
Gross Profit
Gross Profit Ratio = --- x 1 00 Net sales
Gross profit ratio is the ratio of gross profit to net sales i.e. sales less sales returns. The ratio thus reflects the margin of profit that a concern is able to earn on its trading and manufacturing activity. It is the most commonly calculated ratio. It is employed for inter-firm and inter-firm comparison of trading results.
CONCEPTION MODEL
CHART 1
2. OBJECTIVES OF THE STUDY
1. To analyze the components of capital structure of selected Cement companies 2. To study the relationship of capital structure among the selected Cement companies. 3. To analyze the variability of capital structure of selected Cement companies.
3. RESEARCH METHODOLOGY
The research study is based on secondary data. To analyze the capital structure and financial performance of the cement industry the data is collected from the company’s annual reports and websites.
3.1 PERIOD OF THE STUDY
The present study covers a period of five years 2015 to 2019 3.2 SAMPLE SIZE
To carry out the study sample 6 companies’ selected form cement industry. The lists of companies are Ultratech cement Limited, Shree Cement Limited, India Cement Limited, ACC Ltd, Ramco Cements, and J K Cement. All the five companies are listed in BSE.
3.3 TOOLS AND TECHNIQUES
To analyze the data simple percentage analysis, correlation and Analysis of variance is used.
4. REVIEW OF LITERATURE
Abor (2005) investigates the relationship between capital structure and profitability of listed firms on the Ghana Stock Exchange and find a significantly positive relation between the ratio of short-term debt to total assets and ROE and negative relationship between the ratio of long-term debt to total assets and ROE. Chiang et al., (2002) the study shows the interrelationship between profitability, cost of capital and structure among property developers and contractors in HongKong.
Gill, et al., (2011) seeks to extend Abor’s (2005) findings regarding the effect of capital structure on profitability by examining the effect of capital structure on profitability of the American service and manufacturing firms. The Empirical results of the study show a positive relationship between short-term debt to total assets and profitability and between total debt to total assets and profitability in the service industry. The findings of this paper also show a positive relationship between short-term debt to total assets and profitability, long-term debt to total assets and profitability, and between total debt to total assets and profitability in the manufacturing industry.
Pandey, (2009) Capital Structure is referred to as the way in which the firm finances itself through debts, equity and securities. It is the composition of debt and equity that is required for a firm to finance its assets.
Mendell, 2006) investigated financing practices across firms in the forest products industry by studying the relationship between debt and taxes hypothesized in finance theory. In testing the theoretical relationship between taxes and capital structure for 20 publicly traded forest industry firms for the years 1994-2003, the study finds a negative relationship between profitability and debt, a positive relationship between non-debt tax shields and debt, and a negative relationship between firm size and debt.
Modigliani and miller (1958) have a theory of “capital structure irrelevance” where argued that financial leverage does not affect the firm’s market value with assumptions related to homogenous expectations, perfect capital markets and no taxes.
Sarkar and Zapatero (2003) find a positive relationship between leverage and profitability. Myers and Majluf (1984) find firms that are profitability and generate high earnings are expected to use less debt capital comparing with equity than those that do not generate high earnings.
5. ANALYSIS AND INTERPRETATION
TABLE 1: DEBT TO EQUITY
Company/Year 2015 2016 2017 2018 2019 Mean SD CV
Ultratech Cement 0.63 0.64 0.22 0.23 0.35 0.41 0.21 0.50
Shree Cements 0.29 0.38 0.17 0.11 0.12 0.21 0.12 0.55
India Cements 0.57 0.57 0.52 0.71 0.81 0.64 0.12 0.19
ACC Ltd 0.00 0.01 0.01 0.00 0.00 0.00 0.01 1.37
Ramco Cements 0.32 0.25 0.30 0.57 0.86 0.46 0.26 0.56
J K Cements 0.73 1.02 1.31 1.46 1.47 1.20 0.32 0.27
Source: Computed form Annual Reports of the Companies from 2015 to 2019 using MS Excel Software
V
OLUMEN
O.
10
(2020),
I
SSUEN
O.
01
(J
ANUARY)
ISSN
2231-5756
TABLE 2: DEBT TO TOTAL FUNDS
Company/Year 2015 2016 2017 2018 2019 Mean SD CV
Ultratech Cement 0.69 0.68 0.72 0.78 0.68 0.71 0.04 5.98%
Shree Cements 0.57 0.57 0.52 0.71 0.81 0.64 0.12 18.92%
India Cements 0.65 0.66 0.60 0.69 0.73 0.67 0.05 7.25%
ACC Ltd 0.00 0.00 0.01 0.00 0.00 0.00 0.00 100.00%
Ramco Cements 0.45 0.34 0.50 0.68 0.89 0.57 0.22 37.77%
J K Cements 0.74 1.43 1.65 1.55 1.33 1.34 0.36 26.61%
Source: Computed form Annual Reports of the Companies from 2015 to 2019 using MS Excel Software
The above table 2 describes that among all the cement companies Ultratech, Shree Cement, India Cement, ACC Ltd, Ramco Cements and J K Cements are levered companies having debt to total funds ratio is 0.71,0.64,0.64,0.67,0.00,0.57 and 1.34 respectively. The standard deviation indicates that 0.04, 0.12, 0.05, 0.00, 0.22 and 0.36. The J K Cement is highly levered and ACC Ltd with lowest debt to total funds ratio with mean score of 1.34 and 0.00. it is clear that the J.K Cements have highest standard deviation of 0.36 and ACC Ltd with lowest standard deviation of 0.00. This indicates that these companies have made very few changes in their capital structure.
TABLE 3: RETURN ON CAPITAL EMPLOYED
Company/Year 2015 2016 2017 2018 2019 Mean SD CV
Ultratech Cement 10.69 10.88 13.96 8.78 7.62 10.39 2.42 23.26%
Shree Cements 11.4 11.36 14.59 13.77 6.5 11.52 3.15 27.35%
India Cements 5.08 5.58 7.96 9.9 7.63 7.23 1.95 26.93%
ACC Ltd 13.97 13.93 6.44 6.54 13.1 10.80 3.95 36.58%
Ramco Cements 12.47 10.60 19.11 10.07 4.30 11.31 5.32 47.07%
J K Cements 12.59 14.60 13.11 2.25 3.71 9.25 5.80 62.64%
Source: Computed form Annual Reports of the Companies from 2015 to 2019 using MS Excel Software
The above table 3 describes that among all the cement companies Ultratech, Shree Cement, India Cement, ACC Ltd, Ramco Cements and J K Cements are levered companies having Return on Capital Employed ratio is 10.39, 11.52,7.23,10.80,11.31 and 9.25 respectively. The standard deviation indicates 2.4, 2, 3.15, 1.95, 3.95, 5.32 and 5.80. The Shree cement is highly levered and India Cement with lowest Return on Capital Employed with mean score of 11.52 and 7.23. it is clear that the J.K Cements have highest standard deviation of 5.80 and India Cements with lowest standard deviation of 1.95. This indicates that these companies have made very few changes in their returns on capital structure.
TABLE 4: RETURN ON EQUITY
Company/Year 2015 2016 2017 2018 2019 Mean SD CV
Ultratech Cement 8.78 8.6 10.97 10.95 10.7 10.00 1.20 12.00%
Shree Cements 9.9 15.55 17.39 16.69 8.07 13.52 4.24 31.37%
India Cements 1.32 1.93 3.39 4.06 0.89 2.32 1.36 58.56%
ACC Ltd 14.31 9.77 6.95 7 14.2 10.44 3.65 35.00%
Ramco Cements 11.34 13.74 17.35 18.05 9.16 13.93 3.81 27.38%
J K Cements 11.23 15.92 11.26 5.92 9.53 10.77 3.61 33.48%
Source: Computed form Annual Reports of the Companies from 2015 to 2019 using MS Excel Software
The above table -4 describes that among all the cement companies Ultratech, Shree Cement, India Cement, ACC Ltd, Ramco Cements and J K Cements are levered companies having Return on Equity ratio is 10.0, 13.52,2.32,10.44,13.93 and 10.7 respectively. The standard deviation indicates 2.4, 2, 3.15, 1.95, 3.95, 5.32 and 5.80. The Shree cement is highly levered and India Cement with lowest Return on Capital Employed with mean score of 11.52 and 7.23. it is clear that the J.K Cements have highest standard deviation of 5.80 and India Cements with lowest standard deviation of 1.95. This indicates that these companies have made very few changes in their returns on capital structure.
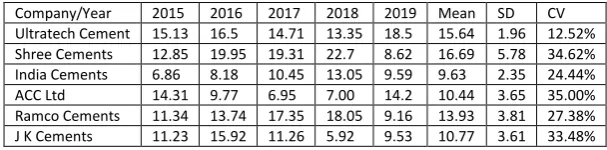
TABLE 5: GROSS PROFIT RATIO
Company/Year 2015 2016 2017 2018 2019 Mean SD CV
Ultratech Cement 15.13 16.5 14.71 13.35 18.5 15.64 1.96 12.52%
Shree Cements 12.85 19.95 19.31 22.7 8.62 16.69 5.78 34.62%
India Cements 6.86 8.18 10.45 13.05 9.59 9.63 2.35 24.44%
ACC Ltd 14.31 9.77 6.95 7.00 14.2 10.44 3.65 35.00%
Ramco Cements 11.34 13.74 17.35 18.05 9.16 13.93 3.81 27.38%
J K Cements 11.23 15.92 11.26 5.92 9.53 10.77 3.61 33.48%
Source: Computed form Annual Reports of the Companies from 2015 to 2019 using MS Excel Software
The above table 4 describes that among all the cement companies Ultratech, Shree Cement, India Cement, ACC Ltd, Ramco Cements and J K Cements are levered companies having Gross Profit ratio is 15.64,16.69,9.63,10.44,13.93 and 10.77 respectively. The standard deviation 1.96,5.78,2.35,3.65,3.81 and 3.61. The Shree cement is highly levered and India Cement with lowest Return on Capital Employed with mean score of 16.69 and 9.63. It is clear that the Shree Cements have highest standard deviation of 5.78 and Ultra Tech Cements with lowest standard deviation of 1.96. This indicates that these companies have made very few changes in their returns on capital structure.
TABLE 6: CAPITAL STRUCTURE AND RETURN OF SELECTED COMPANIES IN RATIOS
Company/Variables Debt equity Debit to Total Funds Return on Capital Employed Return on Equity Gross Profit Ratio
Ultratech Cement 0.41 0.71 10.39 10 15.64
Shree Cements 0.21 0.64 11.52 13.52 16.69
India Cements 0.64 0.67 7.23 2.32 9.63
ACC Ltd 0.00 0 10.8 10.44 10.44
Ramco Cements 0.46 0.57 11.31 13.93 13.93
J K Cements 1.20 1.34 9.25 10.77 10.77
Source: Computed form Annual Reports of the Companies from 2015 to 2019 using MS Excel Software Ho: There no significant difference between selected Companies Capital Structure and Returns on Capital Structure.
V
OLUMEN
O.
10
(2020),
I
SSUEN
O.
01
(J
ANUARY)
ISSN
2231-5756
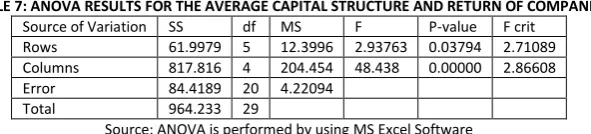
TABLE 7: ANOVA RESULTS FOR THE AVERAGE CAPITAL STRUCTURE AND RETURN OF COMPANIES
Source of Variation SS df MS F P-value F crit
Rows 61.9979 5 12.3996 2.93763 0.03794 2.71089
Columns 817.816 4 204.454 48.438 0.00000 2.86608
Error 84.4189 20 4.22094
Total 964.233 29
Source: ANOVA is performed by using MS Excel Software
From the above table-7 it is known that the selected companies calculated F value is 2.93763, when degrees of freedom are 5, p value is 0.03794 is less than the 5% level significance hence the null hypothesis rejected. There is a significant deference among selected cement companies. The selected variables Debt equity, Debt to Total Equity, Return on Capital Employed, Return on Equity, and Gross Profit, calculated F value is 48.438, when degrees of freedom is 4, p value is 0.000 is less than the 5% level significance hence the null hypothesis rejected. There is a significant deference among selected variables.
TABLE 8: CORRELATION ANALYSIS OF CAPITAL STRUCTURE AND RETURN OF SELECTED COMPANIES
Debt equity Debit to Total Funds Return on Capital Employed Return on Equity Gross Profit Ratio
Debt equity 1
Debit to Total Funds 0.92242 1
Return on Capital Employed -0.5508 -0.3466 1
Return on Equity -0.2225 -0.0295 0.9328 1
Gross Profit Ratio -0.3437 0.01728 0.70433 0.64066 1
Source: Computed form Annual Reports of the Companies from 2015 to 2019 using MS Excel Software
The above table–8 indicates that relationship between selected capital structure and profitability is significant negative. The negative association unsuitable debt equity mix in the capital structure of the concerned companies there by having a negative impact on the select profitability variables. The following table shows the results of relationship between the selected variables.
TABLE 9: RESULTS OF RELATIONSHIP BETWEEN CAPITAL STRUCTURE AND RETURNS OF SELECTED COMPANIES
Testing of Hypothesis Person Correlation
There is relationship between Debt Equity and Debit to Total Funds 0.92242 There is relationship between Debt Equity and Return on Capital Employed -0.5508
There is relationship between Debt Equity and Return on Equity -0.2225
There is relationship between Debt Equity and Gross Profit Ratio -0.3437
There is relationship between Debit to Total Funds and Return on Capital Employed -0.3466 There is relationship between Debit to Total Funds and Return on Equity -0.0295 There is relationship between Debit to Total Funds and Gross Profit Ratio 0.01728
6. FINDINGS
There is a positive correlation between Debt Equity and Debit to Total Funds.
There is a negative correlation between Debt Equity and Return on Capital Employed.
There is a negative correlation between Debt Equity and Return on Equity.
There is a negative correlation between Debt Equity and Gross Profit Ratio.
There is a negative correlation between Debit to Total Funds and Return on Capital Employed.
There is a negative correlation between Debit to Total Funds and Return on Equity.
There is a positive correlation between Debit to Total Funds and Gross Profit Ratio.
There is a significant deference among selected variables and companies.
7. CONCLUSION
The present study highlighted the capital structure and financial performance of cement industries. The financial performance plays a significant role in the suc-cessful functioning of industries. Poor financial performance threats very survival and leads to business failure. The cement companies could improve the perfor-mance of identifying and concentrating the relevant areas measured and the attention must be taken to improve thereby.
The optimum capital structure is on among the pre requisites of company for staying fit and maintains profitability in this complex business. To analyze capital structure and profitability of 6 companies in India five years period from 2015 to 2019 the study covers not have a sound debt equity composition of their capital structure and failed to the benefits of leverage properly. The companies should be given on the following areas that to improve the existing situation in order to have positive impact on profitability of the cement industry.
Cement companies have scope to increase debt level in their existing capital structure so that the companies can enjoy the benefits of leverage. Management should focus on internal factors like production policy and marketing policy so that the fluctuation in profitability can reduced.
REFERENCES
1. Abor, J. (2005), “The Effect of Capital Structure on Profitability: An Empirical Analysis of Listed Firms in Ghana”, The Journal of Risk Finance, Vol. 6 No.5. 2. Chiang, Y.H., Chan, P.C.A., & Hui, C.M.E., (2002). “Capital structure and profitability of the property and construction sectors in Hong Kong”. Journal of Property
Investment and Finance, 20(6), pp. 434-454.
3. Gill, Amarjit, Nahum Biger, Neil Mathur, (2011). “The effect of capital structure on profitability: Evidence from the United States”. International Journal of Management, Vol. 28, No. 4, Part 1, pp. 3-15.
4. Mendell, B.C., Sydor, T., & Mishra, N., (2006). “Capital structure in the United States forest products industry: The influence of debt and taxes”. Forest Science, 52(5), pp. 540-548.
5. Modigliani, F. & Miller, M., (1958). “The cost of capital, corporation finance and the theory of investment”. The American Economic Review, 48(3), pp. 261-97.
6. Pandey, I. M., 2004. ‘Capital Structure, Profitability and Market Structure: Evidence from Malaysia.’ Asia Pacific Journal of Economics and Business 8(2): 78– 91.
7. Sarkar, S., and F. Zapatero. (2003). “The Trade-Off Model with Mean Reverting Earnings: Theory and Empirical Tests”. The Economic Journal, 113 (490), pp. 834–60.
BOOKS
8. Wright M.G., “Financial Management”, Tata McGraw-Hill publishing Co. New Delhi, 1978.
V
OLUMEN
O.
10
(2020),
I
SSUEN
O.
01
(J
ANUARY)
ISSN
2231-5756
EMPLOYEE RETENTION STRATEGY IN IT INDUSTRY: A CASE STUDY OF TCS LTD.
PRIYANKA PRIYADARSHINI
M. Phil. RESEARCH SCHOLAR
PG DEPARTMENT OF BUSINESS MANAGEMENT
FAKIR MOHAN UNIVERSITY
VYASA VIHAR
ABSTRACT
This paper examines the importance of employee retention strategy for IT Industry in general and analyses the employee retention strategy implemented by Tata Consultancy Services Limited in particular. The paper also assesses its impact on organizational competence building. An Exploratory and Descriptive study was conducted through secondary data analysis and review of literature. The study concludes that TCS has developed strong employee retention measures like attractive compensation packages, career planning and development opportunities, performance appraisal, employee reward and recognition system and attrition control measures which have greatly contributed to their organizational competence building by increasing job satisfaction, employee productivity, developing loyalty and commitment to the organization, less absenteeism and less turnover, increasing customer satisfaction and good relations with other stakeholders, and cost saving.
KEYWORDS
TCS Ltd., retention strategies, organizational competence building.
JEL CODES
M12, M50, M51, M52, M54.
INTRODUCTION
mployee retention strategy refers to the techniques employed by the management to help the employees stay with the organization for a longer period of time. Employee retention measures go a long way in motivating the employees so that they stick to the organization for the maximum time and contribute effectively. Employee retention has become a major concern for corporates in the current scenario. Individuals once being trained have a tendency to move to other organizations for better prospects. Lucrative salary, comfortable timings, better ambience, growth prospects are some of the factors which prompt an employee to look for a change. Organizations need to make enormous efforts to attract talented employees and retain them in the organization.
Organizational competencies are the unique factors that make an organization competitive and are difficult for competitors to imitate. Organizational competen-cies cannot be outsourced no matter how much money is available because they are fundamental to the organization and its success. Happy, motivated and performing employees contribute to the organizational competence building by their performance, therefore organizations need to develop innovative employee retention policies to retain them for future.
REVIEW OF LITERATURE
A number of research studies have been undertaken to emphasize the role of employee retention strategy in competence building in organizations. Mckeown (2010) stated that employee retention is a systematic effort by employers to create and foster an environment that encourages current employees to remain employed by having policies and practices in place that address their diverse needs. Employee retention refers to the ability of an organization to retain its em-ployees. A distinction should be drawn between low-performing employees and top performers, and efforts to retain employees should be targeted at valuable, contributing employees.
Career opportunities have the strongest impact on employee commitment while the impact of financial rewards is less. Providing career development opportuni-ties makes the employees to stay in the company for long and at the same time enhances their loyalty to the firm. Also creating a positive social work environment and adding content to the jobs and tasks to be done by the employees enhances employee satisfaction and commitment. (Meganck, 2007).
Various reasons cited for employee attrition are: dissatisfaction with internal job postings, work profile, personal causes and finally dissatisfaction with compen-sation/ salary (Bhatnagar, 2007). So for better retention of talent, organizations must improve pay/compensation and benefits and also factors like good working conditions, flexible work timings, cooperative teams, good bosses, culture and values of the organization (Devi, 2009).
Employee rewards, employee autonomy and image of the company play a major role in employee retention and commitment in the organization (Gberevbie, 2010).
Gayathri et al (2012) said that frustration and constant friction with their superiors or other team members are the real reasons of most employees leaving an organization and identified mentoring, well equipped safety environment, potential and prospective roles, encouragement and recognition and competitive com-pensation as the significant variables that influences employee retention. Providing emotional support and work life balance to employees helps organizations in low turnover (Karatepe 2013).
Bagga (2013) emphasizes that induction plays a major role in employee retention and increases loyalty towards the organization. A number of employees usually leave within first three months of joining so it is clear that if proper induction of new joiners’ is not done they will tend to leave the organization. A well planned orientation program must be planned to help retain employees.
George (2015)find out two types of retention factors one at organization level and at job level. Organizational factors are management, pleasant environment, social support and developmental opportunities. Factors at job level are compensation, autonomy, work-load and work life balance. It was found that organiza-tional level factors are more important for employee retention then job level factors.
IMPORTANCE OF THE STUDY
Employee turnover is very high in IT organizations in India as skilled workforce has umpteen number of opportunities to choose from, prompting each organization to compete with the other in continuously developing attractive and innovative retention strategies to hold back their critical workforce. When employees are motivated, happy in their workplace they work for their company with sincerity and dedication which contribute to organizational productivity leading to organi-zational competence building.
Tata Consultancy Services Limited (TCS) has developed a very effective employee retention strategy in IT sector in India. The innovative strategies adopted by TCS are: recruitment and Selection Process online through portals called 'Next-Step’ and ‘Campus Connect’ and creation of ‘Knome’ (TCS's internal online social net-work- a facility not provided in other IT Companies), shifting employees across departments and organizing training programmes to keep workforce up to date with fast changing technology.
Therefore, there is a need to conduct an in-depth study on how TCS has managed its huge workforce by designing employee retention strategy and their impact on organization competence building.