Correlation and Path Coefficient Analysis of some Coffee (Coffea arabica L.) Accessions using Quantitative Traits in Ethiopia
IJPBCS
Correlation and Path Coefficient Analysis of some Coffee
(Coffea arabica
L.) Accessions using Quantitative Traits
in Ethiopia
*Abdulfeta Tariku Kifle
1, Hussein Mohammed Ali
2, Ashenafi Ayano
31,3Ethiopian Institute of Agricultural Research, Jimma Agricultural Research Center, P.O. Box192, Jimma,
Ethiopia
2Hawassa University College of Agriculture, School of Plant and Horticultural Sciences, P.O. Box 05,
Hawassa, Ethiopia
The present investigation was carried out to study the correlation and path coefficient analysis among 22 quantitative traits of 93 coffee (Coffea arabica L) germplasm accessions, including five standard checks, which were collected from Tepi and its surroundings (Bench-Maji and Sheka zones) using augmented design with four blocks. Analysis of variance revealed significant difference among the accessions in leaf length, leaf width, leaf area, number of primary branches, fruit length, bean length, bean width, bean thickness, hundred bean weight and green bean yield. Number of secondary branch, stem girth, fruit traits (fruit length, fruit width, fruit thickness) and bean traits (bean length, bean thickness and hundred bean weight) had the highest positive correlation with green bean yield both at genotypic and phenotypic levels. Bean width and coffee leaf rust had negative correlation with green bean yield both at genotypic and phenotypic levels. Number of secondary branch was the only characters that showed positive and highly significant genotypic correlation with clean coffee yield. Path coefficient analysis of the phenotypic correlations revealed that number of secondary branches (0.449) and fruit thickness (0.280) had the highest positive direct effect, while length of primary branch and bean width had the highest negative direct effects, suggesting that these traits can be used for indirect selection of high yielding accessions. However proper consideration should made about stem girth, plant height, number of primary branches, leaf size and bean width. Hence, selection for these traits can improve coffee bean yield and this could be exploited in the genetic improvement of the crop through hybridization and selection.
Key words: Coffea arabica, Correlation, Path coefficient analysis, Coffee leaf rust, Ethiopia.
INTRODUCTION
Coffee belongs to the genus Coffea in the Rubiacea family, grown in the tropical and subtropical regions (Berthaud and Charrier, 1988). Out of 124 species of the genus Coffea, (Davis et al.,2012) Coffea arabica Linnaeus (Arabica coffee) and Coffea Canephora Pierre (Robusta coffee) are the two most important commercial species, former one accounts for two-third of the world coffee production, whereas the remaining proportion comes from later one (Anthony et al.,2002; Labouisse et al.,2008). Ethiopia is center of origin and diversity of Arabica coffee
( C . a r a b i c a L) and mainly producing by the South,
South-west and Eastern parts of the country. In these areas found the famous coffee types including Yirgacheffe, Sidama, Limmu, Gimbi and Harar coffee types (Bayetta,1997). The overall land area devoted to coffee production due to new plantings is increasing and estimated to be 700474.69 hectares, of which 469091.12 tons are estimated to be productive with an average productivity of about 669.6 kg ha-1 (CSA,2017).
*Corresponding author: Abdulfeta Tariku Kifle, Ethiopian
Institute of Agricultural Research, Jimma Agricultural Research Center, P.O. Box192, Jimma, Ethiopia. E-mail:
International Journal of Plant Breeding and Crop Science
Vol. 5(2), pp. 383-390, July, 2018. © www.premierpublishers.org.
ISSN
: 2167-0449
Ethiopia is the largest producer of coffee in Africa and the fifth largest coffee producer in the world next to Brazil, Vietnam, Colombia and Indonesia, contributing about 4.2 % of the total world coffee production (ICO, 2016). Knowledge of correlation between yield and its contributing traits is enormously essential to find out guidelines for plant selection (Yadav et al., 2011). It suggests the advantage of a scheme of selection for more than one character at a time (Simmonds, 1986). The path coefficient analysis furnishing the cause and effect of different yield component would provide better index for selection rather than mere correlation coefficients. It partitions the correlations into direct and indirect effects and hence has effectively been used in identifying useful traits as selection criteria to improve yield (Akinwale et al., 2011; Sadeghi, 2011). Yield in coffee is commercially an important trait in breeding goals of coffee improvement. Therefore, it is desirable to know the direct and indirect effect of yield related traits in coffee.
In Arabica coffee breeding programs, characters associations studies have been conducted elsewhere but rarely in Ethiopian. For instance, Gessese et al.,(2015) showed positive correlation with yield and with some agronomic traits coffee .Ermias (2005) on 81 West Wollega coffee accessions, Getachew et al. (2013) on 49 from Gomma Wereda, Olika et al. (2011) on 49 Limmu coffee accessions and Lemi et al. (2017) on 64 coffee accessions have reported that characters such as number of primary branch, stem girth, canopy diameter and plant height are known to be related with and significantly influence yield of Arabica coffee. It is obvious that yield is the result of yield-correlated characters and some other undefined factors. Therefore, the use of this method requires a cause and effect relation among the variables (Dewey and Lu, 1959). Moreover, selections to improve yield directly may be difficult and time consuming especially for perennial tree crops with a long juvenile period such as coffee (Yigzaw, 2005). Therefore, adequate knowledge of association between yield and its contributing characters has a great importance in plant breeding that enables plant breeders to breed for high yielding genotypes with desired combinations of characters (Khan and Dar, 2010).
However, in Ethiopia, despite the demands of consumers, greater socio-economic benefits of coffee cultivation and huge influence of other agronomic characters on coffee yield, coffee breeding programs on the improvement of other agronomic traits as well as the study on the nature of associations among characters and the yield was limited. Similarly, there is no detailed information on the extent and nature of interrelationships among characters. Keeping this in view, the present study was conducted to detect correlation and path coefficient analysis of some Tepi and its surrounding (Bench-Maji and Sheka zones) coffee germplasm accessions based on morphological trait and their association with each other.
MATERIALS AND METHODS
Experimental material, design and management:
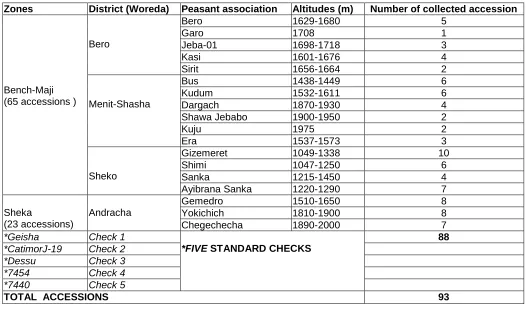
The experiment was conducted on 93 coffee accessions germplasms, including the five standard checks (Table 1) at Tepi National Spices Agricultural Research Center, Southwest Ethiopia. Tepi is located at a latitude of 7° 3' N and longitude of 35° 18' E. and at an altitude of 1200masl.The mean annual rainfall of the area is 1678mm per annum well distributed over eight months with an average maximum and minimum air temperatures of 30°C and 16°C, respectively and Soil PH=6.9-8 with fine textured 30-80% clay soil. The experimental design was augmented design with four blocks. Each accession was planted a single row of 12 trees using spacing of 2m by 2m. All the management practices such as shading, weeding and fertilization were uniformly applied to all plots as per the recommendation (Endale et al.,2008).
Data collection: Data on 22 quantitative traits viz.,leaf length (cm), leaf width (cm), leaf area (cm2),bean length
(mm), bean width (mm), bean thickness (mm), fruit length (mm), fruit width (mm), fruit thickness (mm), hundred bean weight (gm), yield (kg/ha), plant height (cm), stem diameter (cm), number of main stem nodes (no), canopy diameter (cm), average internodes of stem (cm), length of primary branches (cm), number of primary branches, number of secondary branches, height up to first primary branches (cm), number of node on primary branch(no)and coffee leaf rust (%) (IPGRI, 1996) were recorded on plot basis with three trees from each accession by random sampling method.
Data analysis: Recorded data on 22 quantitative
characters were subjected to analysis of variance (ANOVA) using SAS version 9.2 (SAS, 2010) to examine the presence of statistically significant differences among accessions for the characters studied. The phenotypic and genotypic correlation coefficients were estimated using the formula suggested by Johnson et al. (1955) and Singh and Chaudhury (1987).
rg= Gcovxy/√ (Vgx.Vgy)
rp= Pcovxy/√ (Vpx. Vpy)
Where,
rp= Phenotypic correlation coefficient rg = Genetoypic correlation coefficient
Pcovxy = Phenotypic covariance between traits x and y
Gcovxy = Genotypic covariance between traits x and y
Vpx = Phenotypic variance of trait x
Vgx = Genotypic variance of trait x.
Vpy = Phenotypic variance of trait y.
Vgy = Genotypic variance of trait y
Correlation and Path Coefficient Analysis of some Coffee (Coffea arabica L.) Accessions using Quantitative Traits in Ethiopia
Table 1. Description of Coffea arabica L. germplasm accessions studied
Zones District (Woreda) Peasant association Altitudes (m) Number of collected accession
Bench-Maji (65 accessions )
Bero
Bero 1629-1680 5
Garo 1708 1
Jeba-01 1698-1718 3
Kasi 1601-1676 4
Sirit 1656-1664 2
Menit-Shasha
Bus 1438-1449 6
Kudum 1532-1611 6
Dargach 1870-1930 4 Shawa Jebabo 1900-1950 2
Kuju 1975 2
Era 1537-1573 3
Sheko
Gizemeret 1049-1338 10
Shimi 1047-1250 6
Sanka 1215-1450 4
Ayibrana Sanka 1220-1290 7
Sheka
(23 accessions)
Andracha
Gemedro 1510-1650 8 Yokichich 1810-1900 8 Chegechecha 1890-2000 7
*Geisha Check 1
*FIVE STANDARD CHECKS
88
*CatimorJ-19 Check 2
*Dessu Check 3
*7454 Check 4
*7440 Check 5
TOTAL ACCESSIONS 93
Path coefficient analysis was made following the method described by Dewey and Lu (1959).
rij =Pij+ Σrikpkj
Where,
rij = Mutual association between the independent character (i) and dependent Character (j) as measured by the correlation coefficient
Pij = Component of direct effects of the independent character (i) on dependent character(j)as measured by the path coefficient
∑ rikpkj=Summation of components of indirect effect of a given independent character (i) on the given dependent character (j) via all other independent character (k)
Residual effect was estimated by the formula:√𝟏 −R2
Where, R2 =Σpij.rij
pij = Component of direct effects of the independent character (i) and dependent character (j) as measured by the path coefficient
rij = Mutual association between the independent character (i) and dependent character (j) as Measured by the correlation coefficient
RESULTS AND DISCUSSION
Analysis of variance (ANOVA)
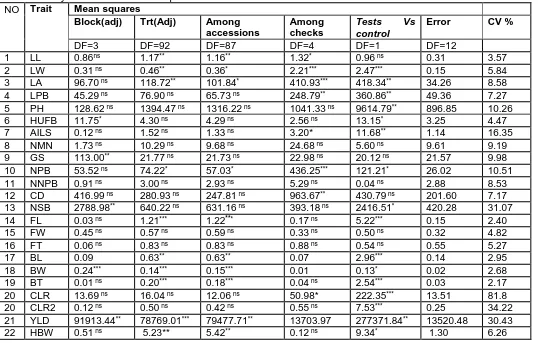
The analysis of variance (ANOVA) revealed that accession differed significantly (P < 0.05) for most of the quantitative traits studied viz leaf length, leaf width, leaf area, number of primary branches, fruit length, bean length, bean width, bean thickness, hundred bean weight and green bean yield. (Table 2). This indicates the presence of variability among the experimental material, which can be exploited through selection and hybridization in order to improve the yield of clean coffee bean.
Phenotypic and Genotypic correlation coefficients
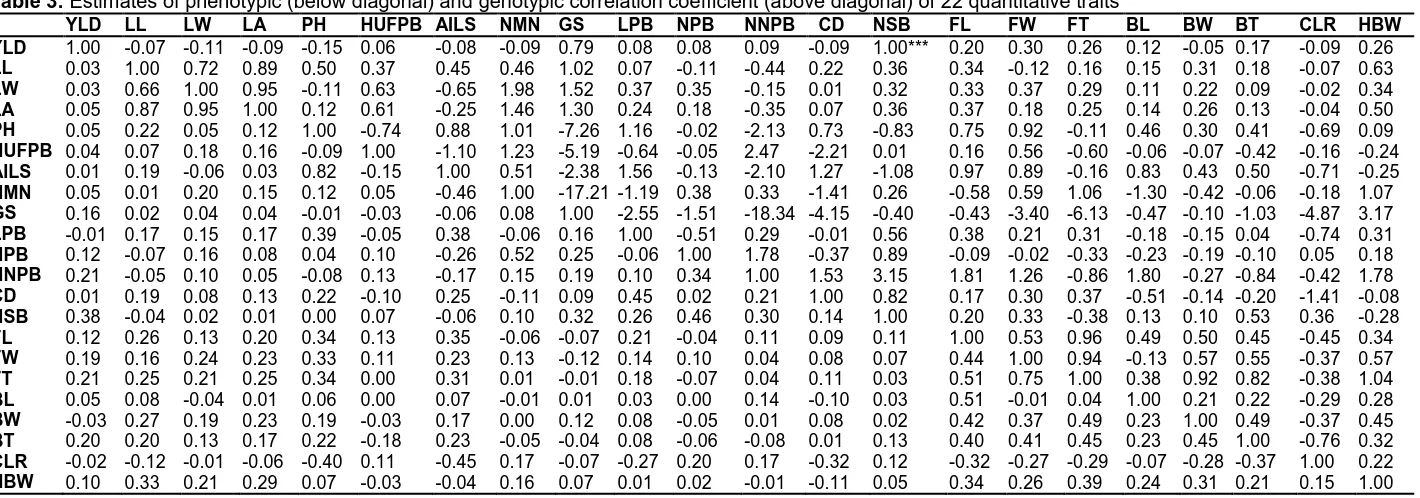
negative correlation only with length of primary branch and bean width and coffee leaf rust. It had positive correlation with the rest of traits (Table 3). Coffee bean yield exhibited the highest positive phenotypic and genotypic correlations with number of secondary branch and girth size. Fruit traits (fruit length, fruit width, fruit thickness) and bean traits (bean length, bean thickness and hundred bean weight) had positive correlation at both genotypic and phenotypic levels. Number of primary branch and number of node on primary secondary branch also had positive correlation with coffee yield at both phenotypic and genotypic levels. Bean width and coffee leaf rust had negative correlation with coffee bean yield both at genotypic and phenotypic levels. Among the characters studied, the correlation was statistically significant only with number of secondary branch, indicating greater importance and reliability of the character for selection for improvement of yield in coffee. So, Selection for a character based on its close association (positive and significant) with other characters is very useful for simultaneous improvement of all the associated characters. Therefore, the more number of primary branches a coffee tree bear and the longer these branches are and the more number of nodes they bear, the more number of fruit bearing secondary branches develop from them and the higher the green bean yield the tree bears. Trees with thicker stems (higher stem girth), bearing longer, wider and thicker branches bearing long, plump (thicker) and heavier beans (high hundred bean weight) are seems to lead to identification of trees with higher green bean yield.
On the other hand, for characters, manifesting negative association, simultaneous improvement of characters could be quite difficult and independent selection may have to be carried out to improve such characters (Sylva and Carvalho,1997). Hence, selection should be against wider beans and against susceptibility to coffee leaf rust. The result is in agreement with Olika et al. (2011) who reported non-significant phenotypic correlations of almost all morphological traits with yield of coffee. Similarly, Getachew et al., (2013) has reported that yield exhibited non-significant phenotypic positive association with height up to first primary branch, average inter node length of main stem, leaf length and width, fruit length and thickness, bean length, width and hundred bean weights. Yigzaw (2005) also reported positive phenotypic correlations among growth characters, yield characters and between yield and growth characters.
Phenotypic Path Coefficient Analysis
Correlations in phenotypic terms were analyzed further by path coefficient analysis technique, which involved partitioning of the correlation coefficient into direct and indirect effects via alternative characters or pathways. It provides an insight into the inter-relationship of various characters with coffee bean yield. Only nine traits (leaf area, plant height, girth size, length of primary branch, number of primary branches, number of node on primary
branches, number of secondary branches, fruit thickness and bean width) explained almost the same amount of variation in green bean yield as the 21 traits (27 vs 30%), that's why they show only these traits (Table 4)
Path coefficient analysis of the phenotypic correlations revealed that number of secondary branches had the highest positive direct effect (0.449). Selection of trees having high number of secondary branches is expected to identify high yielding genotypes. The indirect effect of number of secondary branches showed positive indirect effect through all traits except length of primary branch, number of primary branches and bean width. Selection for trees based on high number of secondary branches may be effective for further breeding programme. The direct effect of length of primary branch (-0.249) and number of primary branches (-0.176) green bean yield was found to be negative. The negative values of the path coefficients resulted from the negative indirect effects of traits such as leaf area, plant height, number of secondary branches, and stem girth via number and length of primary branches. The indirect effect of all other traits through number of secondary branches was positive. Fruit thickness had the second highest positive direct effect (0.280) and positive indirect effect through all other traits except length of primary branch and bean width on green bean yield. Selecting genotypes with thicker fruits one has to take the necessary caution not to select simultaneously genotypes with the longest primary branches and the thickest beans. Length of primary branch (-0.249), number of primary branches (-0.176) and bean width (-0.208) had negative direct effects on green bean yield. The negative direct effect of number of primary branches on bean yield was the consequence of the indirect effect of other traits through it except length of primary branch, fruit thickness and bean width. Leaf area, plant height, girth size and number of node on primary branches also had positive direct on green bean yield, indicates selecting taller genotypes with strong stems (higher girth size) bearing fewer short primary branches with many nodes and hence producing many secondary branches with larger leaves (leaf area), thicker fruits but narrower beans (small bean width) is expected to lead to the identification of genotypes with high green bean yield. Lemi et al. (2017) reported positive direct effect of plant height but negative direct effects of number of primary branch. Ermias (2005) also revealed positive direct effect of plant height but negative direct effects of canopy diameter and length of primary branch on yield.
The estimated residual effect was 0.34 indicating that about that about 66% of the variation was due to the traits considered in the phenotypic path analysis.
Correlation and Path Coefficient Analysis of some Coffee (Coffea arabica L.) Accessions using Quantitative Traits in Ethiopia
Table 2: Analysis of variance of 22 quantitative character
NO Trait Mean squares
Block(adj) Trt(Adj) Among
accessions
Among checks
Tests Vs
control
Error CV %
DF=3 DF=92 DF=87 DF=4 DF=1 DF=12
1 LL 0.86ns 1.17** 1.16** 1.32* 0.96 ns 0.31 3.57
2 LW 0.31 ns 0.46** 0.36* 2.21*** 2.47*** 0.15 5.84
3 LA 96.70 ns 118.72** 101.84* 410.93*** 418.34** 34.26 8.58
4 LPB 45.29 ns 76.90 ns 65.73 ns 248.79** 360.86** 49.36 7.27
5 PH 128.62 ns 1394.47 ns 1316.22 ns 1041.33 ns 9614.79** 896.85 10.26
6 HUFB 11.75* 4.30 ns 4.29 ns 2.56 ns 13.15* 3.25 4.47
7 AILS 0.12 ns 1.52 ns 1.33 ns 3.20* 11.68** 1.14 16.35
8 NMN 1.73 ns 10.29 ns 9.68 ns 24.68 ns 5.60 ns 9.61 9.19
9 GS 113.00** 21.77 ns 21.73 ns 22.98 ns 20.12 ns 21.57 9.98
10 NPB 53.52 ns 74.22* 57.03* 436.25*** 121.21* 26.02 10.51
11 NNPB 0.91 ns 3.00 ns 2.93 ns 5.29 ns 0.04 ns 2.88 8.53
12 CD 416.99 ns 280.93 ns 247.81 ns 963.67** 430.79 ns 201.60 7.17
13 NSB 2788.98** 640.22 ns 631.16 ns 393.18 ns 2416.51* 420.28 31.07
14 FL 0.03 ns 1.21*** 1.22*** 0.17 ns 5.22*** 0.15 2.40
15 FW 0.45 ns 0.57 ns 0.59 ns 0.33 ns 0.50 ns 0.32 4.82
16 FT 0.06 ns 0.83 ns 0.83 ns 0.88 ns 0.54 ns 0.55 5.27
17 BL 0.09 0.63** 0.63** 0.07 2.96*** 0.14 2.95
18 BW 0.24*** 0.14*** 0.15*** 0.01 0.13* 0.02 2.68
19 BT 0.01 ns 0.20*** 0.18*** 0.04 ns 2.54*** 0.03 2.17
20 CLR 13.69 ns 16.04 ns 12.06 ns 50.98* 222.35*** 13.51 81.8
20 CLR2 0.12 ns 0.50 ns 0.42 ns 0.55 ns 7.53*** 0.25 34.22
21 YLD 91913.44** 78769.01*** 79477.71** 13703.97 277371.84** 13520.48 30.43
22 HBW 0.51 ns 5.23** 5.42** 0.12 ns 9.34* 1.30 6.26
Where *=Significant at probability level of 0.05 and **=Significant at probability level of 0.01,and *** = Significant
Table 3: Estimates of phenotypic (below diagonal) and genotypic correlation coefficient (above diagonal) of 22 quantitative traits
YLD LL LW LA PH HUFPB AILS NMN GS LPB NPB NNPB CD NSB FL FW FT BL BW BT CLR HBW
YLD 1.00 -0.07 -0.11 -0.09 -0.15 0.06 -0.08 -0.09 0.79 0.08 0.08 0.09 -0.09 1.00*** 0.20 0.30 0.26 0.12 -0.05 0.17 -0.09 0.26
LL 0.03 1.00 0.72 0.89 0.50 0.37 0.45 0.46 1.02 0.07 -0.11 -0.44 0.22 0.36 0.34 -0.12 0.16 0.15 0.31 0.18 -0.07 0.63
LW 0.03 0.66 1.00 0.95 -0.11 0.63 -0.65 1.98 1.52 0.37 0.35 -0.15 0.01 0.32 0.33 0.37 0.29 0.11 0.22 0.09 -0.02 0.34
LA 0.05 0.87 0.95 1.00 0.12 0.61 -0.25 1.46 1.30 0.24 0.18 -0.35 0.07 0.36 0.37 0.18 0.25 0.14 0.26 0.13 -0.04 0.50
PH 0.05 0.22 0.05 0.12 1.00 -0.74 0.88 1.01 -7.26 1.16 -0.02 -2.13 0.73 -0.83 0.75 0.92 -0.11 0.46 0.30 0.41 -0.69 0.09
HUFPB 0.04 0.07 0.18 0.16 -0.09 1.00 -1.10 1.23 -5.19 -0.64 -0.05 2.47 -2.21 0.01 0.16 0.56 -0.60 -0.06 -0.07 -0.42 -0.16 -0.24
AILS 0.01 0.19 -0.06 0.03 0.82 -0.15 1.00 0.51 -2.38 1.56 -0.13 -2.10 1.27 -1.08 0.97 0.89 -0.16 0.83 0.43 0.50 -0.71 -0.25
NMN 0.05 0.01 0.20 0.15 0.12 0.05 -0.46 1.00 -17.21 -1.19 0.38 0.33 -1.41 0.26 -0.58 0.59 1.06 -1.30 -0.42 -0.06 -0.18 1.07
GS 0.16 0.02 0.04 0.04 -0.01 -0.03 -0.06 0.08 1.00 -2.55 -1.51 -18.34 -4.15 -0.40 -0.43 -3.40 -6.13 -0.47 -0.10 -1.03 -4.87 3.17
LPB -0.01 0.17 0.15 0.17 0.39 -0.05 0.38 -0.06 0.16 1.00 -0.51 0.29 -0.01 0.56 0.38 0.21 0.31 -0.18 -0.15 0.04 -0.74 0.31
NPB 0.12 -0.07 0.16 0.08 0.04 0.10 -0.26 0.52 0.25 -0.06 1.00 1.78 -0.37 0.89 -0.09 -0.02 -0.33 -0.23 -0.19 -0.10 0.05 0.18
NNPB 0.21 -0.05 0.10 0.05 -0.08 0.13 -0.17 0.15 0.19 0.10 0.34 1.00 1.53 3.15 1.81 1.26 -0.86 1.80 -0.27 -0.84 -0.42 1.78
CD 0.01 0.19 0.08 0.13 0.22 -0.10 0.25 -0.11 0.09 0.45 0.02 0.21 1.00 0.82 0.17 0.30 0.37 -0.51 -0.14 -0.20 -1.41 -0.08
NSB 0.38 -0.04 0.02 0.01 0.00 0.07 -0.06 0.10 0.32 0.26 0.46 0.30 0.14 1.00 0.20 0.33 -0.38 0.13 0.10 0.53 0.36 -0.28
FL 0.12 0.26 0.13 0.20 0.34 0.13 0.35 -0.06 -0.07 0.21 -0.04 0.11 0.09 0.11 1.00 0.53 0.96 0.49 0.50 0.45 -0.45 0.34
FW 0.19 0.16 0.24 0.23 0.33 0.11 0.23 0.13 -0.12 0.14 0.10 0.04 0.08 0.07 0.44 1.00 0.94 -0.13 0.57 0.55 -0.37 0.57
FT 0.21 0.25 0.21 0.25 0.34 0.00 0.31 0.01 -0.01 0.18 -0.07 0.04 0.11 0.03 0.51 0.75 1.00 0.38 0.92 0.82 -0.38 1.04
BL 0.05 0.08 -0.04 0.01 0.06 0.00 0.07 -0.01 0.01 0.03 0.00 0.14 -0.10 0.03 0.51 -0.01 0.04 1.00 0.21 0.22 -0.29 0.28
BW -0.03 0.27 0.19 0.23 0.19 -0.03 0.17 0.00 0.12 0.08 -0.05 0.01 0.08 0.02 0.42 0.37 0.49 0.23 1.00 0.49 -0.37 0.45
BT 0.20 0.20 0.13 0.17 0.22 -0.18 0.23 -0.05 -0.04 0.08 -0.06 -0.08 0.01 0.13 0.40 0.41 0.45 0.23 0.45 1.00 -0.76 0.32
CLR -0.02 -0.12 -0.01 -0.06 -0.40 0.11 -0.45 0.17 -0.07 -0.27 0.20 0.17 -0.32 0.12 -0.32 -0.27 -0.29 -0.07 -0.28 -0.37 1.00 0.22
HBW 0.10 0.33 0.21 0.29 0.07 -0.03 -0.04 0.16 0.07 0.01 0.02 -0.01 -0.11 0.05 0.34 0.26 0.39 0.24 0.31 0.21 0.15 1.00
Where YLD=green bean yiel; LL=leaf length, LW=leaf width, LA=leaf area, FL=fruit length, BL=bean length, HBW=hundred bean weight, PH=plant height, NPB=number of primary branches, LPB=length of primary branches, NSB=number of secondary branches, CD=canopy diameter, FW=fruit width FT=fruit thickness; BW=bean width; BT=bean thickness; CLR= Coffee leaf rust; GS=Girth of stem; HUFB=height upto first primary branch ; AILS= average inter node length of primary branches; NMN= number of main stem node ; NNPB= number of node on primary branches .
*** = Significant at probability level of 0.001.
Table 4: Direct effect (bold and underline) and indirect effects of Path coefficient analysis of phenotypic correlations of nine explanatory traits
LA PH GS LPB NPB NNPB NSB FT BW CORR
LA 0.056 0.013 0.004 -0.042 -0.015 0.007 0.002 0.069 -0.048 0.048
PH 0.007 0.105 -0.001 -0.097 -0.008 -0.011 0.001 0.094 -0.040 0.050
GS 0.002 -0.001 0.099 -0.040 -0.043 0.026 0.144 -0.001 -0.025 0.161
LPB 0.009 0.041 0.016 -0.249 0.011 0.014 0.116 0.049 -0.015 -0.007
NPB 0.005 0.005 0.024 0.016 -0.176 0.046 0.206 -0.019 0.011 0.118
NNPB 0.003 -0.008 0.019 -0.026 -0.060 0.137 0.133 0.012 -0.002 0.207
NSB 0.000 0.000 0.032 -0.064 -0.081 0.041 0.449 0.007 -0.003 0.380
FT 0.014 0.035 0.000 -0.043 0.012 0.006 0.011 0.280 -0.102 0.212
Correlation and Path Coefficient Analysis of some Coffee (Coffea arabica L.) Accessions using Quantitative Traits in Ethiopia
CONCLUSION
Phenotypic level of correlation was less pronounced as compared to that of genotypic level in terms of significance, demonstrating less influence of environment on the expressions of these traits. Coffee bean yields exhibited the highest positive phenotypic and genotypic correlations with number of secondary branch and girth size. Fruit traits (fruit length, fruit width, fruit thickness) and bean traits (bean length, bean thickness and hundred bean weight) had positive correlation at both genotypic and phenotypic levels. Number of primary branch and number of node on primary secondary branch also had positive correlation with coffee yield at both phenotypic and genotypic levels. Only number of secondary branch was statistically significant with bean yield at genotypic level, indicating greater importance and reliability of the character for selection for improvement of yield in coffee. Bean width and coffee leaf rust had negative correlation with green bean yield both at genotypic and phenotypic levels. Hence, selection should be against wider beans and against susceptibility to coffee leaf rust. Path coefficient analysis of the phenotypic correlations revealed that number of secondary branches and fruit thickness had the highest positive direct effect, while length of primary branch and bean width had the highest negative direct effects, suggesting that these traits can be used for indirect selection of high yielding accessions. The study showed that coffee breeders to given high priority for coffee improvement emphasizing to a few number of component characters. Hence, selection for these traits can improve coffee bean yield and this could be helpful in minimizing the time required to search for more component characters and improve the efficiency of the future breeding program.
ACKNOWLEDGMENT
We would like to acknowledge Ethiopian Institute of Agricultural Research, Jimma Agricultural Research Center for the source of budget for the study and Tepi National Spices Agricultural Research Center for land.
REFERENCES
Akinwale, M.G., G. Gregorio, F. Nwilene, B.O. Akinyele, S.A. Ogunbayo, and A.C. Odiyi, 2011. Heritability and correlation coefficient analysis for yield and its components in rice (Oryza sativa L.). African Journal of plant science, 5(3): 207-2 12.
Anthony, F., M. Combes, C. Astorga, B. Bertrand, G. Graziosi, and P. Lashermes, 2002. The origin of cultivated Cofea arabica L. varieties revealed by AFLP and SSR markers. TAG Theoretical and Applied Genetics, 104(5): 894-900.
Bayetta Belachew, 1997. Arabica coffee breeding in Ethiopia: A review.ASIC 1997, Nairobi, Kenya, 17:406-414
Berthaud, J. and Charrier, A., 1988.Genetic resources of Coffea.Pp. 1-42. In: Clarke R J, Macrae R (eds), Coffee: Agronomy, vol. IV, Elsevier Applied Science, London.
Central Statistic Agency. Agricultural sample survey, 2017. Addis Ababa Ethiopia.
Davis AP, Gole TW, Baena S, Moat J. (2012). The impact of climate change on natural populations of Arabica coffee: Predicting future trends and identifyingpriorities. PLoSONE, 7(11): e47981.
Dewey, D.R. and K. Lu, 1959. A correlation and path-coefficient analysis of components of crested wheatgrass seed production. Agronomy Journal, 51(9): 515-518.
Endale Taye, Taye Kufa, Antenhe Nestre, Tesfaye Shimber, Alemseged Yilma and Tesfaye Ayano, 2008. Research on coffee field management.pp.187-195. In: Girma Adugna, Bayetta Belachew, Tesfaye Shimber, Endale Taye and Taye Kufa (eds.).Coffee Diversity and Knowledge. Proceedings of a National Workshop Four Decades of Coffee Research and Development in Ethiopia, 14-17 August 2007, Addis Ababa, Ethiopia. Gessese, M.K., Bellachew, B. and Jarso, M., 2015.
Multivariate Analysis of Phenotypic Diversity in the South Ethioiapn Coffee (Cofea arabica L.) for Quantitative Traits. Advances in Crop Science and Technology, pp.1-4.
Getachew WeldeMichael, Sentayehu AlamerewTaye Kufa and Tadesse Benti, 2013.Genetic Diversity Analysis of Some Ethiopian Specialty Coffee(Coffea arabica L.) Germplasm Accessions Based on Morphological Traits.
Ermias, H., 2005. Evaluation of Wellegacoffee germplasm for yield, yield component and resistant to coffee berry disease at early bearing stage. An MSc thesis submitted to school of graduate studies of Alemaya University. Pp. 69 Ethiopia.
ICO (International Coffee Organization) 2016. http//www.ico/org/trade_statistic.asp.
IPGRI (International Plant Genetic Resource Institute).1996. Diversity for development. Rome, International Plant Genetic Resources Institute. Johnson, H.W., H.F. Robinson, R.F and Comstock, 1955.
Estimates of genetic and environmental variability in Soya bean agronomy, J. 47: 314-318.
Khan MH, Dar AN (2010). Correlation and path coefficient analysis of some quantitative characters in wheat. African Crop Science Journal, 18(1).
Labouisse, J.P., Bellachew, B., S. Kotecha, and B. Bertrand, 2008. Current status of coffee (Cofea arabica
L.) genetic resources in Ethiopia: implications for conservation. Genetic Resources and Crop Evolution,
55(7):1079.
Olika Kitila,Sentayehu Alamerew, Taye Kufa and Weyessa Garedew. 2011. Variability of quantitative Traits in Limmu Coffee (Coffeaarabica L.) in Ethiopia.
International Journal of Agricultural Research, 6: 482-493.
SAS, 2010. SAS User's Guide: Statistics. 5th Edn., SAS Institute, Cary, NC.
Sadeghi,S.M.,2011.Heritability, phenotypic correlation and path coefficient studies for some agronomic characters in landrace rice varieties.World Appied Science Journal.13:1229-1233
Singh, R.K. and B.D. Chaundry, 1987. Biometrical Methods in Quantitative Genetics Analysis. KalyaniPublishers , New Delhi.
Simmonds, N.W., 1986. Principles of Crop Improvement. LongMan, Singapore.495p.
Sylvain, P.G., 1958. Ethiopian coffee and its significance to world coffee problems. Economic botany, 12(2): 111-139.
Walyaro, D.J.and H.A.M Van der Vossen, 1979. Early determination of yield potential in Arabica coffee by applying index selection. Euphytica, 28: 465-472. Yadav, P., N. R. Rangare, P. J. Anurag and A. K.
Chaurasia, 2010. Quantitative analysis of rice (Oryza Sativa L.) in Allahabad agroclimatic zone. Journal of Rice Research, 3:16-18
Yigzaw, D., 2005. Assessment of cup quality, morphological, biochemical and molecular diversity of
CoffeaarabicaL. genotypes of Ethiopia. Ph.D. Thesis, University of Free State, South Africa.
Accepted 2 May, 2018
Citation: Abdulfeta TK, Husein MA, Ashenafi A (2018). Correlation and Path Coefficient Analysis of some Coffee (Coffea arabica L.) Accessions using Quantitative Traits in Ethiopia. International Journal of Plant Breeding and Crop Science 5(2): 383-390.