ISSN 0975-928X
Research Note
Impact of drought and detection of potential donors for reproductive stage
tolerance in rice
Shafina Haque, A.Anandan*, S.K.Pradhan, and O.N.Singh
Crop Improvement Division, Central rice Research Institute, Cuttack Email: anandanau@yahoo.com
(Received: 18 Aug 2014; Accepted: 04 Apr 2015)
Abstract
In present study, 48 drought tolerant lines along with two susceptible genotypes of upland and lowland rice ecologies were tested at Central Rice Research Institute during dry season of 2011 and 2012, to identify the reproductive stage drought tolerant lines and to exploit the genetic variations. In support of various estimates of morpho-physiological parameters, genotypes Nan Te Hao, Purbachi (Chinese 1), Saita, NSIC Rc 222, Binnatoha, CO18, Ai Jiao Nan Te, Brown Gora, Black Gora (NCS 12), Jhona 349, Kalakeri are adjudged as good donors for reproductive stage drought tolerance in rice.
Keywords
Rice, reproductive stage drought tolerance, harvest index, yield.
Rice is a primary food source for more than two third of the world’s population, that account for nearly 21% of global calorie intake (Maclean et al., 2002). Nearly 75% of the global rice production comes from irrigated ecosystem that covers around 55% of the total rice cropped area. Rainfed upland and lowland contributes only 21% of the total production from 34 % of the cropped area. Frequent occurrence of drought and submergence are considered as the key factor for low productivity of rice in rainfed environments. Drought stress during cropping season directly affects the grain yield; particularly the stress at reproductive stage is most devastating (Venuprasad et al., 2009; Lanceras et al., 2004). Drought stress during anthesis stage accompanied by high temperature reduces the duration and rate of grain filling, thereby reduce mean kernel weight. Grain yield is the result of many developmental and physiological events that occur during the life cycle of the plant, as determined by three main components; the number of panicles/plant, number of grain/panicle and weight of grains (Poehlman, 1987). Hence, identification of suitable gemplasm lines possessing reproductive stage drought tolerance traits and their utilization in breeding programme is a pre-requisite for success of drought tolerance breeding in rice.
Plant material and field layout:The experimental materials consisted of 48 drought tolerant lines including two susceptible genotypes of upland and lowland rice ecologies (Table 3) collected from gene bank of Central Rice Research Institute (CRRI), Cuttack, India and International Rice Research Institute (IRRI), Manila, Philippines. The field
ISSN 0975-928X
between two genotypes and correlation between the variables (Anandan et al., 2011; Anandan et al., 2012). These analysis were performed using the Windowstat 7.5 software (Indostat Services, Hyderabad, India).
Analysis of variance for traits indicated significant differences among the genotypes studied for per se
yield, ear bearing tiller, Total Dry Matter at harvest, spikelet sterility, days to 50% flowering and harvest index and found to be influenced under reproductive stage drought stress (Table 1). Therefore, these traits are useful for selection of genotypes for reproductive stage drought tolerance. Other traits like test weight, kernel length and kernel breadth were observed to be least variable under reproductive stage drought stress. The genotypes showed considerable differences in grain yield and varied from 0.14 t ha-1 (UPLRI 7) to 1.959 t ha-1 (Nan Te Hao). The other genotypes exhibiting high per se yield were Pyari (1.942 t ha-1), Vandana (1.640 t ha-1), Tam Cau 9A (1.663 t ha-1), N22 (1.65 t ha-1), Black Gora (NCS 12) (1.31 t ha-1), Muey Nong (1.308 t ha-1) and Jhona 349 (1.314 t ha
-1) under reproductive stage drought stress. A wide
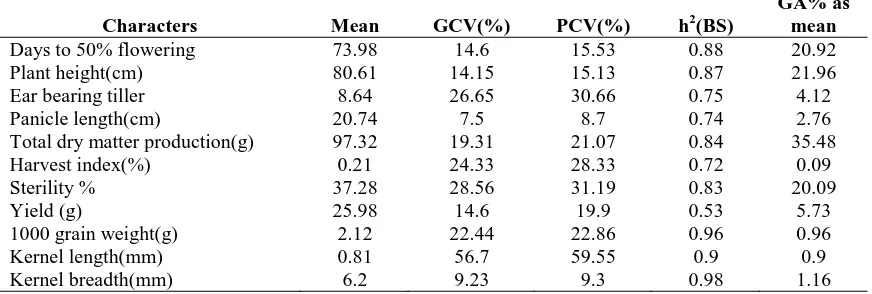
range of genotypic coefficient of variation was observed for spikelet sterility, besides exhibited high inheritance (75%). Hence, spikelet sterility can be taken as selection criteria for identification of genotypes at reproductive stage. Besides, high GCV was also observed for TDM at harvest, harvest index and ear bearing tiller. These traits are also exhibiting high heritability during reproductive stage of the crop. Hence, these traits along with spikelet sterility are to be used for identification of donors at reproductive stage drought stress tolerance. It is reported that yield QTLs are also inherited under drought stress and play role for per se yield of the trait. Here, per se yield showed high GCV coupled with high heritability under drought stress. Thus, combination of traits like spikelet sterility, TDM at harvest, harvest index and ear bearing tillers with per se yield will be useful to differentiate the tolerant donors from susceptible genotypes.
Estimates of various morpho-physiological parameters of genotypes under reproductive stage drought stress of 50 rice genotypes are presented in Table 2. Genotypes studied in the present experiment, showed a wide variation in yield components such as ear bearing tiller hill-1 (EBT) and harvest index (HI). A high number of productive tillers have been considered a crucial diagnosis index along with a high spikelet m-2 resulting in a higher yield of crops. Results revealed that high EBT was
(13.1), Muey Nong (12.85) and Vandana (12.1) under stress with low sterility (Table 3). Saita and Koshihikari were also good performer in case of total dry matter production 117.47 and 117.46 respectively. In contrast, the HI of all high yielding genotypes recorded more than 0.21 under stress condition. T 136 showed high panicle number (24.3) followed by T1 (23.4) and Taichung Native1 (23.3). Other germplasm lines like BR1, Kalakeri, IRRI 119 and T1 exhibited high grain yield along with low spikelet sterility, high panicle number and high harvest index may be good donors under reproductive stage drought stress.
Biplot diagram derived from first and second factor components for 50 genotypes is shown in Fig. 1. Genotypes with higher PC1 and PC2 scores had the high yields. The second quarter of biplot, which has the positive values of PC1 and PC2, are the suitable regions to identify the high-performance genotypes. Golabadi et al. (2006) obtained the similar results in drought tolerance of segregating populations of durum wheat. The development of reproductive organs, which is under the control of photoassimilate production and partitioning by the source tissues, is the most critical (Taiz and Zeiger, 2002; Wahid and Rasul, 2004). Therefore, increased drought at reproductive stage has pronounced effect on grain development and yield.
Cultivar-by-trait biplot analysis (Fig. 1) of 50 genotypes with spikelet sterility, TDM at harvest, harvest index, ear bearing tiller and per se yield, indicated that the pair wise trait of drought donor genotypes exhibited an acute angle for most of these traits. The figure indicated that these traits are correlated and may be considered as selection criteria for reproductive stage drought stress tolerance donors. From the figure, the genotypes can be divided into four groups. Based on spikelet sterility, TDM at harvest, harvest index, ear bearing tiller and
ISSN 0975-928X
IV may be rejected as they form separate group when compared with pair wise trait. Based on the estimates of various morpho-physiological parameters and biplot analysis, genotypes like Nan Te Hao, Purbachi (Chinese 1), Saita, NSIC Rc 222, Binnatoha, CO18, Ai Jiao Nan Te, Brown Gora, Black Gora (NCS 12), Jhona 349, Kalakeri are considered as potential donors for reproductive stage drought tolerance in rice.
References
Allard, R.W. 1960. Principles of plant breeding. New York, John Wiley and Sons, p. 89-98.
Anandan, A., Eswaran, R. and Prakash, M. 2011. Diversity in rice genotypes under salt affected soil based on multivariate analysis. Pertanika J. Tropical Agri. Sci., 34(1): 33–40.
Anandan, A., Rajiv, G., Ramarao, A. and Prakash, M. 2012. Internode elongation pattern and differential response of rice genotypes to varying levels of flood water. Funct. Plant Biol., 39: 137– 145.
Golabadi, M., Arzani, A. and Maibody, S.A.M. 2006. Assessment of drought tolerance in segregating populations in durum wheat. Afr. J. Agric. Res., 5: 162-171.
Lanceras, J.C., Pantuwan, G., Jongdee, B. and Toojinda, T. 2004. Quantitative trait loci associated with drought tolerance at reproductive stage in rice. Plant Physiol. 135: 84–399.
Maclean, J.L., Dawe, D.C., Hardy, B. and Hettel, G.P. 2002. Rice almanac. 3rd edn.Wallingford, Oxon, CABI Publishing.
Panse, V.G. and Sukhatme, P.V. 1985. Statistical Methods for Agricultural Workers, Indian Council of Agricultural Research, New Delhi.
Poehlman, J. M. 1987. Breeding Field Crops, Van Nostrand Reinhold, New York, USA.
Singh, R.K. and Chaudhary, B.D. 1977. Biometrical Methods in Quantitative Genetic Analysis. Kalyani Pub., Ludhiana.
Taiz, L. and Zeiger, E. 2002. Plant Physiology, Third Edition, Sinauer Associates, Sunderland, MA. Pp. 690.
Venuprasad, R., Bool, M.E., Dalid, C.O., Bernier, J., Kumar, A. and Atlin, G.N. 2009. Genetic loci responding to two cycles of divergent selection for grain yield under drought stress in a rice breeding population. Euphytica, 167: 261–269. Wahid, A. and Rasul, E. 2004. Photosynthesis in leaf, stem,
flower and fruit. In: Handbook of Photosynthesis, M. Pessarakli (Ed), second edition, CRC Press Florida, Pp. 479-497.
Table 1. Analysis of variance for various morpho-physiological traits of 50 rice genotypes under reproductive stage drought stress
Characters Sources of variation
Rep Genotype Error
Days to 50% flowering 30.00 263.99* 30.54
Plant height 34.75 297.36* 37.27
Ear bearing tiller 20.00 14.06* 3.44
Panicle length 9.85 6.51* 1.66
Total dry matter production 390.19 840.83* 134.53
Harvest index 0.00067 0.0077 0.0021
Sterility % 376.87 270.55* 43.67
Yield 30.48 53.44* 24.66
1000 grain weight 0.0013 0.47 0.017
Kernel length 0.021 0.46 0.043
ISSN 0975-928X
Table 2. Estimation of genetic parameters for various morpho-physiological traits during reproductive stage drought tolerance of 50 rice genotypes
Characters Mean GCV(%) PCV(%) h2(BS)
GA% as mean
Days to 50% flowering 73.98 14.6 15.53 0.88 20.92
Plant height(cm) 80.61 14.15 15.13 0.87 21.96
Ear bearing tiller 8.64 26.65 30.66 0.75 4.12
Panicle length(cm) 20.74 7.5 8.7 0.74 2.76
Total dry matter production(g) 97.32 19.31 21.07 0.84 35.48
Harvest index(%) 0.21 24.33 28.33 0.72 0.09
Sterility % 37.28 28.56 31.19 0.83 20.09
Yield (g) 25.98 14.6 19.9 0.53 5.73
1000 grain weight(g) 2.12 22.44 22.86 0.96 0.96
Kernel length(mm) 0.81 56.7 59.55 0.9 0.9
ISSN 0975-928X
Table 3. Mean performance of 50 rice genotypes of various traits under reproductive stage drought stress. Sl
No. Genotype
Ear Bearing
Tiller
Total Dry Matter
Harvest Index(%)
Sterility %
Yield (t/ha)
1 ZHENSHAN 2 12.15 86.98 0.21 40.05 0.76
2 GS 529;DULAR 8.90 86.74 0.26 30.25 0.48
3 BINNATOHA 7.00 111.32 0.21 30.00 1.07
4 PURBACHI (CHINESE 1) 13.00 126.60 0.15 24.25 0.95
5 SAITA 7.15 117.47 0.18 23.95 0.97
6 NSIC Rc 222 11.60 110.26 0.16 27.15 1.00
7 SAMBA MAHSURI 5.40 79.60 0.18 78.50 0.16
8 KASALATH 9.30 98.98 0.21 43.05 1.09
9 BR 21 10.65 102.55 0.31 25.65 0.75
10 T 1 7.40 128.90 0.31 31.60 1.23
11 CO18 7.35 121.25 0.23 41.50 0.67
12 IR 64 12.45 128.90 0.13 74.60 0.13
13 BASMATI 370 6.50 61.50 0.28 75.90 0.16
14 MAGAWK DONG 269-7-7 (9) 6.25 106.72 0.11 39.20 0.44
15 JHONA 349 14.25 120.84 0.22 29.00 1.31
16 TAICHUNG NATIVE 1 6.75 65.80 0.21 38.05 0.12
17 PSBRC 80 12.70 83.16 0.25 37.30 0.63
18 MTU1010 5.50 79.95 0.16 69.42 0.20
19 BR 2 13.00 99.72 0.25 32.75 0.55
20 KOSHIHIKARI 10.45 117.47 0.33 26.55 1.03
21 UPLRI 7 8.00 82.19 0.24 78.95 0.14
22 ASSE Y PUNG 11.05 109.99 0.31 30.25 0.67
23 DUBRAJ 5.00 59.05 0.17 72.15 0.19
24 NAN TE HAO 13.45 116.28 0.21 19.40 1.96
25 IRRI 119 7.65 99.35 0.30 25.70 1.01
26 KALAKERI 14.20 107.20 0.13 26.95 1.25
27 AI JIAO NAN TE 9.70 90.59 0.21 28.50 1.09
28 NIAW 8.70 91.86 0.23 43.20 0.89
29 Dhagad deshi 12.75 79.71 0.28 36.60 0.76
30 JC 148 6.75 97.51 0.35 45.00 0.38
31 MUEY NONG (WANG DIN) 12.85 135.76 0.29 28.25 1.31
32 DHOLI BORO 6.10 106.32 0.24 39.15 0.73
33 BR 1 7.90 109.98 0.28 29.75 1.09
34 RATNA 6.85 46.95 0.23 77.40 0.19
35 BROWN GORA 9.60 96.43 0.22 43.25 1.25
36 CHAU 9.10 117.91 0.17 38.90 0.34
37 NSIC Rc 192 9.50 111.00 0.32 39.70 0.30
38 CO 25 7.20 104.83 0.21 45.70 0.63
39 JAYA 6.05 52.50 0.19 62.95 0.37
40 IRRI 123 9.30 96.28 0.31 42.20 0.67
41 Vandana 12.10 136.94 0.31 26.10 1.64
42 TAM CAU 9 A 9.20 94.40 0.31 25.90 1.66
43 N 22 8.05 112.39 0.23 26.30 1.65
44 BLACK GORA (NCS 12) 8.25 103.19 0.22 26.10 1.31
45 IR 36 6.05 11.50 0.25 68.90 0.11
46 RD 25 7.55 101.78 0.17 43.05 0.97
47 IR74371-70-1-1 6.60 103.83 0.17 51.10 0.82
48 IR74371-46-1-1 10.65 73.27 0.27 24.05 1.32
49 Pyari 13.10 96.00 0.29 23.40 1.94