Andreas Keler
a,*, Georgios Grigoropoulos
a, Heather Kaths
a, Klaus Krämer
b, Jakob Kaths
c,
Matthias Spangler
a, Fritz Busch
aa Chair of Traffic Engineering and Control, Technical University of Munich, Munich, Germany; andreas.keler@tum.de, george.grigoropoulos@tum.de, heather.kaths@tum.de, matthias.spangler@tum.de, fritz.busch@tum.de
b City of Munich, Munich, Germany; klaus.kraemer@muenchen.de
c TESIS Gesellschaft für technische Simulation und Software mbH, Munich, Germany; jakob.kaths@tesis.de
*Corresponding author
Abstract: Urban environments are more or less characterized by active travel modes, including the bicycle usage. Present transport infrastructure for bicyclists can often not serve the high traffic volumes, especially in rush hours. Therefore, introducing novel and specific traffic control strategies for bicyclists might serve as supportive element for improving bicycle traffic efficiency and safety. We evaluate a traffic control strategy implying countdown timer displays for bicyclists with one device being permanently installed in Munich (Germany) by (1) extracting cyclist trajectories from video observations before and after the installations, and, (2) introducing a bicycle simulator scenario via a map design approach. The latter includes a sequence of fictional and real road intersections and goes beyond evaluating the present countdown timers in VR, since different other countdown timer display designs are being tested. The whole bicycle simulator study consists of test rides and subsequent questionnaires with test subjects. We explain the design of the first simulator study and show selected results, which imply significant new insights resulting from the first 30 test rides and questionnaires.
Keywords: Traffic maps, Microscopic traffic flow, Traffic simulation, Signal traffic control, Signal perception, User experience, Simulator studies, Bicycle simulator
1. Introduction
Bicycle usage, especially in central Europe, is gaining an ever-growing popularity in urban environments. German Federal Minister of Transport and Digital Infrastructure Andreas Scheuer mentions bicycle transport as the travel mode of the future, especially in complex urban environments1. Nevertheless, growing bicycle flows, especially during rush hours, cause traffic congestion at bike lanes that influences the quality of traffic and the level of safety for bicyclists, pedestrians and vehicle drivers.
1.1 Implementing and testing countdown timer displays for bicyclists
One approach for improving traffic safety and quality of urban cycling might be the installation of countdown timer displays for bicyclists: visualizing the remaining seconds until the next red or green phase of the traffic light supports bicyclists to adapt a more efficient and prescient riding style. This is evaluated via trajectory analyses of bicyclists: (1) in the real world with extracted video trajectories at respective intersections, and, (2) in a VR bicycle simulator environment (Keler et al. 2018) with modelled intersections and via trajectories of the test subjects.
1 www.bmvi.de/SharedDocs/DE/Dossier/Radverkehr/radverkehr
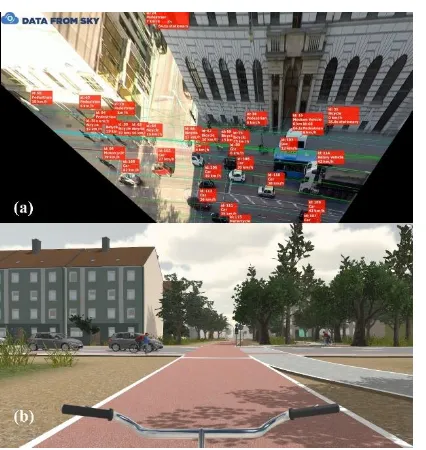
Figure 1. Sources of bicycle trajectory extraction with (a) video observations from static cameras, and, (b) test rides in a VR environment.
Figure 1a shows just one possible video trajectory extraction methodology, this time delivered by the company DataFromSky2 serving numerous users with
spatiotemporally highly accurate trajectories from various differentiated (through classification) road users. This results in not only extracting moving bicyclists, but also in extracting pedestrians and users of motorized vehicles. These observations might be used for calibrating our modelled simulation networks for including realistic traffic into the VR visualization environment experienced by every test subject, as pictured in Figure 1b.
1.2 Evaluation of effects on bicycle traffic with bicycle trajectories
Within the project RadOnTime, we investigate 3 intersections in Munich, where these countdown timer displays have been installed. Figure 2a pictures the permanently installed bicycle countdown timer display at “Milbershofener Straße” in Munich.
Figure 2. Installed countdown timer displays in Munich at (a) the crossing “Milbertshofener Straße / Christoph-von-Gluck-Platz” (permanently installed), and, (b) the intersection “Ludwigstraße / Theresienstraße” (installed for one day).
The test intersection in Figure 2a was installed in June 2018 by the City of Munich and is since then permanently running. Numerous insights could be already extracted due to this permanent installation. Figure 3 pictures the extraction of moving cyclists and pedestrians. Whereas the intersection “Ludwigstraße / Theresienstraße” has a shared
traffic light for vehicles and bicycles, and, the respective countdown timer was only installed for one day.
Figure 3. Trajectory extraction after countdown timer installing.
2.
Designing bicycle simulator scenarios
Bicycle simulator applications emerge exponentially in different transport science domains since the early 2000s (Kwon et al. 2001, He et al. 2005, Schramka et al. 2018). There are different research questions that are being solved using this tool, often focussing on perceiving the modelled virtual environment. Nevertheless, most approaches are interdisciplinary and especially traffic engineering is of benefit in accessing topics from different domains such as human factors in traffic (Twaddle 2018) or the modelling of transport infrastructure with very high spatial resolution (Grigoropoulos et al. 2019).
The aim often consists of not only designing comparable conditions for every test person, but also to experience microscopic traffic flow simulations (Keler et al. 2018). Since the latter implies difficulties in establishing a base for trajectory and road network segmentations, we introduce spatial triggers that work independently of differing starting times, riding styles, and, movement speeds. Test subjects that pass specified polygons in the virtual environment positioned at the bike lanes indicate one of the 3 signal options pictured in Figure 4.
Figure 4. Visualizations designs used within the bicycle simulator studies with (a) generic German traffic light, (b) countdown timer display with LED numbers (“seconds timer”), and, (c) countdown timer display with circle-wise arrangement of LED dots (“circle timer”); modelled by TESIS GmbH.
from OSM and the subsequent connections of real intersections with fictional intersections (Figure 5c), we create a road network that is usable for microscopic traffic flow simulations (Lopez et al. 2018).
Figure 5. Map and visualization specifications of the first experiment within the Project RadOnTime with (a) familiarization route, (b) whole route with 33 road intersections, (c) fictional road intersections, and, (d) modelled real road intersections.
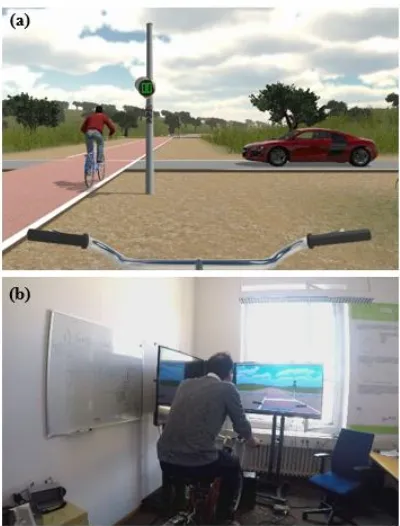
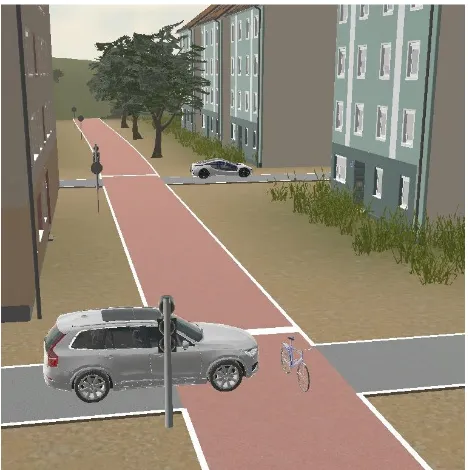
The modelled real test intersections appear respectively twice in the road network in Figure 5b. This means every real intersection is modelled as in the real world and as a variation in the traffic signal control. This allows for more detailed evaluation of the intersection, which results from completed bicycle simulator test rides as pictured in Figure 6b. Figure 6a shows a typical situation at a fictional intersection. The key aspect here is the inclusion and exclusion of other traffic participants while inspecting the perception of countdown timers. Movements of other traffic participants are simulated onto the created road network. Besides vehicles and pedestrians, there are options of simulating bicyclists within a microscopic traffic flow simulation (Twaddle and Grigoropoulos 2016, Twaddle et al. 2016). These simulated traffic participants are then visualized in 3D as pictured in Figure 6a. Travel behavior of test subjects might change within this variation (presence and absence of traffic participants), as for example in the acceptance limit of red light violations. Another variation is the specific design of every traffic light and countdown timer display as in Figure 7, which might influence the perception and subsequently the travel behavior of every test subject at specific intersections of the route.
One critical aspect in providing comparability of real bicycle movements and bicycle simulator movements is assigning accurate georeferences between the real intersections and its modelled counterparts in the simulator environment. This might serve as the base for evaluating future traffic control strategies before its installation, especially when adjusting parameter settings for different
phases, displays and adaptations of countdown timer displays and traffic light signals.
Figure 6. First bicycle simulator studies conducted in September 2018 with (a) resulting bicyle simulator visualization via DYNAanimation showing a situation at a fictional intersection, and, (b) test subject using the bicycle simulator.
Figure 7. Most common variants of the traffic light signals and countdown timer displays for bicyclists in the first RadOnTime simulator study with (a) circle-wise remaining red display (“circle timer”), (b) remaining green display (“seconds timer”), (c) remaining red display (“seconds timer”), and, (d) remaining red upstream display.
3.
Preliminary results of the conducted bicycle
simulator studies
After conducting the first simulator study, we were able to extract 30 complete trajectories of the test rides together with respective answered questionnaires. Various aspects are being inspected, mainly related to how traffic efficiency and safety might be improved with implemented countdown timers for bicyclists. A huge focus of the first conducted bicycle simulator study was measuring red light violations (RLVs). This is resulting in often extreme situations in the simulator scenario, such as waiting for the green phase for 99 seconds. This, and many other aspects, were evaluated by test subjects as annoying, since waiting at remaining red for the next green phase was often already expected. Due to the evaluation results, not only the scenario itself could be improved, but as well the handling and hardware implementation of the bicycle simulator.
Due to the focus on RLVs of the first simulator study, we could extract several first insights on the perception of varying remaining red phase countdown seconds (Beiersdorf 2018).
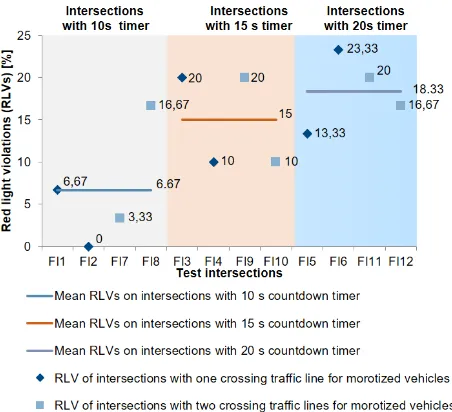
Figure 8. Influence of indicated remaining red phase time on red light violations (Beiersdorf 2018).
Figure 8 pictures the influence of indicated remaining red phase time on RLVs for the 11 fictional intersections with remaining red countdown timers. All countdown timer displays are classified by the respectively implemented number of to be counted seconds. In general, it is visible that a low number of RLVs is related to a low number of displayed remaining seconds. Higher remaining red phase times result in higher numbers of RLVs. Surprisingly, RLVs are not always connected with the information from the questionnaire, which means that general, qualitatively conducted, information on the cycling behavior has often few connections to the simulator experiment. On the other hand, we can argue that perception and actual behavior can vary greatly.
Another result from the trajectory analyses of simulator test rides is pictured in Figure 9, where different
countdown timer design types are being related to RLVs. There is the classification into test intersections with “seconds timer”, “circle timer” and without timer. The latter is referring to traffic lights without countdown timer displays. The intersections with “seconds timer” (with visualized LED seconds) have the highest percentage of RLVs. The intersections with “circle timer” (circle-wise ordered LED dots) have the lowest percentage of RLVs, which might result from the unusual design for most of the test subjects. Initially, it is also difficult to get the temporal information from “circle timer” designs, since it requires an observation of animated LED dots. Resulting from this, every LED dot of every specific “circle timer” display might be associated with different temporal units.
Figure 9. Comparison of test intersections with “seconds timer”, “circle timer” and without timer (Beiersdorf 2018).
4.
Outlook
The findings of this first bicycle simulator study for evaluating different countdown timer displays helped improving the immersion and hardware efficiency of the whole system. Figure 10 shows the recent component of the bicycle simulator.
Numerous questions of the questionnaire in the first study focused on realism in performing specific maneuvers, such as accurate stopping at or before the stop lines. Due to the missing of experiencing balancing, a smart trainer with the possibility of lateral inclination was introduced. This benefits the accuracy of performing realistic maneuvers and allows realistic interacting with other traffic participants in the VR environment. This can benefit the investigation of safety-related aspects as measuring the distances and time to possible collisions between vehicles and bicycle simulator test subjects. Figure 11 pictures an ongoing test, where the fields of view of simulated vehicles are being modelled. This enables including situations with highly varying perceived safety aspects, which will be further inspected in future bicycle simulator studies.
Figure 11. Testing the interactions between bicyclists and vehicle drivers by varying the sight distances of the vehicle drivers in the simulated VR environment.
5.
Acknowledgements
The presented research was conducted within the ongoing research project RadOnTime (“RadOnTime: Wirkungen von Restzeitanzeigen auf den Radverkehr”) on the effects of countdown timers on bicycle traffic funded by the BMVI (Federal Ministry of Transport and Digital Infrastructure).
6.
References
Beiersdorf, S. (2018) Application and Evaluation of Countdown Timers for Bicycle Traffic in a Simulator Environment. Master’s Thesis, Technical University of Munich (Germany).
Grigoropoulos, G., Keler, A., Kaths, H., Spangler, M. and Busch, F. (2019). Using Geodata for Simulating Urban Traffic - Current Research in the Field of Traffic Engineering and Control. Geoinformationssysteme 2019 - Beiträge zur 6. Münchner GI-Runde, Runder Tisch GIS e.V., 45-49.
He, Q., Fan, X. and Ma, D. (2005). Full bicycle dynamic model for interactive bicycle simulator. Journal of Computing and Information Science in Engineering, 5(4), 373-380.
Keler, A., Kaths, J., Chucholowski, F., Chucholowski, M., Grigoropoulos, G., Spangler, M., Kaths, H. and Busch, F. (2018). A bicycle simulator for experiencing microscopic traffic flow simulation in urban environments. 2018 21st International Conference on Intelligent Transportation Systems (ITSC), IEEE, 3020-3023.
Kwon, D. S., Yang, G. H., Lee, C. W., Shin, J. C., Park, Y., Jung, B., Lee, D. Y., Lee, K., Han, S. H., Yoo, B. H., Wohn, K. Y. and Ahn, J. H. (2001). KAIST interactive bicycle simulator. Proceedings 2001 ICRA - IEEE International Conference on Robotics and Automation (Cat. No.01CH37164), Seoul, South Korea, 2001, 3, 2313-2318.
López, P. A., Behrisch, M., Bieker-Walz, L., Erdmann, J., Flötteröd, Y.-P., Hilbrich, R., Lücken, L., Rummel, J., Wagner, P. and Wießner, E. (2018). Microscopic Traffic Simulation using SUMO. 2018 21st International Conference on Intelligent Transportation Systems (ITSC), IEEE, 2575-2582.
Schramka, F., Arisona, S., Joos, M. and Erath, A. (2018). Development of a Virtual Reality Cycling Simulator. Journal of Computers, 13(6), 603-615.
Twaddle, H. and Grigoropoulos, G. (2016). Modeling the Speed, Acceleration, and Deceleration of Bicyclists for Microscopic Traffic Simulation. Transportation Research Record: Journal of the Transportation Research Board, (2587), 8-16.
Twaddle, H., Grigoropoulos, G. and Busch, F. (2016). Integration of an external bicycle model in SUMO. SUMO 2016 - Traffic, Mobility, and Logistics - Proceedings, 93-102.