Web Ecology 8: 67–73.
Statistical analysis is an important and responsible stage in ecological research, often posing a challenge. One of the main problems is that the statistical samples typical of ecological research frequently include data that violate the original assumptions of standard analytical tools. A large array of tests has been designed for data of different charac-teristics (non-normal distribution, unequal variance). Yet, recommendations found in textbooks (Snedecor and Co-chran 1980, Sokal and Rohlf 1995, Zar 1999) and hand-books of statistical software (e.g. Statistix 8, Analytical Software, Tallahassee, FL) are not always consistent. For example, ANOVA can compare two or more means, and,
when applied to two samples, produces exactly the same p-values as t-test for equal variance. Therefore, ANOVA can replace t-tests for two samples, yet habitually we still use t-tests, and employ ANOVA only when we have more than two means. Why this redundancy? The advantage of t-tests may be that it has a special version adjusted to unequal variance. As far as we know, ANOVA does not provide any widely used procedure for correcting p-values for unequal variance, although tests for equality of vari-ance, such as Bartlett’s test or Levene’s test, are routinely calculated for testing departures from ANOVA assump-tions. In these situations, the user is left in a position of
Unexpected failures of recommended tests in basic statistical
analyses of ecological data
Zaal Kikvidze and Jordi Moya-Laraño
Kikvidze, Z. and Moya-Laraño, J. 2008. Unexpected failures of recommended tests in basic statistical analyses of ecological data. – Web Ecol. 8: 67–73.
Ecologists, when analyzing the output of simple experiments, often have to compare statistical samples that simultaneously are of uneven size, unequal variance and distrib-ute non-normally. Although there are special tests designed to address each of these unsuitable characteristics, it is unclear how their combination affects the tests. Here we compare the performance of recommended tests using generated data sets that simu-late statistical samples typical in ecological research. We measured rates of type I and II errors, and found that common parametric tests such as ANOVA are quite robust to non-normality, uneven sample size, unequal variance, and their effect combined. ANOVA and randomization tests produced very similar results. At the same time, the t-test for unequal variance unexpectedly lost power with samples of uneven size. Also, non-parametric tests were strongly affected by unequal variance in large samples, yet non-parametric tests could complement parametric tests when testing samples of une-ven size. Thus, we demonstrate that the robustness of each kind of test strongly depends on the combination of parameters (distribution, sample size, equality of variances). We conclude that manuals should be revised to offer more elaborate instructions for apply-ing specific statistical tests.
uncertainty: how much can we trust ANOVAs if the tests show significant heteroscedascity (i.e. unequal variances)? Some recent manuals do not discuss tests for unequal vari-ance at all (Quinn and Keough 2002, Gotelli and Ellison 2004).
Another example of uncertainty is the use of non-par-ametric tests recommended for ‘low quality’ data such as samples of unknown distribution (Snedecor and Cochran 1980, Sokal and Rohlf 1995, Zar 1999). Non-paramet-ric tests are generally considered weaker than parametNon-paramet-ric tests, but it is believed that because non-parametric tests are based on data ranks and not on the assumptions on data distribution, they are robust to distribution type. Hence, non-parametric tests can be employed when the use of parametric test is doubtful due to indeterminable distribution type. However, several studies have criticized non-parametric tests for their poor robustness (Johnson 1995, Smith 1995, Vickers 2005), and experts actually ad-vocate for the use of computer-intensive methods such as randomization tests (Manly 1997, Slade 1999, Fortin and Jacquez 2000, Peres-Neto and Olden 2001, Roff 2006).
Finally, standard tests such as ANOVAs were originally designed for samples of even size, and formulations for samples of uneven size have been derived later. Textbooks rarely comment on this issue in detail and usually provide only a vague note that the power of a test is highest with even sample sizes (Snedecor and Cochran 1980, Sokal and Rohlf 1995, Zar 1999). For factorial designs (i.e. more than one experimental factor), the use of different types of sums of squares for improving robustness in unbalanced designs have been largely discussed (Milliken and Johnson 1992). However, in principle, for uni-factorial designs, such as the ones we discuss here, ANOVAs should not be highly influenced by unequal sample sizes.
In addition to the above uncertainties, it is unclear how the combination of unsuitable characteristics affects popu-lar statistical tests. Here we address these questions using generated data sets that simulate statistical samples
typi-cal of ecologitypi-cal research. We measured the rates of type I and II errors with the aim to assess how the combinations of non-normal distribution, unequal variance and sample size affect the performance of the tests. In addition, we as-sess whether the special test devised for unequal variances is robust to distribution type and uneven sample size, and whether non-parametric and randomization tests are uni-versally robust to the combinations of these unsuitable characteristics, as it is implicitly assumed.
Methods
Data generation – simulations
For the basic simulations, we used a random number gen-erator to produce 20 000 normally distributed data points following a standard normal distribution (mean ≈ 0 and SD ≈ 1). For additional simulations, we also converted the original data using an exponential transformation to ob-tain a highly skewed log-normal distribution (If Y is a ran-dom variable with a normal distribution, then X = exp(Y) has a log-normal distribution). We then randomly divided the generated data arrays into control and treatment popu-lations (10 000 cases in each), and adjusted means and SD values to desirable numbers up to their second deci-mal place (Table 1, columns 5–8). We then sampled the populations randomly to obtain the control and treatment samples of desired size (Table 1, columns 2 and 3). The pa-rameters of samples generated in this way varied consider-ably (for example, the sample size n ranged from 5 to 200, the relative variance from 1 to 100%, etc.). However, for simplicity, here we only present a part of these simulations with certain extreme characteristics as an illustration. We tested evenly large, evenly small, and uneven-size samples (Table 1, second and third columns). The variance of these samples was equal or unequal (Table 1, last two columns).
Table 1. Parameters of data categories (seven parameter combinations used with each of three distribution types).
Category no.
Sample size Mean SD
Control Treatment Control Treatment Control Treatment
type I type II
1 60 60 100 100 105 10 10
2 60 60 100 100 105 5 15
3 6 6 100 100 105 10 10
4 6 6 100 100 105 5 15
5 6 60 100 100 105 10 10
6 6 60 100 100 105 5 15
Finally, in samples of uneven size, variance could be equal or unequal. When variances were unequal, it could be that the control was more variable than the treatment or vice versa (Table 1, last three rows). However, in all cases in which there was an effect, the treatment mean was larger than that of the control.
Tests and analyses
The difference between means of control and treatment samples we compared using parametric, non-parametric and randomization tests. As parametric tests, we used common t-tests for equal and unequal (Blalock 1972) variances. The t-test for equal variances produces p-values identical to ANOVA when applied to two-sample tests (In-troduction), and accordingly hereafter we refer to this test as ANOVA. The t-test for unequal variance will be here-after referred to as TUV. As a non-parametric statistical test we used the popular Wilcoxon rank sum test, which is identical to the Mann–Whitney U-test (hereafter U-test). All calculations were performed with the software Statistix 8. We also applied randomization tests, using the differ-ence between means of the control- and test-samples as a pivotal test statistic. We reshuffled data between these two samples, and recalculated the mean difference between the
samples randomized in this way. We repeated randomi-zations 10 000 times and determined p-values from the number of randomized mean difference values equal or more extreme than that observed (Slade 1999, Fortin and Jacquez 2000).
The rates of type I and II errors were calculated in the usual way by repeatedly sampling the statistical popu-lations described above (Moya-Laraño and Wise 2007), and converting the frequencies of tests in which results were significant (p-values below 0.05) into percentages. For type I error rates we used samples with equal means, and for type II error rates we adjusted mean values of treatment population to 105 (Table 1). The error rates were calculated as the percentages from testing 300 sam-ples.
Results
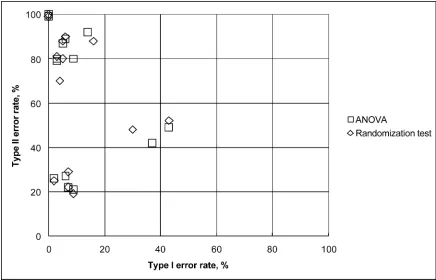
Two tests, ANOVA and randomization tests, performed practically indistinguishably as their error rates clustered very closely (Fig. 1). Rates of error type I and II produced by ANOVA, TUV, and U-tests were also very close with samples of even size (not shown). With skewed distribu-tions, however, tests showed different results depending on the combination of the other parameters. While with
Fig. 2. Performance of statistical tests with skewed samples of even size and equal variances. ANOVA stands for analysis of variance, TUV for t-test for unequal variances, and U-test for Mann–Whitney U-test.
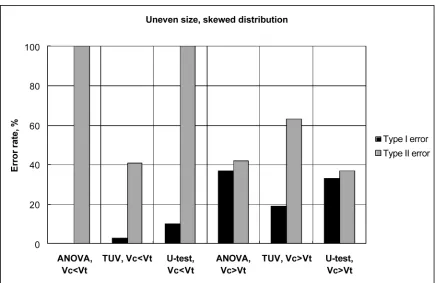
Fig. 4. Performance of statistical tests with skewed samples of uneven size and unequal variance. ANOVA stands for analysis of vari-ance, TUV for t-test for unequal variances, and U-test for Mann–Whitney U-test. Vc and Vt refer to the variance of the control and treatment groups respectively.
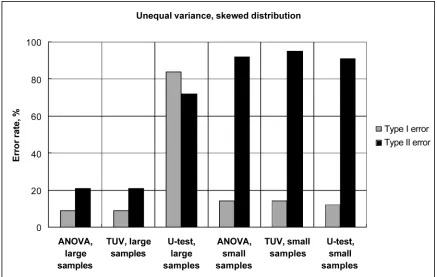
ples of equal variance the U-tests were slightly superior to ANOVA (Fig. 2), with unequal variance non-parametric test started to unexpectedly fail, producing very high (up to 80% rates) of both type errors for large samples (yet for small samples most tests were very close to each other, Fig. 3). The tests differed also in robustness when samples of uneven size was combined with unequal variances (Fig. 4): when the smaller sample (control) was less variable than the larger one (treatment) ANOVA showed very low type I (close to 0) but very high type II (close to 100%) error rates. Under this scenario, TUV performed better than ANOVA, with relatively low type I but moderate type II error rates (ca 40%). Conversely, when the smaller sample was more variable than the larger one, ANOVA appeared more balanced (ca 40% for both type errors) while TUV produced lower type I error rates (ca 20%) but higher type II error rates (60%). The performance of U-tests was close to that of ANOVA. Remarkably, the dependence of per-formance of tests on the combination of unequal variance and sample size was observed also in normal samples (Fig. 5), although ANOVA was evidently superior to the U-test in these samples. Yet the case with normal samples of un-even size is remarkable, because TUV lost its power with more variable small sample size even more dramatically than in cases of skewed samples, as type II errors increased up to 90%! This coincided with a decrease of type I error
to 7%, which means that the test became too conservative. ANOVA was more balanced producing 43 and 47% of, respectively, type I and type II errors.
Discussion
The t-tests of unequal variances showed good perform-ance or unexpected failure depending on the parameter landscape. With samples of equal size TUV preformed similar to ANOVA, but with samples of unequal size its behavior depended on how variance and sample size were combined. While TUV was very good producing low rates of type I and II errors when the smaller sample was more variable than the larger one, it lost power producing high rates of type II errors when the small sample was less varia-ble than the large one. This empirical result does not agree well with the theoretical expectations derived recently by Ruxton (2006), although we share his criticisms of the U-test. However, Ruxton (2006) did not test the type II error rates produced by TUV. This may mean that in half of the cases analyzed with TUV, where uneven sample size com-bines with unequal variances, the conclusions are doubt-ful. It would appear that statistical textbooks and manuals should warn the reader about this important failure of this test.
Non-parametric tests generally performed better than parametric tests with small samples, but there was still an unexpected important case of failure with large samples of unequal variance. Textbooks shall warn the user that non-parametric tests may depend on variance heterogeneity in large samples. Yet, with uneven sample size non-parametric tests were more robust to the landscape of parameters.
From the above analyses we can reach several conclu-sions. First, testing variance equality (Bartlett’s or Lev-ene’s tests) has little sense with samples of even, or nearly even size, and ANOVA can be used even for comparing two samples (where t-tests are routinely used). How-ever, when sample size is notably uneven, the researcher shall check how variance combines with samples size to decide whether ANOVA or TUV is more appropriate. When does unevenness of sample size become critical? This question needs further study. Our next conclusion is that ANOVA is robust to data distribution type, even to highly skewed distributions. Finally, non-parametric tests are sensitive to unequal variance in even samples of large size, and care should be taken when using them. However, non-parametric tests can be useful with samples of uneven size, especially when the combination of parameters is not in favor of ANOVA. Importantly, the TUV should be considered with caution and only be used in a restricted number of scenarios.
Acknowledgements – This work has been supported by Ramon y Cajal Fellowship program. Z. K. and J. M. acknowledge sup-port from Spanish Ministry of Education and Science Grants, CGL2004–03604–C02–01 and CGL2007–60520, respective-ly.
References
Blalock, H. M. 1972. Social statistics (2nd ed.). – McGraw-Hill.
Fortin, M.-J. and Jacquez, G. M. 2000. Randomization tests and spatially auto correlated data. – ESA Bull. 81: 201–206. Gotelli, N. J. and Ellison, A. M. 2004. A primer of ecological
statistics. – Sinauer.
Johnson, D. H. 1995. Statistical sirens: the allure of non-para-metrics. – Ecology 76: 1998–2000.
Manly, B. F. J. 1997. Randomization, bootstrap and Monte Car-Randomization, bootstrap and Monte Car-lo methods in bioCar-logy (2nd ed.). – Chapman and Hall. McArdle, B. H. and Anderson, M. J. 2004. Variance
heteroge-neity, transformations and models of species abundance: a cautionary tale. – Can. J. Fish. Aquat. Sci. 61: 1294–1302. Milliken, G. A. and Johnson, D. E. 1992. Analysis of messy data.
Vol. I. Designed experiments. – Chapman and Hall. Moya-Laraño, J. and Wise, D. H. 2007. Two simple strategies
to increase the power of experiments with multiple response variables. – Basic Appl. Ecol. 8: 398–410.
Peres-Neto, P. and Olden, J. D. 2001. Assessing the robustness of randomization tests: examples from behavioural studies. – Anim. Behav. 61: 79–86.
Quinn, G. P. and Keough, M. J. 2002. Experimental design and data analysis for biologists. – Cambridge Univ. Press. Roff, D. A. 2006. Introduction to computer-intensive methods
of data analysis in biology. – Cambridge Univ. Press. Ruxton, G. D. 2006. The unequal variance t-test is an underused
alternative to student’s t-test and the Mann–Whitney U-test. – Behav. Ecol. 17: 688–690.
Slade, N. 1999. Randomization tests using standard statistical software. – ESA Bull. 80: 179–180.
Smith, S. M. 1995. Distribution free and robust statistical meth-ods: viable alternatives to parametric statistics? – Ecology 76: 1997–1998.
Snedecor, G. W. and Cochran, W. G. 1980. Statistical methods (7th ed.). – Iowa State Univ. Press.
Sokal, R. R. and Rohlf, F. J. 1995. Biometry: the principles and practice of statistics in biological research (3rd ed.). – Free-man and Co.
Vickers, A. J. 2005. Parametric versus non-parametric statistics in the analysis of randomized trials with non-normally distrib-uted data. – BMC Med. Res. Methodol. 5:35. <http://www. biomedcentral.com/1471-2288/5/35>.