Feng Qi
a,*, Seth Docherty
ba School of Environmental and Sustainability Sciences, [email protected] b Esri, [email protected]
* Corresponding author
Abstract: Traditional maps are often direct visualizations of the Euclidean distances in space. As the concepts of time and distance are intrinsically intertwined in the human cognitive systems for environmental perception, the mapping of a unity of time and distance is thus either intuitive or convenient in many occasions. This paper presents three examples to demonstrate the value of visualizing time-distance instead of the physical Euclidean distance in contemporary mapping. The first example maps travel time as perceived distance in an urban environment. Visualizations of the time-space reflecting modern high-speed travel behaviours make it convenient to detect patterns and identify anomalies that matter for the functions in such space. The second example concerns trail mapping in a remote rainforest, where hand-drawn maps reflecting travel effort are more desirable than accurate GIS maps for local navigation and trail hiking purposes. The last example shows that traditional maps are ineffective in communicating hurricane flooding risks since the conventional spatial model based on surficial distance does not reflect non-surficial spatiotemporal dynamics for realistic representations of the risk space. While the Euclidean distance on the physical earth surface is what traditional maps chart and what our modern spatial thinking has been accustomed to, these examples show that such distance is limited in portraying many aspects of our perceived and experienced dynamic distances that affect our living. The adoption of spatial representations such as time-distance maps breaks the mental set accustomed to the traditional distance maps and is worth considering in many occasions.
Keywords: Time-distance visualization, Distance cartogram, Travel time, Cognitive distance, Distance perception
1.
Introduction
Traditional maps are the symbolic representations of space, showing physical locations and relationships between elements in the space. Thus they are direct visualizations of distance and the distances between locations on a map are conventionally scaled to the physical, Euclidean distances in reality. At the same time, the geographic metaphor has often been applied in the visualizations of time, as seen in the many classical time maps archived by Rosenberg and Grafton (2010). We note that the concepts of time and distance are intrinsically intertwined in the human cognitive systems for environmental perception. The mapping of a unity of time and distance is thus either intuitive or convenient in many occasions.
From a cognitive point of view, time and distance are inseparable concepts. It is recognized that children’s cognitive development of the time concept goes through a stage when the perception of time equals to distance (Clark, 1973). Experiments by Herman and colleagues (1984) looking at the relationship between time and distance in spatial cognition development also show evidence how perceived distance by young children being greatly influenced by travel time. Children understand the concept of distance through how long it takes to traverse the distance and the cognitive basis of distance is travel time (Golledge and Zannaras, 1973; MacEachren, 1980).
In turn the mental picture of time is spatial. As time is intrinsically related to change and movement (Callender et al., 2001), the perceptual basis of time takes the spatial form (Mitchell, 1980), and time is viewed as a spatial metaphor (Clark, 1973).
From a historical and practical point of view, early maps used for navigation purposes charted physical distances between places to guide navigation as it was convenient and reasonable. Three factors were identified to affect distance perception: environmental features, travel time, and travel effort (Montello, 1997). On the relatively flat and uniform terrains in early agricultural societies, perceived distance was largely determined by the physical distance with simple modes of transportation available at that time. Such simple approximation of perceived distance with physical distance, however, becomes inaccurate whenever the three factors exhibit heterogeneity over space. This happens where terrains are irregular, as route and traffic conditions become complex, and when modes of transportation diversify. The use of Euclidean distance maps to guide navigation is no longer intuitive as travel time is often over- or under-estimated (Kosslyn et al., 1978; Byrne, 1979; Sadalla and Magel, 1980; Anooshian and Kromer, 1986; Costa and Bonetti, 2018).
and spatial interrelations, with which distances are not naturally perceived in measures, but in travel effort (Schemmel, 2016). Metrization of mental models of space using numbering system, units and arithmetic notations for measuring distance is not intuitive but a social cultural product (Schemmel, 2016). It is the addition of social cognition and education that altered the original models. In various indigenous cultures and sometimes under-educated communities where the precise mathematical representation of distance has not become a routinely performed practice, people’s mental map of their living space often reflect directly the travel time around, modulated by the environmental conditions or travel effort. Although the use of Cartesian Coordinate System, Euclidean Distance, etc. has become common practice for mapping in Western cultures, spatial cognition, being essentially socio-cultural, varies across cultures and the way such cognition is materialized in maps, should be as well.
In recognition of these backgrounds and perspectives in space cognition and distance perception, we present here three examples to demonstrate the value of visualizing
time-distance instead of physical distance in contemporary mapping.
2.
Mapping time-distance
2.1 Mapping travel time in the New York
Metropolitan Area
In modern cities our travel time is controlled by various high-speed transportation modes and thus modulated by such factors as transportation network, availability of public transit, and traffic conditions, among others. This is different from the old times when transportation mode was largely uniform and thus physical distance was a plausible approximation of perceived distance. In order to visualize the perceived distances in the New York Metro area, we used distance cartograms to map travel time in and out of New York City with different transportation options.
A cartogram is a map in which some thematic mapping variable is substituted for land area or distance (Tobler 2004). The geometry or space of the map is distorted in order to convey the information of this alternative variable. While with an area cartogram, areas of traditional map units are altered and scaled according to the quantity to be mapped, a distance cartogram is designed to alter distances on maps to represent quantities. Time-space transformations in the means of distance cartograms have been constructed to visualize transportation networks with the multidimensional scaling (MDS) algorithm (Ahmed and Miller, 2007), the Levenberg-Marquardt method and an improved algorithm by Shimizu and Inoue (2009). In this study we used the algorithm developed by Shimizu and Inoue (2009) as the resulting cartograms do not exhibit excessive distortions from the original map and topological properties of the point configurations are maintained. Locations of cities within the New York metro area were adjusted based on
travel time in and out of New York City with both driving and public transportation options. Traffic conditions on the driving routes were considered when computing travel times for the driving option. Figure 1a is the original map of the area and Figure 1b illustrates one of the distance cartograms generated, where the shape of the physical space is warped based on travel time.
(a)
(b)
Figure 1. New York Metro area (a) and the altered representation based on travel time by driving out of New York City (b).
zone, to the west of which congested condition persists. This is even more of the case with public transportation. Figure 2 shows the distance cartogram representing the altered space by public transportation zoomed in to the bottleneck area. Many towns in this area located far from each other in the physical space access New York City with similar travel time as travel time is largely controlled by the single available public transportation system, the Long Island Rail Road (LIRR). Such visualizations make it convenient for the identification of problems and provide insights to targeted solutions for the transit services at the identified places.
Figure 2. Portion of the distance cartogram representing travel time by public transit in the NY metro area. Comparing the time-space of driving to that of public transportation, it was noted that public transportation incurs more travel time than driving for almost all suburban destinations to and from NYC, even with traffic during rush hours. This provides evidence for the need of improvement of public transportation in the NY metro area in general. One anomaly, however, was noted for a New Jersey town, which has shorter travel time by public transit than driving. It was found out that majority of the residents of this town commute to NYC to work in the financial industry. Whether it is because the convenient public transportation available made these bankers choose the town as their suburban home or it was because the bankers lived here first and facilitated the adding of convenient public transit services may deserve further investigation. Identification of such unique places was made easy by such maps of time-distance as it reflects directly the experienced distance influenced by modern modes of living.
2.2 Trail mapping in Costa Rica
The second example is about trail mapping in a remote jungle near the border of Costa Rica and Nicaragua in Central America (Fig. 3). An eco-lodge has been established in a dense primary forest area that attracts tourists and researchers. Visitors have been navigating the forests, lagoons, and trails assisted by a hand-drawn map made by local people (Fig. 4, left). A recent ecological study made possible precise tracing of the roads, trails and water bodies in the area and an accurate map was created (Fig. 3, top-right and Fig. 4, right). The difference between Figure 3 top-right and Figure 4 right
is the orientation. During an early discussion with local people, they have expressed concerns about the main road going horizontally and turning slightly downward on the map when we adopted the mapping convention with north pointing up. In their perception of their land, they always go “up” the road from the lodge and primary forest to the once logged secondary forest and further. The orientation was thus adjusted to match their perception. The map was designed using a few different styles, printed and laminated for them to use in the wet climate.
Figure 3. Location of the trailing mapping example In the next couple of years that follow, it was noticed that use of the accurate map received great resistance by the local people even with the orientation adjusted to match their map. They insisted on hanging the hand-drawn maps where directions are needed in the woods. It was revealed later that the new, accurate map just does not match their mental perception of the environment. For example, the short curved trail marked at point “A” is perceived to be much longer than it actually is due to rough terrain and much barriers existing along the trail. The pond marked at point “B” is perceived to be much larger than the actual size as trespassing the pond requires balanced jumping on wooden poles erected across it and thus incur much travel effort and time.
Figure 4. Maps of hiking trails in a remote forest in Costa Rica. Left: hand-drawn; Right: ArcGIS map created with GPS and Remote Sensing data.
This is a typical example showing how people’s mental perception of the environment and distances in the environment reflect largely travel time and travel effort, especially for those who did not grow up exposed to the spatial framework of coordinate systems and metric distances. Different from those who used globes and maps to learn spatial concepts, perceive distances and perform routine route-finding growing up in the developed world, the use of such tools and maps are not intuitive and effective for people from remote communities.
2.3 Visualizing and communicating coastal flooding risk
The last example concerns perception and communication of risks during time of a natural disaster. Hurricane Sandy came ashore on the New York and New Jersey coast on October 29, 2012. The massive storm surge inundated a large swath of the coastal area, resulting in widespread damages to residential homes and infrastructure. Many communities affected by the disaster were under-prepared to take appropriate actions before the storm due to misperception and ineffective communication of risks. One reason was of course the unprecedented magnitude of the storm and lack of direct experience and alertness. The other reason had something to do with distance.
During the strike of the storm, as near shore communities aroused adequate level of alertness voluntarily and received warning from local authorities, they evacuated timely. Some far shore communities with direct hydraulic connectivity to the Ocean, however, did not evacuate due to their inland locations. Their decisions of no-action were partly because they did not receive sufficiently alerting messages from authorities, and partly because they themselves did not perceive any immediate risk as those residents living near shore.
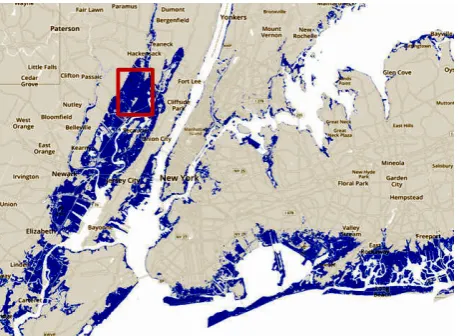
The towns along the Hackensack River estuary in northern New Jersey are victims of such inadequate risk perception and communications (indicated by the red box in Fig. 5). This low-lying area is located more than 32 kilometres inland but has direct hydraulic connectivity to the Atlantic Ocean. Towns such as Little Ferry, Moonachie, and Kearny among others did not evacuate but flooding happened overnight. A quarter of the residents of Moonachie and Little Ferry (3,500 people) had to be rescued, plucked from second floor windows or from roofs (O’Brien et al., 2012). A thorough post-Sandy assessment of this area by the New Jersey Department of Community Affairs reported that 2,222 homes and rental units suffered major or severe damage causing an estimated $46.5 million monetary loss (O’Dea, 2013). The long surficial distance led to the misperception that it would either not flood or take longer time for any impact to occur at these locations. As reports later indicated that the actual flooding areas did not miss the predicted surge flood areas by authorities (FEMA modelling task force and U.S. Army Corps of Engineers) to a large extent
(Diaz, 2017). The link for communicating the risks broke from the scientific authorities to local residents, through local decision makers. We would argue that one of the reasons is that both the local decision makers (the mayors of towns along the Hackensack river, for example) and the residents are accustomed to perceive risk based on surficial distances and did not realize the actuality and urgency of the estimated risk.
Figure 5. Flooded areas in North NJ and NY from Hurricane Sandy. (Source: Jackson, 2017)
The lesson learned is that people, including decision makers, tend to perceive risks and communicate such using our accustomed spatial models based on surficial physical distances. After all, we have always been educated and reinforced with the spatial model implying such distance with traditional ways of mapping around us. In this example, while scientists were able to incorporate physical models to reveal non-surficial spatiotemporal dynamics and generate a more realistic representation of the risk space, such information is lost in communications as it conflicts with common people’s perception cultivated by years of utilizing the traditional distance map to represent space.
3.
Concluding remarks
last example shows that when our thinking is structured and rigidified by the traditional way of mapping distances, it impacts our ability to perceive and communicate knowledge and risks that are not defined by the traditional framework.
In the modern society one’s space and distance perception may be affected by many different factors. For example, perceived distance in a shady urban neighbourhood known for high crime rates may be greatly different from that in an open and safe environment. Walking a certain distance in the former may feel like much longer than the later. The mental map of a university campus could be very different between a freshman who is unfamiliar with the environment, and a senior who has trod all hidden routes. The mental map of the same campus may also be different between a student and a strict university president, who never walks off paved paths and steps on grasses. In other words, perceived space and distance are affected by the built environment, one’s sense of security and identity, among others, in addition to travel time and travel effort, in the modern society. This calls for versatile new spatial models and map representations to use for different purposes.
References
Ahmed, N. and Miller, H.J. (2007). Time-space transformations of geographic space for exploring, analyzing, and visualizing transportation systems. Journal of Transport Geography 15: 2–17.
Anooshian, L.J. and Kromer, M.K. (1986). Children's spatial knowledge of their school campuses. Developmental Psychology, 2: 854-860.
Byrne, R.W. (1979). Memory for urban geography. Quarterly Journal of Experimental Psychology, 31(1): 147-154.
Callender, C., Edney, R. and Appignanesi, R. (2001). Introducing Time. 3rd Edition. Cambridge: Totem Books. pp. 176.
Clark, H.H. (1973). Space, Time, Semantics, and the Child. In T. Moore (Ed.), Cognitive development and the acquisition of language (pp. 27-63). New York: Academic Press.
Costa, M. and Bonetti, L. (2018). Geometrical distortions in geographical cognitive maps. Journal of Environmental Psychology 55: 53-69.
Diaz, C. (2017). Before the Storm. WNYC News Article accessed from: https://project.wnyc.org/before-the-storm/
Golledge, R.G. and Zannaras, G. (1973). Cognitive approaches to the analysis of human spatial behavior, in W.H. Ittelson (Ed.), Environment and Cognition (pp. 59-94). New York: Seminar Press.
Herman, J.F., Roth, S.F. and Norton, L.M. (1984). Time and distance in spatial cognition development. International Journal of Behavioral Development 7(1): 35-51.
Jackson, S. (2017). Conference Brief: Protecting New York and New Jersey from Future Disastrous Storm Surges. National Institute for Coastal and Harbor Infrastructure (NICHI) report, Accessed from:
https://www.nichiusa.org/?p=3944#_ftn2
Kosslyn, S.M., Ball, T.M. and Reiser, B.J. (1978). Visual images preserve metric spatial information: Evidence from studies of image scanning. Journal of Experimental Psychology: Human Perception and Performance, 4(1): 47-60.
MacEachren, A.M. (1980). Travel time as the basis for cognitive distance. Professional Geographer 32(1): 30-36.
Mitchell, W.J.T. (1980). (ed.) The Language of Images. Chicago: University of Chicago Press.
Montello, D.R. (1997). The perception and cognition of environmental distance: Direct sources of information. In S.C. Hirtle and A.U. Frank (Eds.), Spatial information theory: A theoretical basis for GIS (pp. 297-311). Proceedings of COSIT ’97. Berlin: Springer-Verlag.
O’Brien, R.D., Hayes, M. and Levin, J. (2012). Shellshocked by Hurricane Sandy. News Article
accessed from NorthJersey.com:
https://www.northjersey.com/story/weather/2017/10/04/ archive-shellshocked-hurricane-sandy/732330001/
O’Dea, C. (2013). Interactive Map: Assessing Damage from Superstorm Sandy. Njspotlight. Accessed from: http://www.njspotlight.com/stories/13/03/14/asses sing-damage-from-superstorm-sandy/
Rosenberg, D. and Grafton, A. (2010). Cartographies of Time. New York: Princeton Architectural Press. pp. 272.
Sadalla, E.K. and Magel, S. (1980). The perception of traversed distance. Environment and Behavior, 12: 65-79.
Schemmel, M. (2016). Historical epistemology of space: from primate cognition to spacetime physics. Cham: Springer International Publishing. pp. 117.
Shimizu, E. and Inoue, R. (2009). A new algorithm for distance cartogram construction. International Journal of Geographical Information Science, 23(11): 1453–1470. Tobler, W. (2004). Thirty five years of computer