Laboratory device to analyse the impact of soil properties on electrical
and thermal conductivity
David Bertermann* and Hans Schwarz
Friedrich-Alexander University Erlangen-Nuremberg, GeoZentrum Nordbayern, Schlossgarten 5, 91054 Erlangen, Germany Received December 19, 2016; accepted April 20, 2017
*Corresponding author e-mail: david.bertermann@fau.de A b s t r a c t. Gathering information about soil properties in an efficient way is essential for many soil applications also for very shallow geothermal systems (e.g. collector systems or heat baskets). In the field, electrical resistivity tomogramphy meas-urements enable non-invasive and extensive analyses regarding the determination of soil properties. For a better understanding of measured electrical resistivity values in relation to soil properties within this study, a laboratory setup was developed. The structure of this laboratory setup is geared to gather electrical resistivity or rather electrical conductivity values which are directly com-parable to data measured in the field. Within this setup grain size distribution, moisture content, and bulk density, which are the most important soil parameters affecting the electrical resistivity, can be adjusted. In terms of a better estimation of the geothermal capability of soil, thermal conductivity measurements were also implemented within the laboratory test sequence. The generated data reveals the serious influence of the water content and also provides a huge impact of the bulk density on the electrical as well as on the thermal conductivity. Furthermore, different behaviour patterns of electrical and thermal conductivity in their particular relation to the different soil parameters could be identified.
K e y w o r d s: electrical resistivity, thermal conductivity, soil properties, Wenner array
INTRODUCTION
Soil, as a differentiated subject, is implicated in many
ordinary operations in which its complexity often is neglected. However, an effective determination of the dif -ferent soil properties and the corresponding soil texture is
crucial for a proper soil management. Regarding subsur
-face geothermal systems, a precise knowledge about the thermal conductivity and the water content of the soil is
essential in order to make convenient recommendations on
the feasibility of a planned geothermal project (Bertermann
et al., 2014; 2015; Dehner, 2007). A good knowledge and
a wider understanding of the subsurface soil material and its exploration are important not only for shallow geothermal
installations. In general, soil properties e.g. water content
or bulk density are important for many other utilisations
like agricultural issues (Grisso et al., 2009), flood protec
-tion (Hümann et al., 2011; Sangati et al., 2009; Saxton and
Rawls, 2006) or dealing with natural hazards (Malehmir et al., 2016). From geoelectrical measurements the actual soil
conditions being on-site can be derived, which is used with
-in various applications (Loke et al., 2013; Samouelian et al., 2005). To save time it is attempted to analyse pedologi
-cal issues directly on-site. With the fast and non-invasive ERT method these cost-efficient investigations over a huge
area are possible, but due to the fact that the electrical as
well as the thermal conductivity of the ground is based on
several factors, a distinct assignment is often tricky.
Friedman (2005) divides many of those factors which
are supposed to have an impact on the electrical conducti-
vity (EC) into three categories. Within the first ‘bulk soil’ category porosity, water content, and soil structure matters. The factors of the second category are the ‘relevant solid particle quantifiers’ and the third category includes the ‘soil solution attributes’. Despite all these different factors with
-in these categories the water content (θ) remains as a major
influencing factor regarding the EC (σ). This corresponds to Archie law Eq. (1):
( )
,n m b
a
=
φ θ φ σ θ
σ (1)
where: the subscript b denotes the brine or bulk solution, is the porosity and a, m and n are fitting parameters (Ewing and Hunt, 2006). Due to this relationship the electrical conductivity can be used for evaluating volumetric water
content (Friedman, 2005; Sheets and Hendrickx, 1995). The apparent soil electrical conductivity can be influenced by soluble salts, clay content, mineralogy, soil water con -tent, bulk density, organic matter, and soil temperature
(Bai et al., 2013; Corwin and Lesch, 2005). Therefore,
the electrical conductivity can also be used to map several
pedological properties. Nevertheless, Eq. (2) after Rhoades
et al. (1976) describing the apparent electrical conductivity (ECa) includes in a simplified manner just the water con
-tent and the grade of saturation as well as the bulk density (Corwin and Lesch, 2005):
(2)
within the Eqs (2)-(7) θW,θWS, and θSS are the different volu-
metric water contents: the total water content, the water content of the soil-water pathway, and of the surface-con -ductance. ECWS, ECWC, ECSS and ECSC, are the specific ECs
of the soil-water pathway, of the continuous-liquid path
-way, of the surface-conductance and of the indurated solid phases, respectively. Within the following approximations
ECW is the average EC of the soil water and ECE is the EC of the saturation extract. Furthermore PW is the
gravimet-rical water content, SP the saturation percentage and ρb is
the bulk density (Rhoades et al., 1999; Corwin and Lesch,
2005):
(3)
(4)
(5)
(6)
(7) These simplifying approximations (2) – (6) are reliable except under extremely dry soil conditions (Corwin and Lesch, 2005).
One of the key parameters for the performance of hori
-zontal geothermal systems is the thermal conductivity of the soil. This parameter has a huge impact on the economic efficiency of an installed very shallow geothermal system (Bertermann et al., 2014). Thermal conductivity is mainly
driven by the texture respectively the structure of the soil
body and its mineralogy within the first few meters of the ground (Logsdon et al., 2010). Amongst other factors like organic matter, the most relevant parameters are bulk
density, soil moisture, and grain size distribution (Abu-Hamdeh, 2003; Abu-Hamdeh and Reeder, 2000; Farouki, 1981). Due to the comparatively few inlet parameters (Bertermann et al., 2014), one of the most commonly used
formulas to determine the thermal conductivity (λ) are the
Eqs (8), (9) according to Kersten (1949). The granulo-metry is considered within the two different formulas for soil under unfrozen conditions; one for sandy soil (Eq. (8)) and one for silt and clay soils (Eq. (9)). Within the follow
-ing equations the relationship provided by Eq. (3) is used to
constrain the inlet parameters, by reducing them to the bulk
density (ρb) and the total volumetric water content (θW):
(8)
(9) Most of the mentioned soil parameters like mineralogy, grain size distribution, soil moisture, and bulk density are affecting thermal and electrical conductivity (Logsdon et al., 2010; Sreedeep et al., 2005). In this context Singh et al.
(2001) expressed a general relationship Eq. (10) between both conductivities or in this particular case between the
electrical ρE and thermal resistivity ρT with a multiplier CR
which depends on the sum of the sand size fraction and with that on the grain size distribution.
(10)
In order to analyse pedological properties referring to electrical and thermal resistivity in a homogenous
set-ting with known and controlled soil attributes a laboratory
concept is needed. Several similar approaches have been
carried out (Liu et al., 2013; Logsdon et al., 2010; Rhoades
et al., 1976; Singh et al., 2001; Sreedeep et al., 2005).
Many approaches had their focus on one soil type like clay (Giao et al., 2003; Kaufhold et al., 2014) or on the heat
propagation within porous media and usually the analyses are carried out only in dependence of the water content (Giordano et al., 2013). Most of them are small-scale laboratory configurations, which barely allow comparing/ comparison of geoelectrical measurements on a laboratory
scale with ERT field data. To achieve real electrical conduc
-tivity values, by measuring on a small scale or with small
specimens, the electrical conductivity needs to be
calibrat-ed (Bai et al., 2013; Kaufhold et al., 2014). Due to the lack of a normalised specification (Giao et al., 2003; Giordano et al., 2013) and the different focus, all these approaches are in a different shape.
MATERIALS AND METHODS
Within this study a laboratory concept for measuring
electrical and thermal conductivity of soil in a
transfer-able way regarding in situ measurements was created. The measurements were carried out in dependence of the soil properties with the seemingly highest impact on electrical and thermal conductivity. Derived from the approxima
-tions made in Eqs (3)-(7) and the Eqs (8)-(9) the concerned properties are the water content and the bulk density. Based
on these outcomes within this study electrical
conducti-vity, thermal conducticonducti-vity, gravimetric and volumetric
water content, bulk density, and temperature of the ana -lysed soil material have been measured in dependence of
the water content and the bulk density. Additionally the granulometry was carried out with a subsample of the used soil material (Fig. 1).
A standardised concrete mixer (140 l, 26.6 RPM, 650 W) was used to ensure that the measured material is homoge
-neous. By using the mixer, a sufficient amount of material of different soil mixtures or grain sizes can be prepared and mixed with water to a precise saturation level. A commer
-cially available spray flask was used in order to add water disperse and widespread into the mixer. The mixed mate
-rial was put into a plastic box (EF 6320) with an internal dimension of 55.2x35.2x29.5 cm and a volume of 63.7 l. To generate EC values in the laboratory, which are compa
-rable with data measured in the field, boundary effects of the rim and the bottom of the box have to be avoided. Due to some first tests with small-scale devices and according
to Kaufhold et al. (2014) the volume of the testing material of around 50 l was determined to build up real half space conditions like in the field by avoiding boundary effects with the plastic test box. On the flattened surface of the mixed soil material, which is filled in the box, the meas -urements regarding the above mentioned soil parameters can be performed. For the EC measurements a four point
electrode configuration by using the Wenner array (Fig. 2) was compiled (Dahlin and Loke, 1998; Dahlin and Zhou, 2004; Okpoli, 2013).
The electrical conductivity was gained by the geoelec
-trical measurement device 4point light from the Lippmann Geophysikalische Messgeräte (LGM) Company. For the laboratory configuration a small device with a spacing of 5 cm and a penetration depth of the electrodes of 2 cm was defined as the most expedient solution. To avoid the men -tioned boundary effects, a small spacing was used and the geoelectrical device was positioned in the middle of the
soil surface inside the box to fulfil a minimum distance of 15 cm to each side. In order to cover more soil material by one measurement a spacing of 5 cm is used although a smaller spacing often is suggested for these small scale
laboratory devices (Kaufhold et al., 2014). The 2 cm pen
-etration depth of the electrode tips was selected because of
a guaranteed contact to the soil material even on a slightly uneven surface.
The thermal conductivity was observed with TR-1 probes of the thermal properties analyzer KD2 Pro device of the Decagon DevicesInc. (2016). These probes were posi
-tioned near the two current electrodes from the electrical conductivity device. The thermal conductivity presented in this study is always the average of the measurements deter
-mined by two TR-1 probes. The temperature was measured with the same device. Due to the volume of 50 l testing material it was practicable to insert the 10 cm TR-1 probe
of the KD2 Pro device without interference of the test box. The dimensions of the TR-1 sensor are in conformity to the specifications for the laboratory probe described in IEEE 442 ‘Guide for Soil Thermal Resistivity Measurements’ and in ASTM 5334 ‘Standard Test Method for Determination of Thermal Conductivity of Soil and Soft Rock by Thermal Needle Probe Procedure’ (Decagon Devices Inc., 2016).
The sampling and the determination of the bulk density was performed in accordance with DIN 18125_2 using a cut-ter cylinder. Due to the invasive way of sampling with the
cutter cylinder, expressed by destroying the surface of the
soil in the test box, it was used at the end of each meas
-urement cycle. Within the bulk density meas-urements the moisture content was defined by oven drying in accordance with DIN 18121. After one measurement cycle the bulk density was increased by the next pressure load. According to the classification for the bulk density (Table 1) of the German soil mapping instructions (Ad-hoc-AG-Boden,
2005) the measured values have been structured.
Within each saturation step the mentioned parameters were measured four times regarding the four consolida
-tion steps adjusted by four different pressure loads of 75, 1 000, 3 000, and 5 000 kg. These analyses were carried out for four bulk densities within each saturation step from approximately dry (related to the dead water content) to full saturated. The pressure load was added with a work
-shop press (max load 20 000 kg) after each measurement
cycle. At the end of each measurement cycle all measure-ment tools and probes have been removed to clear the soil
surface for the stamp of the press. The stamp has to cover the whole surface to guarantee an uniform distribution of
the pressure load.
Fig. 1. Grain size distribution analysis of the reference sample of the test site in Hameln.
Fig. 2. Wenner array: C – current electrode, P – potential electrode).
For the first attempt with this laboratory setup a silt loam soil mixture from a test site near Hameln (Lower Saxony, Germany) was used (Fig. 3). Within this study the set va-lues of the gravimetrical water content were 5, 7.5, 10, 12.5, 15, 17.5, 20, 22.5, and 25%. Hence, 9 different satura
-tion steps or rather 36 measurement cycles were performed.
Under the assumption that the soil particle density
(ρ0) is around 2.65 g cm-³, the porosity (Eq. (11)) and
the amount of saturated pore volume SP (Eq. (12)) can
be determined by including the measured bulk density ρd
(Andersland and Anderson, 1978) as well as the volumetric water content θW.
(11)
(12) To generate EC values comparable to other data, EC is
expressed at a reference temperature of 25°C (Eq. (13))
using a temperature conversion factor ƒt (Eq. (14)) (Corwin and Lesch, 2005; Sheets and Hendrickx, 1995):
(13)
(14)
RESULTS
The measurements with this laboratory setup (Table 2) were carried out until a grade of saturation in which no
further consolidation but only displacement of the soft soil
material was possible. As a result the determined amount of saturated pore volume within the last step of saturation was 94.9 and 96.9% (Table 2). This reflects an approximately full saturated status of the soil material. Due to the soft soil material within the last saturation step, no compaction could be achieved. Consequently, in the last saturation step of the set water content value of 25% mass. was neglected
in further investigations.
Within the correlations (Fig. 4) between the two types of conductivity and the two soil properties, water content and bulk density, there are significant dependencies. The water content has a major influence on the electrical con
-ductivity with R² = 0.93. With a correlation coefficient of R² = 0.72 the water content has a strong impact on the thermal conductivity, as well. Though the bulk density
seems to have the same impact on the thermal conducti-
vity (R² = 0.72) as the water content. In contrast, the influ -ence of the bulk density on the electrical conductivity
(R² = 0.52) is clearly less than the influence of the water content. However, it should be noted that a pressure load of 75 kg, which equates a load of 39.3 g cm-², does not reflect
natural soil consolidation conditions. At the test site, the
lowest value of bulk density of 1.38 g cm-³ (Table 3) was measured at the subsurface (depth of 10 cm) within this
silty material. All bulk densities, measured in the
labora-tory in the course of this first consolidation step (75 kg) are
beneath 1.21 g cm-³. According to the bulk density clas-sification (Ad-hoc-AG-Boden, 2005) most of the values measured in the field are ranging within ‘medium’ bulk densities, whereas the bulk densities of the first consolida
-tion step are almost all ‘very low’. If only the data of the three heavy pressure loads would have been used, the cor
-relation coefficients will become higher. With this update
the impact of the bulk density on the electrical conductivity
increases R² from 0.52 to 0.63 and also the influence of the water content on the thermal conductivity rises R² from 0.72 to 0.81.
Besides the bulk density other data was collected in the field within three 1.5 m deep test pits (Table 3). The
in-situ measured EC25 ranges from 0.0125 to 0.048 S m-1 for the profile of all three test pits. Simultaneously, the thermal conductivity was about 1.1 W m-1 K-1 directly at the sur-face and about 1.6-2.2 W m-1 K-1 from the subsurface until
a depth of 1.5 m. T a b l e 1. Classifcation of the bulk density ranges according to
the Ad-hoc-AG-Boden (2005)
Fig. 3. USDA soil textural triangle with the used soil mixture. Classification Bulk density(g cm-³)
Very low <1.2
Low 1.2-1.4
Medium 1.4-1.6
High 1.6-1.8
T a b l e 2. Measured soil parameters of the silty loam mixture within the laboratory setup
Saturation
step Pressure load EC25 conductivityThermal densityBulk contentWater Porosity Sat. pore volume Temperature
(%, mass) (kg) (S m-1) (W m-1 K-1) (g cm-3) (%, vol.) (°C)
5
75 0.003 0.19 1.18 8.40 55.51 15.13 18.72
1000 0.005 0.29 1.32 9.26 50.36 18.39 18.64
3000 0.007 0.31 1.34 8.60 49.36 17.42 18.59
5000 0.008 0.77 1.42 8.99 46.56 19.30 18.56
7.5
75 0.004 0.24 1.21 9.50 54.49 17.43 18.52
1000 0.008 0.68 1.33 9.52 49.71 19.15 18.35
3000 0.010 1.01 1.40 10.66 47.15 22.60 18.33
5000 0.012 1.18 1.40 11.23 47.14 23.83 18.34
10
75 0.007 0.41 1.15 12.20 56.57 21.57 19.21
1000 0.012 0.99 1.25 12.83 52.95 24.22 19.15
3000 0.015 1.08 1.43 14.36 45.98 31.22 19.03
5000 0.018 1.24 1.41 14.68 46.86 31.32 18.94
12.5
75 0.007 0.59 1.11 12.82 58.12 22.05 18.66
1000 0.015 1.11 1.35 15.33 49.10 31.21 18.60
3000 0.018 1.28 1.39 16.89 47.66 35.44 18.45
5000 0.020 1.44 1.47 18.34 44.62 41.11 18.59
15
75 0.008 0.57 1.19 13.75 55.00 25.00 18.71
1000 0.015 1.12 1.39 14.41 47.66 30.23 18.61
3000 0.023 1.46 1.45 15.83 45.14 35.06 18.62
5000 0.026 1.67 1.61 16.66 39.27 42.43 18.50
17.5
75 0.009 0.59 1.10 14.57 58.48 24.92 18.23
1000 0.020 1.24 1.41 18.55 46.62 39.78 18.05
3000 0.027 1.56 1.55 21.82 41.48 52.60 17.92
5000 0.029 1.70 1.60 21.01 39.63 53.02 17.81
20
75 0.020 0.81 1.11 19.62 58.08 33.77 17.02
1000 0.036 1.46 1.48 23.82 44.23 53.84 16.82
3000 0.045 1.74 1.55 28.93 41.67 69.43 16.88
5000 0.051 1.86 1.61 27.82 39.22 70.94 16.70
22.5
75 0.025 0.98 1.18 23.14 55.41 41.75 16.91
1000 0.051 1.74 1.46 29.20 45.02 64.86 16.74
3000 0.056 2.19 1.58 31.70 40.57 78.14 16.65
5000 0.058 2.25 1.69 30.86 36.40 84.78 16.60
25 75 0.058 1.95 1.55 39.32 41.40 94.97 18.03
Fig. 4. Water content in comparison with EC at 25°C (a), and thermal conductivity (b). Bulk density correlated to the EC at 25°C (c), and the thermal conductivity (d).
T a b l e 3. In-situ measured parameters of the silty loam soil which was used in the laboratory. These measurements were collected within three test pits. Because the values of the electrical conductivity are gained from two dimensional ERT measurements at the surface, there is no result for each depth available
EC25 conductivityThermal densityBulk content Water Porosity Sat. pore volume Temperature
(S m-1) (W m-1 K-1) (g cm-³) (%, vol.) (°C)
– 1.448 1.60 14.40 39.62 36.35 13.72
0.024 1.594 1.48 17.36 44.21 39.26 13.30
0.023 1.932 1.71 33.49 35.39 94.62 13.25
0.020 2.18 1.57 31.40 40.83 76.90 13.65
0.013 1.125 1.38 11.54 47.75 24.16 16.16
– 1.586 1.62 21.79 39.02 55.86 15.83
0.012 1.879 1.63 30.34 38.36 79.11 15.41
0.048 2.028 1.67 33.01 36.99 89.26 14.80
0.027 1.225 1.61 15.05 39.34 38.26 12.68
– 2.294 1.82 30.14 31.18 96.64 12.90
0.026 2.189 1.67 28.97 36.89 78.52 13.34
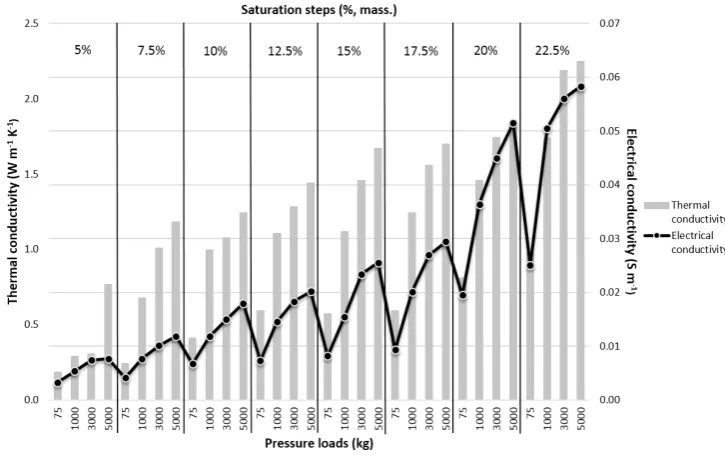
In Fig. 5 the interaction of the electrical and the thermal
conductivity as well as the different saturation steps and the four pressure loads is shown in one graph. It reveals that the rising water content and the raising consolida
-tion steps have a significant influence on the electrical and the thermal conductivity. Within the nearly uncon
-solidated pressure load of 75 kg of each saturation step, both conductivities stay at relatively low values, in con
-trast to the other consolidation steps. This gap between the low weight pressure load and the other three loads is explicit within higher saturation steps. The thermal con -ductivity at the highest possible saturation step does not
rise over 1 W m-1 K-1 at nearly unconsolidated conditions. On the other side, the thermal conductivity of the second saturation step reaches values above 1 W m-1 K-1 already with the influence of the higher pressure loads (3 000 and 5 000 kg). The electrical conductivity shows a similar sig
-nificant increase to higher saturation steps. The values of the unconsolidated soil material (first pressure load) only
reach around 0.025 S m-1, whereas the compacted material
reach approximately 0.06 S m-1. The difference within each conductivity between the more compacted three consoli
-dation steps (1 000, 3 000, and 5 000 kg) is less, but there is still a stepwise increase with incremental pressure load (Fig. 5). Focusing only on the water content the electri
-cal conductivity increases sharply within high saturation steps, between the set gravimetrical water content of 17.5 and 20%, respectively. Instead, the thermal conductivity
increases more linear.
The measured temperature inside the tested soil mate
-rial ranges between 16.51 and 19.25°C. For receiving the
EC25 values the resulting factors ƒt are ranging from 1.132
to 1.205. So regardless the varying temperature, the
cor-relations or rather the correlation coefficients (Fig. 4) of the
apparent EC would have been approximately the same. The measured bulk densities are provided within Fig. 4, where -as in Fig. 5 the pressure loads, created in the laboratory, are displayed. It has to be considered that identic pressure loads
within the incremental saturation steps are resulting in dif -ferent bulk densities because of a varying soil compaction
behavior inter alia due to an increasing water content.
DISCUSSION
After the classification of the bulk density according to Ad-hoc-AG-Boden (2005) the major proportion is in the ‘medium’ range. Only the bulk densities which were deter
-mined within the nearly unconsolidated soil material are in the ‘very low’ range. Within the condition of a ‘very low’ bulk density both conductivities are low, too. These results show how important soil compaction is especially after the removal and backfilling of soil material within projects like the installation of very shallow geothermal systems.
For the EC measurements a small device with a spacing of 5 cm was used. A smaller spacing which was used and
recommended by Kaufhold et al. (2014) was evolved for clay measurements only. The developed laboratory setup
had the intention to measure different kinds of soil
mate-rial with an unsusceptible configuration which can deal with a more practicable 2 cm electrode penetration depth.
Another reason for a slightly increased spacing is to get
a better average value within inhomogeneous materials. On the other side, the small device should still fit upon the vo-lume of 50 l without generating boundary effects.
The soil temperature was taken into account within the
temperature factor for the EC25. Due to a lack of real tem
-perature variations within the performed measurements no
impact of the temperature on the electrical or thermal
con-ductivity could have been identified although there should be an effect (Bai et al., 2013, Giordano et al., 2013). For
the thermal conductivity there are at least equations for unfrozen and frozen conditions (Kersten, 1949). Basically, within this case study only unfrozen conditions were taken
into consideration.
For very precise results regarding the EC values, the
penetration depth of the electrode tips as well as the spacing
should be considered by using the geometrical K-factor
cor-rection within Ohm law (15) (Kaufhold et al., 2014), where
R is the electrical resistivity, V is the voltage measured across the soil material and I is the current going through
the material. Due to the uniform spacing a, by using the
Wenner array at the surface of an infinite half space, the
geometrical K-factor is calculated like in Eq. (16):
, = I V K R (15) . 2 a
K = π (16)
According to Kaufhold et al. (2014), it seems that the
K-factor has little influence on the electrical resistivity using these small-scale devices with a spacing around 5 cm. In another study, regarding different penetration depths of
electrodes between 0.1 and 6 cm, the electrical conductivity
varies in such a small range that it is practically the same
(Giao et al., 2003). As a result the developed laboratory setup regarding the EC measurement device with a spac -ing of 5 cm and a penetration depth of 2 cm seems to be a practicable solution.
The correlation coefficients displayed in Fig. 5 reveal that the derivations, from Kersten (1949) for the thermal conductivity as well as the relationship from Rhoades et al.
(1999) for the electrical conductivity, are based at least on two soil properties which have significant influence regard
-ing both conductivities. Out of these two soil properties, expressed by bulk density and water content, the porosity and the grade of saturation can be determined (Eqs (11) and 12)). By considering only the water content and the bulk
density, four soil parameters have been included already,
also within the mentioned relationships from Kersten (1949) and Rhoades et al. (1999). Considering the meas
-ured results the bulk density and the water content seem to have a similar effect on the thermal conductivity. Whereas the water content has apparently a more dominant influ -ence on the electrical conductivity than the bulk density.
Although, the bulk density also has a significant influence on the electrical conductivity. However, there are diffe-rences within the significance of the influence of the water
content and the bulk density on the electrical and the
ther-mal conductivity. The impact of the water content on the
electrical conductivity seems higher than on the thermal
conductivity. That implies that the electrical conductivity is
not directly related to the thermal conductivity. It is still to clarify if this can be solved and described by a general
rela-tionship only depending on the grain size distribution like in Eq. (10) (Singh et al., 2001) or if more soil properties
should be included. To check the impact of the granu
-lometry within the context of this laboratory setup further investigations with different soil materials are in process of
planning.
To check the comparability between the in-situ measure -ments and the laboratory setup, the collected data especially the EC25 values should be in the same range. Within this study a comparison of the in-situ (Table 3) and the laborato
-ry measurements (Table 2) shows that the values are in the same range. Because of the relatively small scaled device
and the volume of 50 l testing material, the boundary effect on EC measurements is eliminated to a largest extent. Due to the minimized boundary effects the comparability of EC
measurements following the developed laboratory setup and in-situ field measurements is ensured.
With regard to the large volume of testing material
no extra calibration is needed and unnecessary errors can be avoided. Hence, the presented laboratory setup
pro-vides reliable statements and recommendations about field
conditions.
With the indicated laboratory setup soil properties such as bulk density, grain size distribution, moisture content,
and their effects on the electrical and thermal conductivity should be seen under the umbrella of a holistic approach.
Due to the laboratory conditions it is possible to bring the different soil properties in one context which enables more
reliable recommendations on their interactions and their
possible influence within the soil body.
CONCLUSIONS
1. The laboratory setup provides the possibility to receive results comparable to in-situ field measurements.
2. Within the developed laboratory setup laboratory
standard test methods are used for evaluating thermal
con-ductivity, bulk density, and water content. By integrating
the small-scale geoelectrical device into the mentioned laboratory setup it is also possible to generate correspond-ing electrical resistivity values.
3. The water content as well as the bulk density has a sig
-nificant influence on the electrical and thermal conductivity. 4. The water content has a more dominant influence on
the electrical conductivity than the bulk density.
5. The impact on the thermal conductivity of the water
Ewing R.P. and Hunt A.G., 2006. Dependence of the electrical conductivity on saturation in real porous media. Vadose Zone J., 5, 731-741.
Farouki O.T., 1981. Thermal properties of soils (No. CRREL-MONO-81-1). Cold regions research and engineering lab., Hanover NH.
Friedman S.P., 2005. Soil properties influencing apparent electri-cal conductivity: a review. Computers and Electronics in Agriculture, 46, 45-70.
Giao P.H., Chung S.G., Kim D.Y., and Tanaka H., 2003. Electric imaging and laboratory resistivity testing for geo-technical investigation of Pusan clay deposits. J. Applied Geophysics, 52, 157-175.
Giordano N., Firmbach L., Comina C., Dietrich P., Mandrone G., and Vienken T., 2013. Laboratory scale electrical resis-tivity measurements to monitor the heat propagation within porous media for low enthalpy geothermal applications. Proc. Conf. GNGTS, November 19-21, Trieste, Italy. Grisso R., Alley M., Holshouser D., and Thomason W., 2009.
Precision farming tools: soil electrical conductivity, virgi- nia cooperative extension. Publication, 442-508, 1-6. Hümann M., Schüler G., Müller C., Schneider R., Johst M.,
and Caspari T., 2011. Identification of runoff processes – The impact of different forest types and soil properties on runoff formation and floods. J. Hydrology, 409, 637-649. Kaufhold S., Grissemann C., Dohrmann R., Klinkenberg M.,
and Decher A., 2014. Comparison of three small-scale devices for the investigation of the electrical conductivity/ resistivity of swelling and other clays. Clays and Clay Minerals, 62(1), 1-12.
Kersten M.S., 1949. Thermal properties of soils. Bulletin of the University of Minnesota, 28, 1-227.
Liu X., Jia Y., Zheng J., Shan H., and Li H., 2013. Field and laboratory resistivity monitoring of sediment consolidation in China Yellow River estuary. Engineering Geology, 164, 77-85.
Logsdon S.D., Green T.R., Bonta J.V., Seyfried M.S., and Evett S.R., 2010. Comparison of electrical and thermal conductivities for soils from five states. Soil Science, 175, 573-578.
Loke M.H., Chambers J.E., Rucker D.F., Kuras O., and Wilkinson P.B., 2013. Recent developments in the direct-current geoelectrical imaging method. J. Appl. Geophysics, 95, 135-156.
Malehmir A., Socco L.V., Bastani M., Krawczyk C.M., Pfaffhuber A.A., Miller R.D., Maurer H., Frauenfelder R., Suto K., Bazin S., Merz K., and Dahlin T., 2016. Near-surface geophysical characterization of areas prone to natural hazards: A Review of the current and perspective on the future. Advances in Geophysics, 57, 51-146.
Okpoli C.C., 2013. Sensitivity and resolution capacity of elec-trode configurations. Int. J. Geophysics, 1-12.
Rhoades J.D., Chanduvi F., and Lesch S., 1999. Soil salinity assessment; Methods and interpretation of electrical con-ductivity measurements. FAO Irrigation and Drainage paper, 57, 1-150.
Rhoades J.D., Raats P.A.C., and Prather R.J., 1976. Effects of liquid-phase electrical conductivity, water content, and sur-face conductivity on bulk soil electrical conductivity. Soil Sci. Soc. America J., 40, 651-655.
6. Nearly unconsolidated soil material has a signifi -cantly reduced electrical and thermal conductivity. So, the
compaction of the soil material within the backfilling pro
-cess is essential for very shallow geothermal projects. 7. In the context of this laboratory setup further inves
-tigations regarding the dependence between the electrical and the thermal resistivity with different soil materials have
to be performed.
ACKNOWLEDGEMENTS
We thank our colleagues from the partners, tewag;
Technologie – Erdwärmeanlagen – Umweltschutz GmbH, and WFS – Elektrotechnik GmbH, of the GeoSurf project, who provided their expertise that assisted the development
of the laboratory setup and the progress of the research. Conflict of interest: The Authors do not declare con
-flict of interest.
REFERENCES
Abu-Hamdeh N.H., 2003. Thermal properties of soils as affected by density and water content. Biosystems Engineering, 86(1), 97-102.
Abu-Hamdeh N.H. and Reeder R.C., 2000. Soil thermal con-ductivity effects of density, moisture, salt concentration, and organic matter. Soil Science Soc. America J., 64(4), 1285-1290.
Ad-hoc-AG-Boden, 2005. Bodenkundliche Kartieranleitung, KA5. Schweizerbart’Sche Verlagsbuchhandlung, Hanno- ver, Germany.
Andersland O.B. and Anderson D.M., 1978. Geotechnical Engineering for cold Regions. McGraw-Hill, New York. Bai W., Kong L., and Guo A., 2013. Effects of physical
proper-ties on electrical conductivity of compacted lateritic soil. J. Rock Mechanics Geotechnical Eng., 5, 406-411. Bertermann D., Klug H., and Morper-Busch L., 2015. A
pan-European planning basis for estimating the very shallow geothermal energy potentials. Renewable Energy, 75, 335-347.
Bertermann D., Klug H., Morper-Busch L., and Bialas C., 2014. Modelling vSGPs (very shallow geothermal poten-tials) in selected CSAs (case study areas). Energy, 71, 226-244.
Corwin D.L. and Lesch S.M., 2005. Apparent soil electrical con-ductivity measurements in agriculture. Computers and Electronics in Agriculture, 46, 11-43.
Dahlin T. and Loke M.H., 1998. Resolution of 2D Wenner resis-tivity imaging as assessed by numerical modelling. Applied Geophysics, 38, 237-249.
Dahlin T. and Zhou B., 2004. A numerical comparison of 2D resistivity imaging with 10 electrode arrays. Geophysical Prospecting, 52, 379-398.
Decagon Devices, Inc., 2016. KD2 Pro Thermal Properties Analyzer - Operator’s Manual, Version February 29, 1-67. Dehner U., 2007. Bestimmung der thermischen Eigenschaften
Samouelian A., Cousin I., Tabbagh A., Bruand A., and Richard G., 2005. Electrical resistivity survey in soil science: a re- view. Soil Till. Res., 83(2), 173-193.
Sangati M., Borga M., Rabuffetti D., and Bechini R., 2009. Influence of rainfall and soil properties spatial aggregation on extreme flash flood response modelling: An evaluation based on the Sesia river basin, North Western Italy. Advances in Water Resources, 32, 1090-1106.
Saxton K.E. and Rawls W.J., 2006. Soil water characteristic estimates by texture and organic matter for hydrologic solu-tions. Soil Sci. Soc. America J., 70, 1569-1578.
Sheets K.R. and Hendrickx J.M.H., 1995. Noninvasive soil water content measurement using electromagnetic induc-tion. Water Resources Res., 31(10), 2401-2409.
Singh D.N., Kuriyan S.J., and Manthena K.C., 2001. A genera- lized relationship between soil electrical and thermal resis-tivities. Experimental Thermal Fluid Sci., 25, 175-181. Sreedeep S., Reshma A.C., and Singh D.N., 2005. Generalized