AVAILABILITY ANALYSIS OF CHEMICALS FOR WATER
TREATMENT: AN APPLICATION TO EDO AND ANAMBRA
STATE WATER UTILITIES BOARDS
B.U. ANYATA and OBIASOR, C. Department of Civil Engineering, University of Benin, Benin City, Nigeria
ABSTRACT
In most countries, chemicals are generally recognized as being vital in the production of potable water and will normally be required in large quantities in water treatment facilitates. Although some developing countries have local chemical production capabilities, the majority of them still have to import the chemicals from industrialized countries. This paper considers the shipment of regular supplies of large quantities of chemicals used in treating water to potable standard in a developing country. A model to reduce the shortage of chemicals for water treatment while minimizing the direct costs of supplying the chemicals for water treatment while minimizing the direct costs of supplying the contractors or manufacturers is represented as a network composed of interconnected geographical regions. Edo and Anambra States are used as case studies. Objectives are achieved considering the uncertainty in future supply of chemicals for water treatment in Nigeria. The time horizon of the model is between 1 and 5 years. Estimates of future demands and supplies of chemicals and the associated costs are used as endogenous and exogenous parameters in the model. The model should assist water utility decision makers during current and subsequent periods in order to determine an optimal policy for uninterrupted supply of chemicals required at the treatment plants at minimum cost
.
KEYWORDS: Chemical supply; mathematical model; optimal ordering policy; holding costs; chemical shortages.
1.0 INTRODUCTION
As a result of the economic situation in the country, every organization is interested in ways of minimizing costs and optimizing productivity. Being a service industry, the water supply industry is particularly affected by constraints in funds. Before now when conditions were better, problems often arose with the supply of chemicals for water treatment. These problems were due to lack of funds and were exacerbated by poor ordering and storage policies for chemicals. This paper examines ways of tackling the ordering and storage problems.
In water supply industries, availability
of chemicals is one of the most important factors affecting the supply of potable and germ-free water to the public. In recent times, the need for water is growing rapidly as more industries and water utility ventures are being started in Nigeria, and also there is an increased awareness of health hazards and diseases arising from improper treatment of water. There is therefore a great need for adequate treatment of water to minimize or eradicate completely the health hazards and water- borne diseases that result from poor treatment of drinking water.
The calls for increased demand of water treatment chemicals.
This model to be formulated is based on the need to reduce shortages of chemicals in the water supply industries while minimizing direct cost of supplying chemicals.
The chemicals service area supplied by a single contractor/contractors or manufacturers is represented as a network composed of interconnected geographical regions. A geographical region could be one or more states, parts of a state depending on the amount and varieties of chemicals required by that region and on the service area of the contractor or manufacturer [1 ].
(1) Regular sources e.g. from Drury Industries Limited in Ogun State, manufacturers of aluminum sulphate (A12S04) (commonly known as Alum).
Another source of Alum is Federal Superphosphate and Fertilizer Company Limited, Kaduna, that manufactures Alum which is utilized in fertilizer production as well as supply to some water industries. Slaked lime or hydrated lime is also produced locally. Some local sources are the Delta Steel Company, Aladja, Warri which produces Ca(OH)2 (an essential chemical for
refining iron ore) as well as supplying some to water industries and Higerman Industrial Promotions Limited, Kaduna which manufactures Ca(COH)2 solely for supply purposes.
(2) Non-regular sources (emergency purchases) usually alum and Ca(OH)2
obtained from local dealers in a relatively small quantity.
The model takes into consideration the variability of weather conditions and its effects on the demand for chemicals. Forecasts of future weather conditions are updated during the model planning period. Also, the optimal use of chemicals is determined at the time the forecasts are
updated.
The optimal storage quantities at the beginning of each time period and the consequences of contracting for additional storage facilities on the shortages of chemicals are derived using the model The planning strategy is to plan the availability and utilization of chemicals based on forecasted future periods. The optimal usage should be re-calculated for future time periods at several computational states honouring the orders placed during previous time periods.
Factors contributing to the chemical shortages in water supply industries and Water Boards include the following:
(1) Economy due to the state of economy of the country, some water. supply boards or industries are not able to raise enough funds when it is time to order for these chemicals. They therefore resort to procurement of the chemicals on credit and these could contribute in delaying the supply the more.
(2) Poor Forecasts due to inadequate Data
placing order for chemicals.
(3) Ordering Time: The problem will not lie on inadequate funds or inaccurate forecast but lies on the time of ordering; orders for chemicals may be placed too late in which case the stock will be exhausted before the arrival of the new chemicals. This leads to chemical shortages, or the order may be placed too early, as a result the supply arrives when there is still enough chemicals in which case there may arise storage problem which may lead to damage or wasting of some of the chemicals due to improper storage.
The objectives of the work are as follows: (1) To analyze the causes of shortages in
water supply industries.
(2) To derive a model by which forecast of chemicals usage by water utilities should be based so as to reduce shortages.
(3) To evaluate the model using Water Boards of Edo and Anambra States as case studies.
2.0 CHEMICAL AVAILABILITY MODEL
2.1 Chemical Utility Board Model under Uncertainty in Demand
The purpose of this model is to reduce shortage of chemical while minimizing the costs of supplying chemicals to water treatment plants. Considering the economic condition in the country and the uncertainty in future and in demand of chemicals these objectives can be achieved.
Under this model, consideration is restricted to four chemicals: namely aluminum sulphate (alum), Al2S04, hydrated
lime (calcium hydroxide), Ca(OH)2' chlorine
(liquefied) and poly-electrolyte, Alum and hydrated lime can now be obtained within the country but liquefied chlorine and poly-electrolyte are still being imported by water utility boards for treatment purposes. Edo and Anambra States Water Boards are used as case studies.
Obviously, for a chemical supply company, massive priorities should be placed on the supply of chemicals to water utility boards in different geographical areas required within its service area.
Assuming that chemical suppliers allocate approximately a known percentage
(g,k,t) to water utility boards in geographical region k, during time period t, then:(g,k,t) = 1 …….(2.1) , ,1
ktg
Model Construction
Figure 2.1 above describes the flow of chemicals from the suppliers to the consumers in a service area supplied to a single water utility board during a single time period. Only chemicals that are supplied to the water boards are considered.
Variables of the model are: X(g,t) = quantity of chemicals to be allocated from storage facility of water utility g during time period t (tonnes per month/week). Y (i,g,t,t + u(i,t) = quantity of chemical ordered by water utility g from source i during time period t and to be obtained and utilized by the utility board during time period t = u (i,t) (tonnes per month/ week). Z(i,g,t + u) (i, t) = quantities of chemical ordered by water utility g from source i during time period t, and to be obtained and stored during time period t + u (i, t) (tonnes per month). Here, i.e. (a, b, c) and i is an element of a, b and c, a, b and c are indices representing regular sources, non-regular sources and future local sources respectively. A known lead time (i, t) is assumed for a given source i and a given time period t)
Let P(r) be problem of finding the optimal ordering policy based on forecasts of the demand for chemicals during the end of time period r for demands during succeeding periods. This problem is formulated as a multi-objective linear programming problem as follows:
2.2 Problem P(r) Constraints
The following constraints apply to the problem P(r).
1. Demand Constraints: The demand constraint for utility board, in geographical region (k) in the service area supplied by a single supplies (s) during time period (t) is given by
( ) [ ] ( )
( ) (
( ))
( ) ( ) … (2.2)
where D (r, k, t) is the total demand for chemicals per month during time period t, by utility boards in geographical region which was forecast at the end of time period r, r < t.
The values Y (i, g, j,t) apply for periods j, during which an order is placed, so that it will be obtained during time period t, considering a known lead time for the respective supplier. These are known values at the time that problem P(r) is solved. They were solved by solving the problems P(r-l), P(r-) ..., P(r).
The variables Y(i,g,l, t+ u(i,t) and Z (i,g,t, t+u (i, t) are considered only for periods t, for which t + u (i, t) < M apply M = number of periods in the time horizon of the model.
2.2.1 Material Balance Equation
The material balance equation relates inventory variables to procurement variables. These equations are:
( ) ( )
( ) ( )
( ) ( ( ) ( )]
where, I(t) = total amount of chemical (tonnes) storage facility of water utility g, at the end of period t, after satisfying the requirements in period t.
T(t) = Length of time period t (months) The inventory I® at the end of time period r is given by:
( )
( ) ( ) [ ( ) ( )] …. (2.4)
Storage Constraints:
Let V (g, t) be the total amount of chemical storage capacity of water utility g at the beginning of time period t. The storage capacity constraints are:
( ) [ ( )
( ) ( ( )]
( )
The summation terms represent the net change of the quantity of chemicals in storage during the first e months of time period t. The maximum flow out of a storage facility during the eth month of time period t must not exceed the quantity of chemicals in the storage facility at the end of the (e-t)th month.
The associated flow constraints are ( )
( )
[ ( )
( ) ( ( )] ( )
( )
Let Fl (g) be the maximum possible quantity of chemicals used per day by water utility (g).
The daily constraints usage rates are as follows:
[ ( )
( ) ( ( )] ( )
for all time periods t > r.
During June, July, August and September, the demand for chemicals is much higher than during the dry periods. Therefore, more chemicals will be available for storage.
2.2.2 Objective Functions
The following objectives functions are
considered 0(1): to minimize expected total shortage of chemicals in a service area supplied by water utility (g) for all periods following r. The objective function is: ( )
( ) ( ) ( )
( ) ( ( )) ( )]
…. (2.8)
0(2). To minimize expected cost of chemicals of a given type say i, (direct cost of purchasing chemical of type I) and the holding costs to the water utilities).
The minimization of the sum of the direct cost of chemicals of type i and the storage holding cost are desired. The cost of chemicals of type i to the treatment plants will include in addition to these components, a fixed regulated price that is different for different types of chemicals.
Therefore, the total cost of chemicals for the water treatment plants will be minimized by minimizing the sum of the direct and storage holding costs of chemical of type i to the water utility (1).
Let W(g,r), be the total expected sum of direct cost and storage holding cost of chemical type i to the water utility g, for periods after period r. The objective function 0 is
) ) ( ) ( ) [ ( ( )]
( ( ) ) ( ) ( ) …. (2.9)
( ) = cost (I time) of purchasing chemical of type L from source i by water utility g during time period t.
to period t + 1 in water utility g's storage facility.
2.2 Solution of the Multi-objective Problem
Since objective (01) and (02) are conflicting and also non-commensurable, in order to solve the problem with these two objective functions, parametric values are assigned to the expected total shortage of chemical of type 1. This will change objective (01) into a parametric constraint. The linear programming problem is then solved for different values of the parametric constraint for which the problem will yield a feasible solution. The optimal solution to the multi- objective problem will be the least cost solution for which the expected total shortage of chemicals is the smallest.
Planning Strategy
The strategy for purchasing and storage is as follows:
(1) Problem P (O), i.e. p at r = 0 dissolved with expected demands calculated prior to the beginning of the seasonal cycle.
(2) The future purchasing and storage policies are updated by solving problems P(r) for r = 1.... M - I, with expected future demands re- calculated at the end of time periods 1, 2.... M-l, respectively.
Orders that were placed in time periods preceding r, are taken into consideration. A flow chart describing the dynamics of the planning strategy is given in Figure 2.2.
3.0 ANALYSIS OF AND DISCUSSIONS OF RESULTS
The model is tested with data collected from Anambra State Water Corporation and Edo State Public Utilities Board. The average purchase cost and the average quantity of chemicals ordered normally for a minimum of two years are shown in Table 3.1. However, the quantity for one year is used here for analysis.
A design for the total demand of chemical required in each of the States is carried out and the total demand D(r,k,t) for the state per capita is determined and correspondingly that for the whole population is determined. However, the utilization rate for water treatment chemicals at Ikpoba Dam project is used to project the amount of chemical required for treating a given volume of water[6]. The holding and transportation costs are taken into consideration.
The minimum average direct cost of hydrated lime is taken and analyzed
accordingly for illustration. It should be noted that the amount of chemical utilized is based on the attainment of accepted WHO Water Quality Standard [2-4]
Use 1850 tonnes = total demand of
Hydrated lime
amount of other chemicals used per week = 450 25 = 11250kg
amount used per year = 11250 365 102 tonnes
= 585 tonnes
substituting in the formula for the Objective Functions developed and tabulating.
Recall
( ) ( ) ( )
( )
( ) ( ( )) ( )] …(3.1)
Table 3.1: Yearly consumption and cost for Edo State Urban Water Board, Benin City [5]
Chemical type Yearly Consumption (metric tonnes)
Cost per tonne N
Total cost per N
Liquid chlorine 28 160,000.00 4,480,000.00
Alum 2,200 33,000.00 72,600.000.00
Poly-eletrolyte 10 720,000.00 7,200,000.00
Hydrated lime 1,200 21,000.00 25,200,000.00
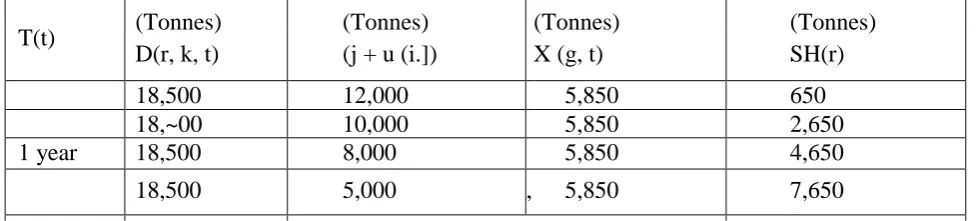
Table 3.2: Minimum cost of hydrated lime as a function of the variables
T(t) (Tonnes) D(r, k, t)
(Tonnes) (j + u (i.])
(Tonnes) X (g, t)
(Tonnes) SH(r)
18,500 12,000 5,850 650
18,~00 10,000 5,850 2,650
1 year 18,500 8,000 5,850 4,650
18,500 5,000 , 5,850 7,650
The second objective function is given by
Min W (r,g) = T(t) C(r,t)[Yt + u(i,j) +Z t + u(I,j))]+g(g,t)I(t)
….(3.2) where W(r, y) = total average expected sum of direct cost and storage holding cost. The transportation cost per tonne is N5, 000.00 [5, 6]
Holding cost = 13% of the original cost per year. Cost of 1 tonne of hydrated lime = N21, 000.00.
Table 3.3: Minimum cost of Hydrated Lime as a Function of the Variables C (r,t) N Yi+u(I,j) Zi+u(I,j) g(N) I
21,000
12,000 12,000 2,060 12,000
10,000 10,000 1,800 10,000
8,000 8,000 1,540 8,000
5,000 5,000 1,150 5,000
(Z + Y) C(Z + Y)N GL(N) W (r, g)
24,000 5.04 x 10⁷ 2.472 X 10⁶ 5.29 X 10⁷
20,000 4.20 X 10⁷ 1.80 X 10⁶ 4.30 x10⁷
16,000 3.36 x 10⁷ 1.23 X 10⁶ 3,48 X 10⁷
10,000 2.10 X 10⁷ 5.75 X 10⁶ 2.16 X 10⁷
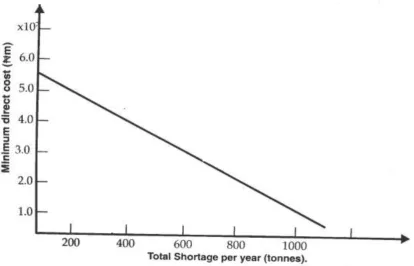
From Fig. 3.1, it can be seen that the minimum average cost of hydrated lime decreases with increasing demand of total annual shortage. It is here that it also decreases with increasing storage capacity as this invariably reduces the holding cost when the storage capacity is increased. It attains a maximum at which further increase or storage capacity will not decrease the minimum average direct cost of hydrated lime as a function of the total annual shortage (Fig. 3.1) is approximately linear.
4.0 CONCLUSIONS
The use of chemicals by Utility Boards and water industries varies strongly with the weather and seasons which cause irregular demand and difficulty in prediction. Therefore, it is necessary to co-ordinate the approximate steady supply with the extremely variable daily and seasonal requirements by storing chemicals when demand is low and removing it from storage when demand is high [7-11].
Re-order level has to provide enough time which will make it possible for fresh stock to get to the user's department before an out-of-stock situation arises. There are three main levels tha t are required to be set: (1) Minimum level;
(2) Re-order level; (3) Maximum level.
In achieving the minimum level, one has to take into account the consumption rate and project the quantity and quality of a given item that will cover a certain period. The re-order level is between the minimum and the maximum. In achieving this, the lead-time (the time taken by the goods to arrive to the user) is taken into account. The maximum level depends on some variable factors such as:
(i) Availability of funds;
(ii) Quality and durability of the chemicals; (iii) Storage facility capacity limitation;
(iv) Firm's or user's policy.
Chemicals like alum and hydrated lime have better quality and longer durability. Compared to poly-electrolytes and liquid chlorine, they can be stored for up to 2-3 years without losing their quality. For chlorine, there could be cases of leakages when stored for a long time as a result of the aging of the cylinder. Its storage is therefore a function of the durability of the cylinder in which it is placed.
Hydrated lime has a re-order level of one month; the imported ones like chlorine and poly-electrolyte have re- order levels of between 3-6 months.
Storage costs depend on the nature of the chemicals which should thus be stored in a well-ventilated, secured warehouse with the storage pattern depending on the goods movement which is dictated by the user's ability, i.e., storage of liquid chlorine should be done conveniently at the user's point.
The sequentially adaptive approach for obtaining optimal purchasing and storage policies developed in this work, should improve the control of chemical procurement and usage by water industries which will result in reducing the cost of water to the consumer.
4.2 RECOMMENDATIONS
Having studied some of the causes of chemical shortages in the water utility industry, the following recommendations are deemed necessary to improve the functioning of the water utility Boards.
(1) Government should encourage the production of these essential chemicals locally so as to remove the problem posed by giving to import some of the chemicals and the consequent delays that could follow.
(2) A procedure must be established to procure an adequate supply of the required chemicals.
maintain and protect the stock of materials after they have been placed in inventory so as to minimize damage. (4) Improved storage facility with adequate
storage capacity should be provided by the water industries so as to make it possible for the storage of adequate quantities of chemicals.
LIMITATIONS OF WORK
(1) The holding cost of 13% of the original cost as well as the ₦5,000.00 transportation fare per tonne assumed are not sacrosanct and can be increased in accord with the actual inflation rate in the economy.
REFERENCES
1. Levery, R.R and Burton, V.D. A Natural Gas Flow under Uncertainty Operations Research, Vol. 26, No.6, pp. 1360-1374 (1974).
2. Reid, F. Drinking Water Quality Regulation: Measuring, Monitoring and Managing Water and Sewage Works, (1971).
3. Adeluyi, O.Y., Osibanjo, O. and Ajayi, S.O. Pollution Studies of Nigerian Rivers III Baseline Data on River Niger Basin at Ajaokuta Before the Commencement of production (1982). 4. Steel, E.W. & McGhee, G. Water
Supply and Sewage (6th edition), McGraw-Hill Book Co., New York, (1976).
5. Private Communications, Anambra State Water Corporation, Enugu (1994).
6. Private Communications, Edo State Public Utilities Board, Ikpoba Dam, Benin City (1994).
7. Bazer-Bachi, A, Puech-Coste, E. Ben-Aim, R, and Probst, J.L., Mathematical Modelling of Optimum Coagulant Dosage in Water Treatment Plants Revue Des Sciences L' eau, Vol. 3, pp. 377-397 (1990).
8. Ratnaweera, H. and Blom, H., Optimization of Coagulation Dosage Using real-time Models Selective to Instrumentation Error. Water Supply Journal, Vol. 13, Nos. 3-4, pp. 285-289, (1995).
9. Jun, H, Lee, Y., Lee, B., and Knappe, D., Effectiveness of Coagulants and Coagulant Aids for the removal of Filter-clogging, Synedra Aqua Journal, Vol. 50, no. 3, June, pp. 135-148 (2001).
10. Hall, T. and Croll, B, The UK Approach to Cryptosporidium Control in Water Treatment. AWWA Water Quality Technology Conference, (1996).
11. Bache, D.H., Rasool, E, Johnson, C. and McGilligan, F.J., Temperature and Coagulanta Control in the Sweep Floc Domain. Aqua Journal, Vol. 45, No.4, pp.195- 206, August (1996).
12. Revelle, C. and Church, R
Environmental Engineering Ch. 4, pp. 70-99 Mcgraw Hill, (1985)..