VERIFICATION OF THE MODEL OF PREDISPOSITION IN TRIATHLON –
STRUCTURAL MODEL OF CONFIRMATIVE FACTOR ANALYSIS
Lenka Kovářová, Karel Kovář
Faculty of Physical Education and Sport, Charles University, Prague, Czech Republic
Submitted in August, 2011
BACKGROUND: The triathlon is a combination of three diff erent types of sport – swimming, cycling, and running. Each of these requires diff erent top level predispositions and complex approach to talent selection is a rather diffi cult process. Attempts to identify assumptions in the triathlon have so far been specifi c and focused only on some groups of predispositions (physiology, motor tests, and psychology). The latest studies missed the structural approach and were based on determinants of sport performance, theory of sports training and expert assessment.
OBJECTIVE: The aim of our study was to verify the model of predisposition in the short triathlon for talent as-sessment of young male athletes age 17–20 years.
METHODS: The research sample consisted of 55 top level triathletes – men, who were included in the Government supported sports talent programme in the Czech Republic at the age of 17–20 years. We used a confi rmative factor analysis (FA) and Path diagram to verify the model, which allow us to explain mutual relationships among observed variables. For statistical data processing we used a structure equating modeling (SEM) by software Lisrel L88.
RESULTS: The study confi rms best structural model for talent selection in triathlon at the age of 17–20 years old men, which composed seventeen indicators (tests) and explained 91% of all cross-correlations (Goodness of Fit Index /GFI/ 0.91, Root Mean Square Residual /RMSR/ 0.13). Tests for predispositions in triathlons were grouped into fi ve items, three motor predispositions (swimming, cycling and running skills), aerobic and psychological predispositions. Aerobic predispositions showed the highest importance to the assumptions to the general factor (1.00; 0). Running predispositions were measured as a very signifi cant factor (–0.85; 0.28) which confi rms importance of this critical stage of the race. Lower factor weight showed clusters of swimming (–0.61; 0.63) and cycling (0.53; 0.72) predisposi-tions. The psychological predispositions were found in the lowest eff ect (0.36; 0.87).
CONCLUSIONS: We confi rm predispositions and tests for measurement of its level for top level male triathletes in the junior category. The model is in practice today in the Czech Republic, where we used the test standards for dividing Government support of athletic talent.
Keywords: Top level sport, talents assessment, talent selection, endurance in sport, sport diagnostics, structure equating modelling.
INTRODUCTION
The quality system of talent selection is a primary condition for eff ective management of sport training. Se-lection of talents is therefore based on a multi-stage prin-ciple and respects developmental stages of an individual. With age and higher performance there appear specifi c predispositions and skills. Zháněl and Lehnert (2010) in this context, state that the relationship between the level of specifi c athletic predispositions and sport per-formance is higher in simple, individual, closed types of sports (e. g. fi eld sports), while in so called open sports (especially team sports) these relationships are very low (Roth & Willimczik, 1999). Researches in many coun-tries fi rstly focused on the area of performance predispo-sitions or motor abilities. In the nineties, physiological, psychological and social factors started to be gradually implemented into trends of sport talent identifi cation to
various extents. The system of sport talent selection was based on a similar process in most countries. Models of these systems developed processes consisting of three successive steps. Firstly, they identifi ed indicators pre-dicting sport performance then tried to fi nd the tools for diff erentiating top future athletes from average ones and fi nally they identifi ed the model of predispositions by means of setting standards of performance in individual performance predictors (Ko et al., 2003).
Apart from the first stage of the selection, when we usually only distinguish children talented for non-specifi c sport activity, in other stages it is important to distinguish predispositions of an athlete and the state of fi tness, because the individual has already undergone some specifi c sport training and incorrect assessment may appear (Kovář, 1974).
cy-cling and 10 km running. The triathlon is a combination of three diff erent types of human locomotion and each of these disciplines requires diff erent predispositions although performance in each of the components is determined by aerobic predispositions.
The problem of identifying the assumptions we see in difficult measurability of performance in a short (drafting) triathlon. Although it is a sport that is evalu-ated over time, the possibility of drafting in all its parts, however, disables the individual analysis of individual parts and the possibility of comparing the performance of the race is unrealistic (incorrect track length, eleva-tion, weather, the level of the fi eld) (Kovářová, Jurič, & Kovář, 2012). Performance in triathlon is rather a la-tent indicator than a manifest variable and its analysis is even more diffi cult.
An important note is that the importance of indi-vidual components is not equally represented in the overall performance. If we analyze short distance tri-athlon races in detail, we can see that 15% of total time is represented by swimming, 55% by cycling and 29% by running (Landers, Blanksby, Ackland, & Monson, 2008). However, it is not a simple sum but one disci-pline follows another where an individual does not have the chance to succeed against the peloton in the swim-ming and cycling part of the race despite an athlete’s better individual predispositions for these disciplines. On the contrary, the running part as a fi nal discipline often becomes crucial (Fröhlich, Klein, Pieter, Emrich, & Gießing, 2008). Diff erences in athletes’ times after swimming (and cycling) are minimal; however, the ath-lete’s attempt to stay in touch with other racers requires diff erent eff ort regarding individual performance. These diff erences are then fully apparent in the fi nal disci-pline – running (Peeling, Bishop, & Landers, 2005). In this sense, even the psychological state of an athlete may be decisive.
METHODOLOGY OF TALENT SELECTION FOR SHORT TRIATHLON
Since the very beginning of the triathlon, many authors have dealt with the issue of prediction perfor-mance (Burke & Jin, 1996; Sleivert & Rowlands, 2000; Hue, 2003; Van Schuylenbergh, Vanden Eynde, & Hes-pel, 2004; Zemanová & Kovář, 2009), individual so-lution of issue of talent selection for triathletes in the literature, however, is still missing.
The researchers focused on short-term performance prediction in several fi elds – anthropometric, morpho-logic and aerobic predispositions, swimming, running, cycling and psychological. The model of identifi cation of predispositions for future performance in short triath-lon thus includes several fi elds that must be taken into account during its development.
In the fi eld of anthropometrics, we do not register a clear consensus in research focused on this issue due to diff erent anthropometric predispositions, moreover, it appears that triathlon athletes form a specifi c soma-totype (1.96–4.35–3.14) between swimmers, cyclers and middle and long distance runners (Ackland, Blanksby, Landers, & Smith, 1998). International studies coincide in the parameter of body fat % as an indicator of future performance (Tittle & Wutscherk, 1988; Atwater, 1990; Landers, Blanksby, Ackland, & Smith, 2000); Czech studies agree further on the parameter of extracellular mass and body cell mass (ECM/BCM) – parameter indicative of the qualitative characteristics of skeletal muscle (Talluri, 1998).
However, there is uniformity in the fi eld of aero-bic predispositions. Authors suggest VO2max related to body weight and % VO2max at anaerobic threshold (AT) as two primary indicators of performance predic-tion (Schneider, Lacroix, Atkinson, Troped, & Pollack, 1990; Butts & McLean, 1991; Zhou, Robson, King, & Davie, 1997; Millet, Dreano, & Bentley, 2003; Su-riano & Bishop, 2010). Some studies also mention the possibility of performance prediction by means of maxi-mum values of pulmonary ventilation.
For future performance prediction by means of motor tests, studies usually suggest laboratory tests for the sake of objectivity of data gained (OʼToole, Doug-las, & Hiller, 1989; Neumann, 1993; Hue, Le Gallais, Chollet, Boussana, & Préfaut, 2000; Bentley, Millet, Vleck, & McNaugthon, 2002). The most commonly used is a treadmill or cycling ergometer test up to vita maximum, further speed tests at AT, less on aerobic threshold (Schabort, Killian, St Clair Gibson, Hawley, & Noakes, 2000; Hue, 2003; Van Schuylenbergh, Van-den Eynde, & Hespel, 2004). To analyse fi eld motor tests in swimming in junior categories, tests in a swim-ming pool to assess maximal performance at distances from 400 to 800 m are used. For the analysis of fi eld motor tests in running, tests at distances from 3 to 5 km are used.
On the contrary, there is a very diff erent view on the assessment of joint fl exibility in the triathlon. It is de-rived from various fl exibility requirements for each dis-cipline. Maximum, even limit fl exibility of certain body parts (e. g. hypermobile “swimming” ankle) important for swimming may be contra productive in another dis-cipline (ankle distortion during running). When assess-ing fl exibility predisposition, we should focus primarily on the limit range of motion in the shoulder and ankle joints rather than to assess maximal range of these seg-ments.
on the contrary, they need a high level of motivation, moral and volitional qualities.
Given the nature of competition and training is proving to be better a tendency to introversion. The one from key areas which to be considered is long-term ability to concentrate attention on performance (Weinberg & Gould, 2003; Morgan & Pollock, 1977; Zemanová & Kovář, 2009). The last study focused on identifying the ability to concentrate attention that we consider crucial. On the basis of the test profi le com-posed of four tests aimed at evaluating concentration of attention (Jirásek’s numeric square before and after performance, Numeric rectangle, Bourdon test and Dis-junctive reaction time II) they found out that the ability to concentrate attention was statistically signifi cantly higher in triathletes of higher performance levels in all the tests used. Diff erences were statistically signifi cant in all three diagnostics (Jirásek’s tests before perfor-mance t = –2.92; p = 0.005; ω2 = 0.14, Jirásek’s test after performance t = –2.98; p = 0.004; ω2 = 0.12, Numeric rectangle t = 2.20; p = 0.032; ω2 = 0.06, Bourdon test t = 6.20; p = 0.000; ω2 = 0.40, Disjunctive test t = 4.95; p = 0.000; ω2 = 0.29).
Attempts to fi nd performance predictors in the tri-athlon have so far been rather intuitive and were based on determinants of sport performance, theory of sports training and expert assessment.
In terms of methodology, statistical processing of the selection of indicators for successful prediction of performance in the triathlon is narrowed to several cat-egories.
Performance prediction is commonly assessed by means of correlation and regression analyses (Butts & McLean, 1991; Sleivert & Wenger, 1993; Van Schuylenbergh, Vanden Eynde, & Hespel, 2004), sig-nifi cance tests (Kohrt, Morgan, Bates, & Skinner, 1987; Heiden & Burnett, 2003), analysis of variance (Burke & Jin, 1996; Landers, Blanksby, Ackland, & Smith, 2000), and multidimensional linear regresion and re-gresion equations (Schabort, Killian, St Clair Gibson, Hawley, & Noakes, 2000; Fröhlich, Klein, Pieter, Em-rich, & Gießing, 2008). Studies have not brought any complex approach to performance prediction yet; our aim was to apply a structural approach to the issue of triathlon talent selection and develop a testing profi le predicting performance in the triathlon by means of factor analysis (Blahuš, 1980; Blahuš, 1985; McDonald, 1991). This enables us to explain mutual relationships between the variables observed (individual tests and their relation to concrete performance) and simultane-ously reduce the number of variables which simplifi es the variableʼs description. Another advantage is the pos-sibility of developing and verifying structural theory of the examined area, or transformation of the original variable into a more suitable condition.Therefore, we consider the FA in this context to be very appropriate.
Only a few studies indicated an attempt to process the results by means of multidimensional analysis (Lane, Terry, & Karageorghis, 1995; Landers, Blanks-by, Ackland, & Smith, 2000; Kovářová & Kovář, 2010), but generally it is used more for sport (Psotta, Blahuš, Cochrane, & Martin, 2005; Vallerand et al., 2008; Har-dy, Roberts, Thomas, & Murphy, 2010).
METHODS
The aim of the study was to fi nd and verify a model of predispositions in the short triathlon. First, we creat-ed a battery of tests to identify the assumptions and then made their mild reduction. Tests results were subjected to tests of normality and linearity of dependence so that they could be adopted into the test battery; subse-quently, a correlation matrix was created (TABLE 2, 3), which was followed by critical analysis of correlation relationships revealing dependences between, as well as inside of, individual areas of the examined performance.
Research sample
The research sample consisted of 64 triathletes – men aged 17–20 included into YSC between years 2005–2008. Due to an absence of results from more than 20% of tests in nine triathletes, we were forced to exclude these athletes from the sample. Therefore 55 participants were included in the correlation matrix (age 18.9 ± 1,5; body height 181.4 ± 7.0; body weight 70.5 ± 7.4; VO2max × kg–1 70.6 ± 5.0; ECM/BCM 0.76 ± 0.09; % of body fat 9.10 ± 1.62).
In the case of missing values in some tests, we had to complete them by the mean value of test result of the whole sample. In total, 6% of missing values were added. Testing was carried out within nationwide control tests of YSC in triathlon, testing of junior national teams and individual Youth Sport Centres in the laboratory of sport motor activities at The Faculty of Physical Educa-tion and Sport, Charles University.
The sample included the “whole” population of triathletes in junior category in YSC. Such a selected research sample allowed us to use the method of least squares as we did not have to relate the results to the “general” population. However, this solution has caused some problems, namely that the test profi le for perfor-mance prediction had been tested on already pre-select-ed athletes (includpre-select-ed in YSC) and thus exists a certain probability of rejecting appropriate tests because of low validity caused by high homogeneity of the sample which had been caused by pre-selection in the form of entrance tests for YSC.
Participants were informed in advance of load tests and had adjusted training the last week before the tests. The sequence of tests was identical in all probands.
TABLE 1 presents tests and their characteristics used in diagnostics of predispositions in short triathlon. We used tests selected from the following areas: 1. Anthropometric tests selected on the basis of
avail-able studies and our expert assessment [test of body fat measurement by means of bioimpedance method (BIA 2000), test of muscle mass quality (ratio ECM/ BCM)].
2. Aerobic predispositions tests (running test up to vita maxima,cycling test up tovitamaxima)
3. Field tests [test of anaerobic threshold in swim-ming (as an output indicator, we decided for time
TABLE 1
Tests and their characteristics used in diagnostics of short triathlon
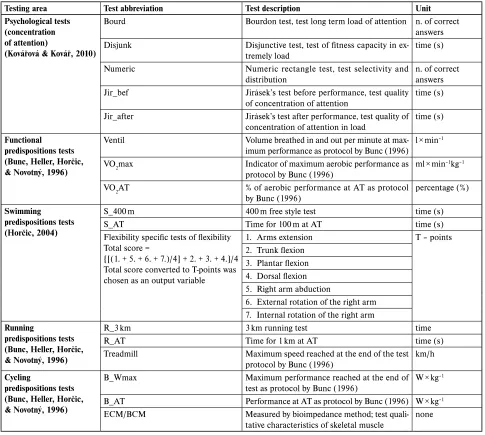
Testing area Test abbreviation Test description Unit Psychological tests
(concentration of attention)
(Kovářová & Kovář, 2010)
Bourd Bourdon test, test long term load of attention n. of correct answers Disjunk Disjunctive test, test of fi tness capacity in
ex-tremely load
time (s)
Numeric Numeric rectangle test, test selectivity and distribution
n. of correct answers Jir_bef Jirásek’s test before performance, test quality
of concentration of attention
time (s)
Jir_after Jirásek’s test after performance, test quality of concentration of attention in load
time (s)
Functional
predispositions tests (Bunc, Heller, Horčic, & Novotný, 1996)
Ventil Volume breathed in and out per minute at max-imum performance as protocol by Bunc (1996)
l × min–1
VO2max Indicator of maximum aerobic performance as protocol by Bunc (1996)
ml × min–1kg–1
VO2AT % of aerobic performance at AT as protocol by Bunc (1996)
percentage (%)
Swimming
predispositions tests (Horčic, 2004)
S_400 m 400 m free style test time (s)
S_AT Time for 100 m at AT time (s)
Flexibility specifi c tests of fl exibility Total score =
{[(1. + 5. + 6. + 7.)/4] + 2. + 3. + 4.}/4 Total score converted to T-points was chosen as an output variable
1. Arms extension T – points
2. Trunk fl exion 3. Plantar fl exion 4. Dorsal fl exion 5. Right arm abduction
6. External rotation of the right arm 7. Internal rotation of the right arm
Running
predispositions tests (Bunc, Heller, Horčic, & Novotný, 1996)
R_3 km 3 km running test time
R_AT Time for 1 km at AT time (s)
Treadmill Maximum speed reached at the end of the test protocol by Bunc (1996)
km/h
Cycling
predispositions tests (Bunc, Heller, Horčic, & Novotný, 1996)
B_Wmax Maximum performance reached at the end of test as protocol by Bunc (1996)
W × kg–1
B_AT Performance at AT as protocol by Bunc (1996) W × kg–1
ECM/BCM Measured by bioimpedance method; test quali-tative characteristics of skeletal muscle
none
for 100 m at the level of AT calculated from 300 m) sections, swimming test at 400 m freestyle, running test at 3 km].
4. Psychological tests (Jirásek’s numeric square before and after performance, Numeric rectangle, Bourdon test, Disjunctive reaction time II).
The testing system was composed of seventeen indi-cators covering all areas scoring performance prediction (TABLE 1, Fig. 1). In the initial correlation matrix were included tests identifying anaerobic predispositions (such as a swimming test – 10 swim freestyle stroke max. eff ort and cycling test Wingate test – 30 s). Their mutual correlation with other indicators, however, were very low and even found a low negative relationship with test evaluation of aerobic conditions (eg, r = –0.21 between performance on the 400 m swim and perfor-mance in the test 10 swim freestyle stroke max eff ort or r = –0.14 between the performance at AT and power output in the Wingate test) and again there was a phe-nomenon that the best triathletes achieved the lowest performance in the anaerobic tests. The fi nal matrix we therefore did not include these tests.
For verifi cation, we used FA and Path diagram. To process the data gained, we used confi rmatory factor analysis – least squares method (UL). For statistical data processing we used Lisrel L88 software.
Confi rmative factor analysis is based on testing hy-potheses related to the fact whether the initial correla-tion matrix can be represented by the correlacorrela-tion matrix derived on the basis of the assumption that the meas-ured variables were created as a specifi c linear combina-tion of factors. Confi rmative factor analysis therefore, instead of extraction and rotation of optional factors, tests a specifi c hypothesis about the load matrix (Hendl, 2006).
In the structural model of confirmative factor analysis, several important indicators are being evalu-ated. Factor loading (X) of empirical indicator (mani-fest variable) is assessed in relation to its latent factor (construct) and simultaneously its uniqueness (unex-plainable part) (Y). The values of factor loading and uniqueness are writing then (X, Y). Generally, we can state that the model is better if factor loadings are as high as possible while uniqueness of indicators as low as possible. This statement is limited, of course, in terms of the theory of factor analysis, namely that factor analysis and uniqueness range in the interval of < 0; 1 >, so that their values cannot acquire negative numbers. Should the factor loading be equal to 1 and uniqueness to 0, manifest variable (empirical indicator) is equal to the latent variable (factor) and thus is also a construct itself (Blahuš, 1985).
Furthermore, we assess indicators of the overall fi t model. For this purpose the Lisrel programme provides the indicator Goodness of Fit Index (GFI). The result is an interval of <0; 1>. If we multiply this value by 100, we obtain a percentage of the explained part of the model, namely information about what percentage of the model is explained. Thus we can state that the more the value of indicator approaches 1 (100%), the better hypoth-esis was tested. Dillon and Goldstein (1984) consider a value of 0.90 as a level of very good accuracy.
Finally, it is also necessary to assess the indicators of unexplained correlations, or total mean of unex-plained correlations or deviations of the initial matrix from the correlation matrix derived on the basis of our hypothesis. Programmes off er the Root mean squared residual (RMSR) index for this assessment. This indica-tor ranges between <0; 1>, when the lowest value, the lowest total unexplained correlation in the model and thus the best for our hypothesis. Chau (1997) suggests a border of very good agreements the value of 0.10. The Lisrel programme requires values higher than 0.97 for confi rmation of excellent accuracy while RMSR lower than 0.061.
RE SULTS
The results of the correlation matrix (TABLE 1, 2) show a high correlation between all the tests measuring concentration of attention, their relationship to other tests is low. On the contrary, a high correlation is found in test % fat to all the motor tests. Flexibility tests have a high correlation only to motor tests in swimming. The value of ECM/BCM seems high correlation to test % fat, and also to the results of motor tests in cycling and aero-bic predisposition tests. These parameters have there-fore decided to further analyze using Path diagram. The overall model of predispositions is depicted in Fig. 1. TABLE 4 presents indicators of overall fi t model and their value.
We proposed an acceptable model of predisposi-tions for triathlon, the correlation matrix of which is explained by 91% and Root Mean Square Residual is 0.13 (TABLE 4). The maximum possible factor weight, with regards to the general factor (predispositions for tri-athlon), was found in aerobic predispositions (1.00; 0), a very signifi cant factor weight was measured in running predispositions (–0.85; 0.28), followed by swimming (–0.61; 0.63) and cycling predispositions (0.53; 0.72). The lowest eff ect was found in psychological predisposi-tions (0.36; 0.87).
TABLE 2
Correlation matrix (part 1)
Bourd Disjunk Numeric Jir_bef Jir_after Ventil VO2max VO2 AT S_400 m Bourd 1
Disjunk 0.63 1
Numeric 0.51 0.57 1
Jir_bef –0.53 –0.60 –0.68 1
Jir_after –0.67 –0.69 –0.79 0.84 1
Ventil 0.10 0.01 –0.01 –0.05 –0.11 1
VO2max 0.33 0.03 0.27 –0.32 –0.41 –0.69 1
VO2 AT 0.36 0.07 0.21 –0.27 –0.34 –0.77 0.39 1
S_400 m –0.10 –0.24 0.08 0.12 0.21 –0.14 –0.53 –0.06 1
TABLE 3
Correlation matrix (part 2)
S_AT Flexibility R_ 3 km R_AT Treadmill B_Wmax B_AT ECM/BCM S_AT 1
Flexibility –0.61 1
R_ 3 km 0.32 –0.15 1
R_AT 0.43 –0.24 0.70 1
Treadmill –0.36 0.21 –0.63 –0.88 1
B_Wmax –0.29 0.08 –0.13 –0.06 0.31 1
B_AT –0.38 0.11 –0.43 –0.35 0.21 0.53 1
ECM/BCM 0.27 –0.05 0.31 0.22 0.24 –0.57 –0.42 1
TABLE 4
Indicators of overall model fi t
Goodness of Fit Index (GFI) 0.91
Root Mean Square Residual (RMSEA) 0.13
The remaining question is where to include a test of % of body fat (in the general population, indicator % of body fat is a good predictor of endurance predisposi-tions but in a very homogenous group of trained triath-letes with very similar values it is not possible to use it as a predictor). In this case, several possible solutions exist. 1. Percentage of body fat test will explain only some of
swimming, running or cycling factors.
2. Percentage of body fat test will, together with ECM/ BCM test, create a separate cluster of “anthropomet-ric predispositions”.
3. Percentage of body fat test will explain all factors.
Firstly, we will create a model without the indicator of % of body fat. Thereafter, we will anticipate one general factor, fi ve subordinated latent variables and 17 indica-tors. Results of such a proposed model are as follows.
Bourd
Disjunk
Numeric
Jir_bef
Jir_after
Ventil
VO2max
VO2 AT
S_400m
S_AT
Flexibility
R_3km
R_AT
Treadmill
B_Wmax
B_AT
ECM/BCM Psych
Aerobic
Swim
Run
Bike
PredT
1.00
0.36
1.00
-0.61
-0.85
0.53
0.50
0.54
0.49
0.27
0.14
0.35
0.35
0.45
0.35
0.11
0.58
0.51
0.10
0.13
0.37
0.39
0.70 0.70
0.68
0.71
-0.85
-1.00
0.81
0.81
0.74
0.80
0.94
-0.64
0.70
0.95
-0.93
0.79
0.78
-0.55
Fi g. 1
Overall model of predispositions for triathlon (latent factors model)
Legend:
Psych = psychological predispositions Aerobic = aerobic predispositions Swim = swimming predispositions Run = running predispositions Bike = cycling predispositions
PredT = predispositions in short triathlon
factor loadings but regression coeffi cients) of these vari-ables and provided information on explained variances in individual dependent and independent variables (TA-BLE 5).
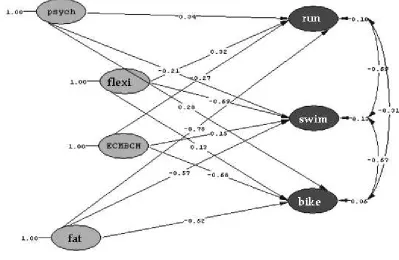
As we can see form TABLE 5 and Fig. 2, indicator of % of body fat was an excellent predictor of all factors in our model (swimming predispositions R2 = 0.57; cy-cling predispositions R2 = 0.62; running predispositions R2 = 0.78). Ratio ECM/BCM, or parameter assessing
Fig. 2 Path diagram
TABLE 5
Indicators of Path diagram
Predicate Swimming predispositions Cycling predispositions Running predispositions Psychological predispositions 0.21 0.28 0.34
Elexibility 0.69 0.13 0.32
ECM/BCM 0.15 0.68 0.27
% body fat 0.57 0.62 0.78
Regression residuum 0.13 0.05 0.10
DISCUSSION
The model of test battery verifi cation is composed of seventeen indicators that could not be reduced more. Some of the tests identify the level of fi tness as well as other genetic predispositions. This allows us to sepa-rate these areas to some extent, to determine the level of fi tness and recommend further possibilities for im-provement of triathletes examined and estimate their performance limit.
The correlation matrix was explained by a model of 91%, which can be considered acceptable (Dillon & Goldstein, 1984; Chau, 1997). The question remains, what might contribute to the increase the GFI and whether it actually did not test anaerobic assumptions? There is also the question of the aerobic assumptions related to motor conditions for swimming, cycling and
running so that it would form a separate cluster. We did not confi rm this hypothesis, and this model appeared to be less fi t (GFI 0.82, RMSR 0.19). However, the results confi rm previous studies that both reported aerobic as-sumptions as a keystone the performance prediction and selection of talent.
At this phase, the interpretation to replace all tests by those aerobic appears and thus to predict the per-formance in triathlon only by means of these predispo-sitions, which, as mentioned above, is the most usual approach (regression analysis). However, this “simpli-fi cation” is in contrast to another conclusion, i. e. that aerobic predispositions are not only essential, but also the only one suffi cient condition for talented athletes’ selection.
The second highest factor loading was detected in running predispositions (–0.85; 0.28), followed by swim-ming (–0.61; 0.63) and cycling predispositions (0.53; 0.72). This fi nding is in accordance with earlier stud-ies (Fröhlich, Klein, Pieter, Emrich, & Gießing, 2008), which also pointed out the importance of the running part in triathlon. Analyses of score sheets from races indicate that an excellent usually runner wins although he can be a worse swimmer or cyclist. The course of competition can erase performance diff erences from swimming and cycling parts but running performance, as the last part of triathlon, has the ultimate impact on the fi nal result. High factor loading of running predis-positions is probably related to the fact that running is the fi nal and decisive discipline in triathlon. Lower factor loadings of cycling predispositions correspond to the current concept of the race when by means of drafting it is possible to reduce the resistance while rid-ing behind another competitor and thus to save energy. Technical and tactical components of the cycling part may thus signifi cantly reduce diff erences in competitors’ performance. On the contrary, low swimming perfor-mance usually signifi es no hope for a top fi nal result and probably this is the reason for higher factor load-ing of swimmload-ing predispositions. This conclusion does not correspond with the results (Kovářová & Kovář, 2010) and it seems that the infl uence of swimming per-formance is more important than the corresponding analysis of its own parts. This will probably be due to so-called drafting.
The lowest value was represented by psychological predispositions (0.36; 0.87). This did not confi rm the results of a previous study (Zemanová & Kovář, 2009) that psychological predispositions will be essential in the model of predispositions in triathlon. The reason for the very low factor weight of this latent variable in the overall model could be the lower validity of psycho-logical tests than, for instance, aerobic tests, which led to lower (insignifi cant) correlation and overall factor weight in the model was thus lower, as well.
Another reason could be a higher heterogeneity of the sample or the wrong choice of indicators. When verifying the partial model, we used only tests of concen-tration of attention which could reduce the problem of psychological predispositions signifi cantly and mislead-ingly. We assume that, with regards to the character of
motor predispositions, it would be more appropriate to include some tests of moral and volitional characteris-tics and motivation into the model. On the other hand, the problem could be the assurance of measurements quality in such a test battery. However, we do not ex-clude general overestimation of psychological predis-positions in endurance sports.
Another problem, which we noticed in the applica-tion of factor analysis in a specifi c area of elite sport, is the generalization which is connected with modelling. Is it even possible to generalize something as specifi c as what the future estimation of predispositions for extreme endurance load is? On the other hand, each statistical method is based on some generalization and the method of factor analysis for the area of modelling predispositions is directly addressed to this problem. However, a negative fact is that this method has not been used so far in the area of identifi cation of predis-positions for future sport performance in the triathlon and therefore we can not compare the results of our study with similar ones.
In cases when we test battery for performance pre-diction in already pre-selected athletes (e. g. those in-cluded in YSC), there is still a certain probability of rejecting the suitable test because of the low validity caused by high homogeneity of the sample which is the result of pre-selection in the form of admission tests to YSC. Seemingly low test validity in the selected candi-dates may lead to deceptive rejection of a good admis-sion test (Fajfer, 2000).
CONCLUSIONS
We created a structural model of predispositions for short triathlon that explained 91% of all cross-correla-tions (Goodness of Fit Index /GFI/ 0.91, Root Mean Square Residual /RMSR/ 0.13).
On the basis of confi rmatory factor analysis, predis-positions of triathlon were divided into fi ve groups as for the fi elds of swimming, cycling and running (according to individual disciplines) and for the area of aerobic and psychological predispositions. We recommend applying these tests for talent selection in the triathlon for the age group of 17–19 years.
The maximum possible factor weight, with regards to the general factor, was found in aerobic predispositions (1.00; 0), a very signifi cant factor weight was measured in running predispositions (–0.85; 0.28), followed by swimming (–0.61; 0.63) and cycling predispositions (0.53; 0.72). The lowest eff ect was found in psychologi-cal predispositions (0.36; 0.87).
The ratio of ECM/BCM predicted most precisely predispositions for the cycling part (R2 = 0.68), consider-ably worse running predispositions (R2 = 0.27) and even less swimming predispositions (R2 = 0.15).
The value of percentage of body fat predicted most accurately predispositions for running part of triathlon (R2 = 0.78), less accurately for cycling part (R2 = 0.62) and the least predispositions for swimming (R2 = 0.57), however, all values measured are relatively high.
Tests of specifi c joint mobility best predict swim-ming predispositions (R2 = 0.69), signifi cantly worse running predispositions (R2 = 0.32) and the worst cy-cling predispositions (R2 = 0.13).
This model is currently used as a tool for the evalu-ation of the conditions for entry into the junior and U23 triathlon team. Its fi nancial requirements are due to small representation of the budget. The possibility to assess the level of assumptions and to correctly diversify fi nancial resources of competitors is more economical. For the selection of talent in the younger categories, we tend to reduce some tests.
ACKNOWLEDGEMENT
This research was supported by the grant MSM 0021620864 and GA UK 258159.
REFERENCES
Atwater, A. E. (1990). Gender diff erences in running. In P. R. Cavanagh (Ed.), Biomechanics of Distance Running (pp. 321–362). Champaign, IL: Human Ki-netics Publishers.
Ackland, T. R., Blanksby, B. A., Landers, G., & Smith, D. (1998). Anthropometric profi les of elite triathletes. Journal of Science and Medicine in Sports, 1, 53–56. Baron, R. M., & Kenny, D. A. (1986). The moderator –
mediator variable distinction in social psychological research: Conceptual, strategic, and statistical con-siderations. Journal of Personality and Social Psychol-ogy, 51(6), 1173–1182.
Bentley, D. J., Millet, G. P., Vleck, V. E., & McNaug-thon, L. R. (2002). Specifi c aspects of contemporary triathlon: Implications for physiological analysis and performance. Sports Medicine, 32(6), 345–359. Blahuš, P. (1985). Faktorová analýza a její zobecnění.
Praha: SNTL.
Blahuš, P. (1980). Základy modelů latentních proměn-ných včetně faktorové analýzy. Praha: Univerzita Kar-lova.
Bunc, V., Heller, J., Horčic, J., & Novotný, J. (1996). Physiological profi le of best Czech male and female young triathletes. Journal of Sports Medicine and Physical Fitness, 36, 265–270.
Burke, S. T., & Jin, P. (1996). Predicting performance from a triathlon event. Journal of Sports Behavior, 19(4), 272–287.
Butts, N. K., & McLean, D. (1991). Correlations be-tween VO2max and performance times of recreation-al triathletes. Journal of Sports Medicine and Physical Fitness, 31, 339–344.
Dillon, W. R., & Goldstein, M. (1984). Multivariate analysis: Methods and applications. New York: Wiley. Fajfer, Z. (2000). Predikce spotovního výkonu – zkresle-ní validity počátečzkresle-ním přijímázkresle-ním lepších uchazečů. Česká kinantropologie,4(1), 99–103.
Fröhlich, M., Klein, M., Pieter, A., Emrich, E., & Gieß-ing, J. (2008). Consequences of the three disciplines on the overall result in Olympic distance triathlon. International Journal of Sports Science and Engineer-ing, 2(4), 204–210.
Hardy, L., Roberts, R., Thomas, P. R., & Murphy, S. M. (2010). Test of PerformanceStrategies (TOPS): In-strument refi nement using confi rmatory factor analy-sis. Psychology of Sport and Exercise, 11(1), 27–35. Heiden, T., & Burnett, A. (2003). The eff ect of cycling
on muscle activation in the running leg of an Olym-pic distance triathlon. Sports Biomechanics, 2(1), 35–49.
Hendl, J. (2006). Přehled statistických metod zpracování dat. Praha: Portál.
Hue, O. (2003). Prediction of drafted-triathlon race time from submaximal laboratory testing in elite triathletes. Canadian Journal of Applied Physiology, 28(4), 547–560.
Chau, P. Y. (1997). Reexamining a model for evaluating information center success using a structural equa-tion modeling approach. Decision Sciences, 28(2), 309–334.
Ko, B. G., Gu, H. M., Park, D. H., Back, J. H., Yun, S. W., Lee, M. C., & Shin, S. Y. (2003). The con-struction of sports talent identifi cation model. In-ternational Journal of Applied Sports Sciences, 15(2), 64–84.
Kohrt, W., Morgan, D., Bates, B., & Skinner, J. S. (1987). Physiological response of triathletes to maxi-mal swimming, cycling and running. Medicine and Science in Sports and Exercise,19, 51–55.
Kovář, R. (1974). Příspěvek ke studiu genetické podmí-něnosti lidské motoriky. Praha: Univerzita Karlova. Kovářová, L., & Kovář, K. (2010). Concentration of
at-tention as a predisposition of performance in junior categories in endurance sports. Acta Universitatis Palackianae Olomucensis. Gymnica, 40(1), 23–33. Kovářová, L., & Kovář, K. (2010). Vliv použití
triatlo-nového neopretriatlo-nového obleku na míru rozptýlenosti seskupení startovního pole v plavecké části triatlonu v závodech světového poháru. Česká kinantropologie, 14(3), 75–86.
Kovářová, L., Jurič, M., & Kovář, K. (2012). Analýza výkonu v triatlonu. Studia Sportiva, 6(1), 83–91. Landers, G. J., Blanksby, B. A., Ackland, T. R., &
Mon-son, R. (2008). Swimming position and its infl uence on triathlon outcome. International Journal of Exer-cise Scientice, 1(3), 96–105.
Landers, G. J., Blanksby, B. A., Ackland, T. R., & Smith, D. (2000). Morphology and performance of world championship triathletes. Annals of Human Biology, 27(4), 387–400.
Lane, A. M., Terry, P. C., & Karageorghis, C. I. (1995). Path analysis examinig relationship among anteced-ents of anxiety, multidimensional stae anxiety, and traithlon performance. Perceptual and Motor Skills, 81(3/2), 1255–1266.
McDonald, R. P. (1991). Faktorová analýza a příbuzné metody v psychologii. Praha: Academia.
Millet, G. P., Dreano, P., & Bentley, D. J. (2003). Physiological characteristics of elite short and long distance triathletes. European Journal of Alied Physi-ology, 88, 427–430.
Morgan, W. P., & Pollock, M. C. (1977). Psychological characterization of the elite distance runner. Annals of the New York Academy of Science, 301, 382–405. Neumann, G. (1993). Zum zeitlichen Ablauf der
Anpas-sung beim Ausdauertraining. Leistungssport, 23(5), 9–14.
Niedeff er, R. M. (1993). Concentration and attention control training. In J. Williams (Ed.), Alied sport psy-chology (pp. 243–262). Palo Alto: Mayfi eld.
O’Toole, M. L., Douglas, P. S., & Hiller, W. B. (1989). Lactat, oxygen uptake and cycling performance in
triathletes. International Journal of Sports Medicine, 10, 413–418.
Peeling, P. D., Bishop, D. J., & Landers, G. J. (2005). Eff ect of swimming intensity on subsequent cycling and overall triathlon performance. British Journal of Sports Medicine,39, 960–964.
Psotta, R., Blahuš, P., Cochrane D, J., & Martin A, J. (2005). The assessment of an intermittent high in-tensity running test. Journal of Sports Medicine and Physical Fitness, 45(3), 248–256.
Roth, K., & Willimczik, K. (1999). Bewegungswissen-schaft. Reinbek bei Hamburg: Rowohl.
Schabort, E. J., Killian, S. C., St. Clair Gibson, A., Hawley, J. A., & Noakes, T. D. (2000). Prediction of triathlon race time from laboratory testing in na-tional triathletes. Medicine and Science in Sports and Exercise, 32, 844–849.
Schneider, D. A., Lacroix, K. A., Atkinson, G. R., Troped, P. J., & Pollack, J. (1990). Ventilatory threshold and maximal oxygen uptake during cycling and runnig in triathletes. Medicine and Science in Sports and Exercise, 22, 257–264.
Sleivert, G., G., & Rowlands, D. S. (2000). Physical and physiological factors associated with success in triathlon. Sports Medicine,22, 8–18.
Sleivert, G. G., & Wenger, H. A. (1993). Physiological predictors of short-course triathlon performance. Medicine and Science in Sports and Exercise, 25, 871–876.
Suriano, R., & Bishop, D. (2010). Physiological attrib-utes of triathletes. Journal of Science and Medicine in Sport,13(3), 340–347.
Talluri, T. (1998). Qualitative human body composition analysis assessed with bioelectrical impedance. Col-legium Antropologicum,22(2), 427–432.
Tittle, K., & Wutscherk, H. (1988). Anatomical and antro-pometric fundamentals of endurance. In R. J. Shep-ard & P. O. Astrand (Eds.), Endurance in Sport, the Encyclopedia of Sports Medicine (pp. 35–45). Oxford: Blackwell Scientifi c Publication.
Vallerand, R. J., Mageau, G. A., Elliot, A. J., Dumais, A., Demers, M. A., & Rousseau, F. (2008). Passion and performance attainment in sport. Psychology of Sport and Exercise,9(3), 373–392.
Van Schuylenbergh, R., Vanden Eynde, B., & Hespel, P. (2004). Prediction of sprint triathlon performance from laboratory tests. European Journal of Alied Physiology, 91, 94–99.
Weinberg, R. S., & Gould, D. (2003). Foundations of sport and exercise psychology. Champaing, IL: Hu-man Kinetics.
Zemanová, L., & Kovář, K. (2009). Koncentrace po-zornosti jako předpoklad výkonu v triatlonu. Česká kinantropologie, 13(3), 75–85.
perfor-mance and physiological variables determined in laboratory cycle and treadmill tests. Journal of Sports Medicine and Physical Fitness, 37, 122–130.
OVĚŘENÍ MODELU IDENTIFIKACE PŘEDPOKLADŮ V TRIATLONU –
STRUKTURÁLNÍ MODEL KONFIRMAČNÍ FAKTOROVÉ ANALÝZY
(Souhrn anglického textu)
VÝCHODISKA: Triatlon je kombinací tří odlišných sportů – plavání, cyklistiky a běhu. Každý z nich vyža-duje odlišné předpoklady, a komplexní přístup k výběru talentu je tak poměrně složitý proces. Pokusy identifi -kovat předpoklady v triatlonu byly doposud ojedinělé a zaměřovaly se pouze na některé oblasti (funkční před-poklady, motorické testy, psychologie). Nejnovější stu-die opomíjejí strukturální přístup a vycházejí zpravidla z determinant sportovního výkonu, teorie sportovního tréninku a expertního posouzení.
CÍLE: Cílem naší práce bylo ověřit model předpo-kladů v krátkém triatlonu pro kategorii mužů (juniorů) ve věku 17–20 let.
METODIKA: Výzkumný soubor byl tvořen 55 triat-lonisty – muži zařazenými do sportovních center mlá-deže v České republice v triatlonu ve věku 17–20 let. Pro ověření modelu jsme použili konfi rmační faktorovou analýzu a Path diagram, které umožňují vysvětlit vzájem-nou souvislost mezi pozorovanými jevy. Pro zpracová-ní dat jsme použili metody strukturálzpracová-ního modelovázpracová-ní (SEM) a software Lisrel L88.
VÝSLEDKY: Studie ověřila strukturální model předpokladů pro triatlon pro kategorii mužů ve věku 17–20 let, který se skládá ze sedmnácti indikátorů (testů) a vysvětluje 91 % všech vzájemných korelací (Goodness of Fit Index /GFI/ 0.91, Root Mean Square Residual /RMSEA/ 0.13). Testy předpokladů pro triatlon byly rozděleny do pěti skupin, tři pro oblast motorických předpokladů (plavání, cyklistika, běh), dále předpoklady funkční a psychické. Maximální možnou faktorovou váhu ke generálnímu faktoru představovaly funkční předpokla-dy (1,00; 0). Velmi významnou váhu pak měly běžecké předpoklady (–0,85; 0,28) a potvrzuje se, že běžecké dispozice mají v rozhodujících fázích závodu nejvyšší prioritu. Nižší faktorovou váhu představovaly předpo-klady pro plavání (–0,61; 0,63) a cyklistiku (0,53; 0,72). Nejnižší váha byla zjištěna u psychických předpokladů (0,36; 0,87).
ZÁVĚRY: Ověřili jsme model předpokladů a bate-rii testů pro vrcholové triatlonisty juniorské kategorie. Model je v současnosti využíván v České republice, kde slouží pro výběr sportovních talentů v systému SCM.
Klíčová slova: vrcholový sport, posuzování talentu, výběr talentů, vytrvalost, diagnostika, strukturální modelování.
Mgr. Lenka Kovářová, Ph.D., MBA
Education and previous work experience
2008–2010 – Czech Management Institute Prague (Es-cuela Superior de Marketing y Administración). 2006–2011 – Faculty of Physical Education and Sport, Charles University (doctoral study, specialization – Ki-nanthropology).
1998–2005 – one branch study of physical education with specialization to triathlon and endurance multicon-tests (Faculty of Physical Education and Sport, Charles University).
Work experience
2009 – Academic employee of Charles University, Fac-ulty of Physical Education and Sport, Laboratory of Sport Motor Activities.
1998–2008 – sport instructor (Sport Department of the Ministry of the Interior).
Sport success
Academic World Champion in triathlon.
Participant in OG (2004 Athens, Greece; 2008 Peking, China).
Other activities
Assistant of the main coach of senior national team in modern pentathlon. Sport Director of the Czech triath-lon association. Member of the Presidium of the Fair Play Club of the Czech Olympic Committee.
Others
Prize of Josef Hlavka Foundation for the best students and graduates of universities of Prague, Brno Technical University, and young researchers of the Czech Acad-emy of Sciences.
First-line publications
Kovářová, L. (2012). K identifi kaci předpokladů v triat-lonu. Praha: Karolinum.
Kovářová, L., & Kovář, K. (2010). Concentration of at-tention as a predisposition of performance in junior categories in endurance sports. Acta Universitatis Palackianae Olomucensis. Gymnica,40(1), 23–33. Kovářová, L., & Kovář, K. (2011). Comparison of heart
rate and the lactate level of individual anaerobic threshold in swimming, cycling and running in the triathlon. Antpropomotoryka, 21(56), 57–65. Kovářová, L., Soukup, P., & Kovář, K. (2012). Vliv
al-koholu na změny srdeční frekvence v běhu při vytr-valostní zátěži na úrovni anaerobního prahu. Česká kinantropologie,16(4), 111–123.
Charles University
Faculty of Physical Education and Sport José Martího 31