An Empirical Assessment of Non-Performing Assets in
Indian Scheduled Commercial Banks
Dr. Nisar Ahmad Khan
PGT (Commerce) in STS School, A.M.U.Aligarh, India
Abstract — Banking sector is one of the important sectors, which plays a significant role in the economic development of a country. It advances loans to various sectors viz. agriculture, industrial, infrastructure, and so forth and thereby accelerates the cycle of economic growth in the country. Hence, it is very imperative that the credit supply should be smooth in an economy to run the business cycle of various entities efficiently. However, in recent years it has been seen that banks become cautious in advancing loans. The reason is massive amount of Non-Performing Assets (NPAs) which affects banking operations severely. NPAs are those assets on which banks do not receive interest income. The present study discusses the concept of NPAs, its types, asset classification, and provisioning norms as per Reserve Bank of India (RBI) guidelines. The study further analyses the empirical position of NPAs in Indian Scheduled Commercial Banks (SCBs) and suggests measures for reducing them.
Keywords — Nepali Speaking People; Refugee Crisis; Bhutanese.
1. Introduction
The financial sector serves as a backbone in the economic growth of a country. Banks are the major players of financial sector, which bridges the gap between savers and investors. On the one hand, banks accept deposits of public and pay interest on those deposits while on the other hand, they give loans to various sectors after charging interest from them. This interest serves as the primary income of banks on the basis of which they carry out their operational activities. While granting loans, banks face credit risk, that is, the risk of default in paying interest instalments timely. Such credit risk gives rise to the incidence of NPAs, which results due to non-payment of interest instalments (Gopalakrishnan, 2004).
The categorization of asset quality dates back to 1985-86 when RBI introduced Health Code System (HCS) in banks for critically evaluating the performance of individual loans. Under HCS, banks have to classified their assets into eight categories, that is, satisfactory, irregular, sick-viable advances, sick-non viable advances, advances recalled, suit filed advances, decreed debts, and bad and doubtful debts (Rajeev & Mahesh, 2010; Rana, 2010).
The issue of NPA came in limelight after Narasimham Committee Report (1991) on Financial Sector Reforms (FSRs). The Committee seriously highlighted the problem
of NPAs and its impact on the financial health of banks. The report advocated that the biggest factor for banks low profitability and weak financial position is high level of NPAs. The Committee also felt that the asset classification norms as per HCS are not in accordance with the international standards. It suggested that the policy of income recognition should be objective and based on record of recovery rather than any subjective considerations. It also believed that provisioning is important to maintain the stability and soundness of banking sector. Hence, RBI introduced prudential norms for income recognition, asset classification, and provisioning for the advances portfolio of the banks to move towards greater consistency and transparency in the published accounts. The RBI further provided guidelines to implement these norms in a phased manner (Rajeev, 2008).
2. Non-Performing Assets: An Overview
As per RBI Master Circular-Prudential norms on income recognition, asset classification and provisioning (IRACP) pertaining to advances 2015, an asset, including a leased asset, becomes non performing when it ceases to generate income for the bank. From March 31,2004, a non performing asset is a loan or an advance where;
interest or installment of principal continue overdue for a period of more than 90 days based on the term loan,
the account remains ‘out of order’, in respect of an Overdraft/Cash Credit (OD/CC),
the bill remains overdue for a period of more than 90 days in the case of bills purchased and discounted, and
the installment of principal or interest thereon remains overdue for two crop seasons for short duration crops and for one crop season for long duration crops,
Out of Order Status:An account will be treated as out of order in case if outstanding balance remains continuously in excess of the endorsed limit/drawing power for 90 days.
Overdue: Any amount due to the bank under any credit facility is overdue if it is not paid on the fixed due date by the bank.
3. Types of Non-Performing Assets
NPAs as per RBI guidelines as on balance sheet date. The formula for calculating GNPA ratio is:
Net Non-Performing Assets (NNPAs): They show the real position of NPAs as banks deduct provision from GNPAs and gross advances for calculating NNPAs (Tiwari & Sontakke, 2013). The formula for calculating NNPA ratio is:
4. Literature Review
Fatima & Ashraf (2017) evaluated the position of GNPAs, NNPAs, and capital adequacy ratio of selected public sector banks (PSBs) for the period of 11 years covering 2005 to 2015. For analysis, top six PSBs were chosen on the basis of total assets that includes State Bank of India (SBI), Bank of Baroda (BOB), Bank of India, Punjab National Bank, Canara Bank, and Union Bank of India. The study found that there is significant difference in the GNPA ratio of selected banks while insignificant difference in the NNPA ratio of selected PSBs. It also found that BOB was the most efficient bank in reducing NPAs whereas SBI was the worst performer. The regression results indicated that NPAs have a significant influence on banks profitability.
Gautami, Tirumalaiah, and Sreecharan (2015)compared the NPAs levels in public and private sector banks for the period ranging from 2009 to 2014. The study assessed the trends of gross and net NPA ratios in these banks. It employed percentage, mean, standard deviation, and one sample t-test for analyzing the data. The authors revealed that private sector banks are most efficient in managing NPAs as compared to public sector banks.
Yadav (2014) discussed the concept of NPAs, factors responsible for them, and suggested measures to reduce the bad assets in Indian banks. The study compared the various parameters of NPAs in public and private sector banks for the period 2008-13. Further, it threw light that how high level of NPAs is detrimental to banks profitability, liquidity, and solvency. The study suggested that bank should comply with latest prudential norms, carries out proper credit assessment before granting loan, conducts follow-up evaluation, modernize recovery mechanisms, and give more loans to small borrowers.
Mukund (2013) empirically examined the structure, operations, performance, and challenges faced by Scheduled Commercial Banks (SCBs) in India. The study is conducted for a period of two years that is, 2009-10 and 2010-11 and it revealed that the level of GNPAs reduced in private sector banks but the performance of public sector remained constant. The author suggested that SCBs should
increase interest rates and concentrate on foreign operations to face future challenges. Further, the study suggested that public sector banks should make more efforts to reduce their NPAs.
Aggarwal and Mittal (2012) attempted to analyze how efficiently selected public and private banks have managed their NPAs. The key variables used were gross NPA and net NPA ratio to analyze the data of 10 years covering period from 2001-02 to 2010-11. The study concluded that the magnitude of NPAs is higher in public sector banks as compared to private banks. It also found that the performance of public banks improved to some extent as they have managed to bring down the level of NPAs.
5. Objectives of the Study
The study has been conducted in the light of following objectives:
To understand the concept of NPAs, its types, asset classification, and provisioning norms.
To analyze the empirical position of gross and net NPAs in Indian Scheduled Commercial Banks (SCBs).
To assess the asset classification position of SCBs in India.
To assess the degree of relationship between GNPAs and gross advances and NNPAs and net advances in SCBs.
To analyze the recovery measures of NPAs and provide suggestions for reducing them in SCBs.
6. Methodology of the Study
The present study is descriptive and empirical in nature. The study is entirely based on secondary sources where a major portion of data have been extracted primarily from RBI publications, that is, Handbook of Statistics on Indian Economy and Statistical Tables Relating to Banks in India. Further, different business journals, magazines, newspaper, periodicals, and data available on internet have been also used. The study is confined to examine the various aspects of NPAs in SCBs for a period of 8 years ranging from 2009-10 to 2016-17. It has used various statistical tools-mean, correlation coefficient, and percentage technique to analyse and interpret the data.
7. Asset Classification
As per RBI Master Circular on IRACP norms, 2015, banks have to classify their assets into following categories based on the period for which the asset has remained non-performing:
timely on them. These assets help banks in increasing their profitability and diversification activities (Lalitha, 2013).
Non-performing Assets: NPAs are of following three types:
Substandard Assets: These are the assets which have remained NPA for a period of less than or equal to 12 months. Such assets have well defined credit weakness that put at risk the liquidation of the debt and are typified by the distinct likelihood that the banks will sustain some loss, if shortage are not corrected.
Doubtful Assets: These assets have remained in the substandard category for a period of 12 months. A loan classified as doubtful has all the weaknesses inherent in assets that were classified as sub-standard, with the added characteristic that the weaknesses make collection or liquidation in full.
Loss Assets: These are the assets where loss has been identified by the banks or RBI inspection or internal/external auditors. In other words, such an asset is considered uncollectible and of such little value that its continuance as a bankable asset is not warranted although there may be some salvage or recovery value.
8. Provisioning Norms
Banks have to make provision requirement on the basis of asset classification and taking into account the time lag between an account becoming doubtful of recovery, its recognition as such and the erosion over time in the value of security charged to the bank.
Table1: Provisioning requirement on assets
Types of Assets Provisioning Criteria
Standard Assets @0.25%- Small and Micro Enterprises loans @1%-Commercial Real Estate loans @0.75%- Commercial Real Estate-Residential housing loans
@0.40% on other loans and advances Substandard
Assets
@15% on total outstanding without making any allowance for ECGC guarantee cover and securities available whereas in regard to unsecured exposures
@25% on the outstanding balance.
Doubtful Assets @100% in regard to unsecured portion; whereas in regard to the secured portion, the provision requirement depends upon the period for which the asset has remained doubtful:
@25%- upto 1 year @40%- one to three years @100%-more than three years Loss Assets @100% of the outstanding
Source: RBI Master Circular-Prudential norms on Income Recognition, Asset Classification and Provisioning pertaining to Advances, 2015. Retrieved from www.rbi.org.in.
9. Factors Responsible for Non-Performing Assets
There are number of factors that are responsible for NPAs in banks and financial system which are as follows:
Internal Factors: diversion of funds by borrowers for expansion of business and promoting associate firms, inefficient internal control system, poor credit appraisal of projects, lack of monitoring, inefficient credit officials, lack of proper follow-up of projects, obsolete information and Management Information System (MIS) in banks, improper SWOT analysis, siphoning of funds, poor recovery of receivables, inaccurate scrutiny of information provided by borrowers, management disputes, and so forth.
External Factors: wilful defaults, political interference, climatic reasons in case of farmers, ineffective legal machinery, frequent changes in regulatory policies, recession, poor implementation of project, slow domestic growth, long gestation period in project implementation, loan waiver schemes, industrial sickness, power deficiency, price escalation of input variables, ineffectiveness of suit filing, and so forth (Fatima & Ashraf, 2017; Samir & Kamra, 2013).
10.
Impact of Non-Performing Assets on Banks Operations
NPAs are hazardous for banking operations due to the following reasons:
Banks have to make provision on NPAs as per RBI guidelines, which results in decreasing profitability as well as liquidity, because provision amount has been set aside out of profits.
On NPAs, banks do not receive regular interest installments which influence their liquidity and solvency position.
Higher level of NPAs affects credibility of banks. They ruin banks goodwill in the eyes of the public.
NPA erodes net worth of banks, generate low yield on advances, reduce capital adequacy ratio (CAR) and effect operational efficiency of banks.
NPA widens the gap between assets and liability.
Further, high level of NPAs influences economic value addition of banks.
11. Analysis and Interpretation
Table 2: GNPAs of Scheduled Commercial Banks as on March 31 (Amount in Billion)
Year Gross Advances
GNPAs GNPAs as % of Gross Advances
GNPAs as % of total assets
2010 35449.65 846.98 2.4 1.4
2011 40120.79 979.00 2.5 1.4
2012 46488.08 1429.03 3.1 1.7 2013 59718.20 1940.53 3.2 2.0 2014 68757.48 2633.72 3.8 2.4 2015 75606.66 3233.45 4.3 2.7 2016 81673.45 6119.47 7.5 4.7 2017 84767.05 7902.68 9.3 5.6 Mean 61572.67 3135.61 4.5 2.7
Source: Compiled by researcher from RBI-Handbook of Statistics on Indian Economy and Report on Trend and Progress of Banking in India. Retrieved from www.rbi.org
It is clear from Table 2 that the amount of GNPAs significantly increased from Rs. 846.98 billion in 2010 to Rs. 7902.68 billion in ending March 31, 2017. It is noteworthy here that the increase in GNPA ratio as percentage of gross advances and assets follows the same trend. The GNPA ratio increased continuously and reached to the highest level of 9.3% in 2017 from 2.4% in 2010 which indicates poor management of NPAs and faulty lending practices of SCBs. From Graph 1, it is evident that there is an increasing trend in GNPAs to gross advances ratio as well as in GNPAs to total assets ratio.
0 2 4 6 8 10
2010 2011 2012 2013 2014 2015 2016 2017
GNPAs as % of Gross Advances
GNPAs as % of total assets
Fig.1. Trends of GNPA ratio (%)
Source: Constructed on the basis of figures given in Table 2.
Gross Advances of SCBs | grossadvances gnpas
---+--- grossadvances | 1.0000 gnpas | 0.8791 1.0000
Source: Computed through STATA 13 based on data given in Table 2.
From Table 3, it is evident that there is high degree of positive association between GNPAs and gross advances. The correlation (r) is 0.88, which implies that with increase in gross advances, there is direct and proportional increase in the amount of GNPAs.
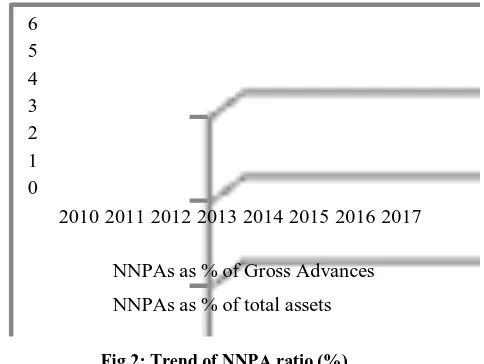
Table 4: NNPAs of Scheduled Commercial Banks as on March 31 (Amount in Billion)
Year Net Advances
NNPAs NNPAs as % of Net
Advances
NNPAs as % of total assets
2010 34970.92 387.23 1.1 0.6
2011 42987.04 417.00 1.1 0.6
2012 50735.59 652.05 1.3 0.8
2013 58797.73 986.94 1.7 1.0
2014 67352.13 1426.56 2.1 1.3
2015 73881.79 1760.93 2.4 1.5
2016 78964.67 3498.20 4.4 2.7
2017 81716.98 4331.00 5.3 3.1
Mean 61175.86 1682.49 2.4 1.5
Source: Compiled by researcher from RBI-Handbook of Statistics on Indian Economy and Report on Trend and Progress of Banking in India. Retrieved from www.rbi.org.
0 1 2 3 4 5 6
2010 2011 2012 2013 2014 2015 2016 2017
NNPAs as % of Gross Advances
NNPAs as % of total assets
Fig.2: Trend of NNPA ratio (%)
Source: Constructed on the basis of figures given in Table 4.
implies bad management of asset quality in SCBs. It has been noted that the percentage of GNPAs to total assets and GNPAs to gross advances ratio continuously increased during 2011-17. It is observed from Graph 2 also that there has been steep rise in the NNPA ratio of SCBs.
Table 5: Correlation between NNPAs and Net Advances of SCBs | netadvances nnpas
---+--- netadvances | 1.0000 nnpas | 0.8763 1.0000
Source: Computed through STATA 13 based on data given in Table 4.
Table 5 reveals that the correlation coefficient between NNPAs and net advances is very high, that is, 0.88, which implies that when net advances are high then the level of NNPAs are also high and vise-versa.
Table6: Classification of loan assets of SCBs as on March 31 (Amount in Billion)
Yea r
Standard Assets
Substandar d Assets
Doubtful Assets
Loss Assets
Amt % Amt % Amt % Amt %
2010 34603 97.6 426 1.2 334 0.9 87 0.2
2011 42596 97.8 414 1.0 461 1.1 104 0.2
2012 50168 97.3 695 1.4 617 1.2 109 0.2
2013 57951 96.8 909 1.5 900 1.5 123 0.2
2014 66138 96.2 1087 1.6 1374 2.0 170 0.2
2015 72391 95.7 1186 1.6 1861 2.5 182 0.2
2016 75666 92.5 2252 2.8 3603 4.4 260 0.3
2017 76804 90.7 2082 2.5 5503 6.5 317 0.4
Mea
n 59539. 95.6 1131 1.7 1832 2.5 169 0.2
*Amt = Amount
Source: Statistical Tables Relating to Banks in India. Retrieved from www.rbi.org
Table 6 shows that the standard assets decreased steadily from 97.6% in 2010 to 90.7% in 2017, which indicates increase in the level of NPAs due to poor credit monitoring. The substandard assets increased significantly from 1% in 2011 to 2.8% in 2016 whereas doubtful advances increased continuously and reached at a soaring level of 6.5% in 2017 from 0.9% in 2010. Though, the percentage of loss advances remained same, i.e., 0.2% during 2010-15, but thereafter they increased to 0.4% in 2017 which signifies poor credit management of banks in reducing NPAs. Figure 3 presents the trends of NPA classification in SCBs.
Figure 3: Trends of NPAs classification of SCBs (in %)
*SSDA= Substandard Advances; DA= Doubtful Advances; LA=loss Advances,
Source: Constructed on the basis of data given in Table 6.
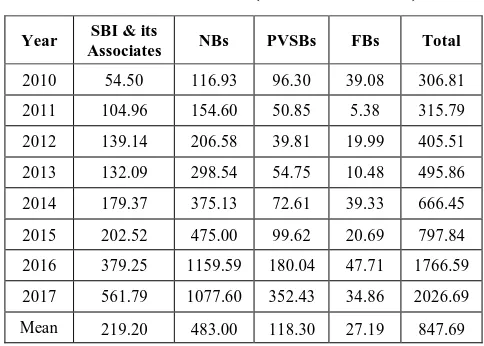
Table 7: Provisions and Contingencies for NPAs of SCBs as on March 31(Amount in Billion)
Year SBI & its
Associates NBs PVSBs FBs Total
2010 54.50 116.93 96.30 39.08 306.81
2011 104.96 154.60 50.85 5.38 315.79
2012 139.14 206.58 39.81 19.99 405.51
2013 132.09 298.54 54.75 10.48 495.86
2014 179.37 375.13 72.61 39.33 666.45
2015 202.52 475.00 99.62 20.69 797.84
2016 379.25 1159.59 180.04 47.71 1766.59
2017 561.79 1077.60 352.43 34.86 2026.69
Mean 219.20 483.00 118.30 27.19 847.69
Source: Compiled by researcher from RBI-Statistical Tables Relating to Banks in India
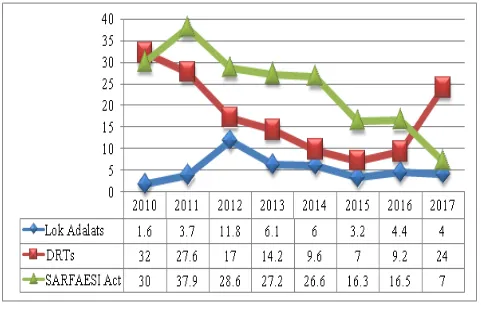
Fig. 4: NPAs Recovery Through Various Channels in SCBs (in %)
* DRTs= Debt Recovery Tribunals; SARFAESI= Securitization and Reconstruction of Financial Assets and Enforcement of Security Interest Act. Source: Compiled by researcher from RBI- Statistical Tables Relating to Banks in India.
Figure 4 shows percentage of amount recovered to amount involved in NPAs. It is evident that SARFAESI is the most effective channel for recovery of NPAs followed by DRTs. It is also clear that the recovery rate of DRTs and SARFAESI continuously decreased from 2010 to 2015. The recovery rate of the Lok Adalats is the worst among various channels. The highest recovery rate was 37.9% in case of SARFAESI followed by 32% in DRTs and 11.8% in Lok Adalats.
12. Management of NPAs
Banks may reduce their NPA levels by adopting legal as well as non-legal measures. The legal measures available for reducing NPAs include:
Securitization and Reconstruction of Financial Assets and Enforcement of Security Interest (SARFAESI) Act 2002, which provides for enforcement of security interest by creditor without intervention of court.
Compromise Settlement schemes and Lok Adalats forums that provides for settlement of dues between borrowers and banks via negotiation, mediation, and conciliation.
Debt Recovery Tribunals (DRTs) that help banks and financial institutions for recovering their dues quickly and efficiently.
Asset Reconstruction Companies which purchase NPAs of banks and financial institutions at discount rate.
Corporate Debt Restructuring (CDR) Scheme for resolution of NPAs of viable corporate entities facing financial difficulties.
Financial Resolution and Deposit Insurance (FRDI) Bill, 2017 provides speedy and efficient resolution of distress for certain categories of financial service providers.
Insolvency and Bankruptcy Code (IBC), 2016 resolve the stressed assets of banks and corporations in a time-bound and effective manner (i.e., 180 days which can be extended to 90 days under certain circumstances).
The non-legal measures includes proper credit appraisal of the projects, timely monitoring of the projects, post follow-up, giving training to credit officials for efficient management of credit risk, strong internal control risk system, effective risk management system, enabling asset liability management (ALM) system, timely initiation of legal action, effective utilization of information provided by credit rating agencies, strict action against willful defaults, circulating information on defaulters and so forth (Fatima & Ashraf, 2017; Reserve Bank of India, 2017).
13. Conclusion
NPAs have always been a big worry for the banks in India. It is just not a problem for the banks; they are bad for the economy too. In the end, it may be concluded that the level of NPAs is very high in SCBs and they should initiate strict measures to curb down this menace.However, complete elimination of NPAs is not possible but they can be brought to a manageable level. To get better profitability and efficiency, the NPAs have to be scheduled. The government of India and RBI has taken number of initiatives to reduce the level of bad loans NPAs but they are still very high as compared to the international standards. In order to reduce them, banks must develop an efficient management system and the staff involved in sanctioning the advances should be trained about the proper documentation. Banks should conduct proper inspection and credit appraisal before approving a project and then carry out regular monitoring to ensure that the amount must be utilized for the purpose for which it has been given. It is suggested that government should formulate bank specific policies and should implement these policies through Reserve Bank of India guidelines for improving the asset quality of SCBs.
References
[1] Aggarwal, S., & Mittal, P. (2012). Non-Performing Assets: Comparative Position of Public and Private Sector Banks in India. International Journal of Business and Management Tomorrow, 2(1), 1-7. Retrieved from www.ijbmt.com
[2] Fatima, N., & Ashraf, S.H. (2017). An Inquisition of non-performing assets in selected Indian public sector banks. [3] International Journal of Applied Financial Management
Perspectives, 6(2), 3145-3157.
banks in India. International Journal of Science and Research, 4(3), 251-254.
[5] Gopalakrishnan, T.V. (2004). Management of non-performing advances. New Delhi, India: Northern Book Centre.
[6] Karunakar, M., Vasuki, K., & Saravanan, S. (2008). Are Non-Performing Assets Gloomy or Greedy from Indian Perspectives? Research Journal of Social Sciences, 3, 4–12. Retrieved from http://www.aensiweb.com/rjss/rjss/2008/4-12.pdf
[7] Lalitha, N. (2013). Non-performing assets status & impact: A comparative study of public & private sector banks with special reference to SBI, Canara, HDFC and Karur Vysya Banks (Doctoral
thesis). Retrieved from
http://shodhganga.inflibnet.ac.in/handle/10603/8679
[8] Mukund, M.J. (2013). Structure Performance and Problems of Scheduled Commercial Banks in India.ASM’s International E- Journal of Ongoing Research in Management and I.T. (INCON13-Fin-035).
[9] Rajeev, M. (2008). Assets as Liability?: Non-Performing Assets in the Indian Banking Sector (with special reference to the small industries sector). Research Project funded by South Asia Network of Economic Research Institutes, 186- 208.
[10] Rajeev, M., &Mahesh, H. P. (2010). Banking sector reforms and NPA : A study of Indian commercial banks. The Institute for Social & Economic Change-Working Paper 252. Retrieved
fromhttp://www.isec.ac.in/WP%20252%20-%20Meenakshi%20Rajeev%20and%20H%20P%20Mahesh.pdf [11] Rana, R.D. (2010). Management of performing and non performing
assets- A study of selected urban co-operative banks in South Gujarat (Doctoral thesis). Retrieved from http://shodhganga. inflibnet.ac.in/handle/10603/2543
[12] Reserve Bank of India. (2015). Master circular- Prudential norms on income recognition, asset classification and provisioning pertaining to advances. Retrieved from https://rbidocs.rbi.org.in/ rdocs/notification/PDFs/101MC16B68A0EDCA9434CBC239741F5 267329.PDF
[13] Samir., & Kamra, D. (2013).A Comparative Analysis of Non- Performing Assets (NPAs) of Selected Commercial Banks in India. Opinion: International Journal of Management, 3 (1), 68-80, June. [14] Tiwari, C.K., & Sontakke, R. (2013). Non-performing assets: A
cause of concern for banks. ASM’s International E- Journal of Ongoing Research in Management and I.T., 1-6.
[15] Yadav, Sushma. (2014). NPAs: Rising trends and Preventive Measures in Indian banking sectors. International Journal of Advance Research in Computer Science and Management studies, 2(1), 129-141.