ISSN 0975-928X
http://ejplantbreeding.com 1148
Research Article
Genetic Divergence in Moth Bean (
Vigna aconitifolia
(Jacq) Marechal
)
S.N.Kohakade, V.V. Bhavsar and V. Y. Pawar
Department of Agricultural Botany, College of Agriculture Dhule-424 004 (MPKV), (M.S.), India. E- mail: [email protected]
(Received: 26 July 2017; Revised: 6 Dec 2017; Accepted: 28 Dec 2017)
Abstract
An experiment was undertaken by utilizing forty four moth bean genotypes for eleven yield and yield contributing characters to assess genetic divergence. The analysis of variance has shown that there was significant variation among the genotypes in all the traits. The multivariate analysis carried out using Mahalanobis D2-statistics, indicated wider genetic diversity in the genotypes of moth bean. Out of seven cluster formed, cluster I was largest with eighteen genotypes, followed by cluster IV with twelve genotypes, cluster III with seven genotypes, cluster II with four and V, VI, VII were mono-genotypic. The clustering pattern indicated absence of relationship between genetic diversity and geographical origin of the genotypes. The maximum inter cluster distance was observed between cluster IV and V (D2=29.12) while, lowest divergence was noticed between cluster V and VI (D2=4.46). Maximum intra cluster distance observed within cluster IV (D2=5.12) while lowest intra cluster distance was observed within cluster I (D2=3.85). The variance for cluster means were high for days to 50% flowering (32.56%), 100- seed weight (13.95%), length of main axis (13.21%) and number of seeds per pod (10.57%) and was low for number of primary branches and pod length. Based on inter-cluster distances, cluster mean and per se performance, and divergence class the genotypes viz., DHMB-32, DHMB-26, DHMB-31, DHMB-30 and DHMB-16 were distinct and diverse and can be classified as promising genotypes. These four genotypes can be used for inter-crossing to obtain heterosis and also wider variability in moth bean. Hybridization between the genotypes of cluster IV with the genotypes of cluster V may result in exploiting more heterosis with maximum genetic divergence and are likely to produce desirable transgressive segregants in segregating generations for further crop improvement
.
Key words
Genetic diversity, D2 value, cluster, genotype. Introduction
Pulses occupy a unique position in Indian agriculture because of their nutritive value and ability to improve the fertility of soil. In India, the total area under pulses was 25.26 million ha with production of 19.25 million ton 2015-2016. Out of total pulses area in India, under Maharashtra is 34.08 lakh ha and the production is 24.04 lakh tons and area under moth bean was 0.278 lakh ha and the production is 0.096 lakh ton Tiwari and Shivhare (2016). Moth bean {Vigna aconitifolia
(Jacq) Marechal} belongs to family Leguminosae /Fabaceae sub family papilionaceae. Chromosomal constitution of a species is 2n= 22. Popularly, it is also known as ‘Mat’, ‘Matki’ and ‘Moth bean’ in different regions. It is an important crop of dry and semi-arid areas of India and some countries of Asia. Among kharif pulses, it has maximum capacity to resist drought condition. It is an excellent source of high quality protein (23.6%) in the diet of low income group in developing countries.
Genetic diversity which is pre-requisite for any successful breeding programme is of paramount importance. Genetic divergence among the parents play a vital role in cultivar improvement because a cross involving genetically diverse parents is likely to generate more variability in segregating generations, and also which can be used for the
desired improvement. Generally, plant breeders select the parents on the basis of phenotypic diversity. Hence the knowledge of genetic diversity among the parents with respect to characters which are to be improved is essential. Keeping these things in the view, an effort has been made in the present study to evaluate a set of moth bean genotypes with the objective to study the nature and magnitude of divergence among the genotypes of moth bean.
Materials and methods
ISSN 0975-928X
http://ejplantbreeding.com 1149
suggested by Mahalanobis (1936) known as “Mahalanobis D2 statistics” or “D2 technique” is widely used to know genetic diversity in the germplasm. It was conducted to estimate the intra and inter cluster distances and to group the genotypes into different clusters and a logical grouping of genotypes following Tocher’s method (Rao, 1952).
Results and discussion
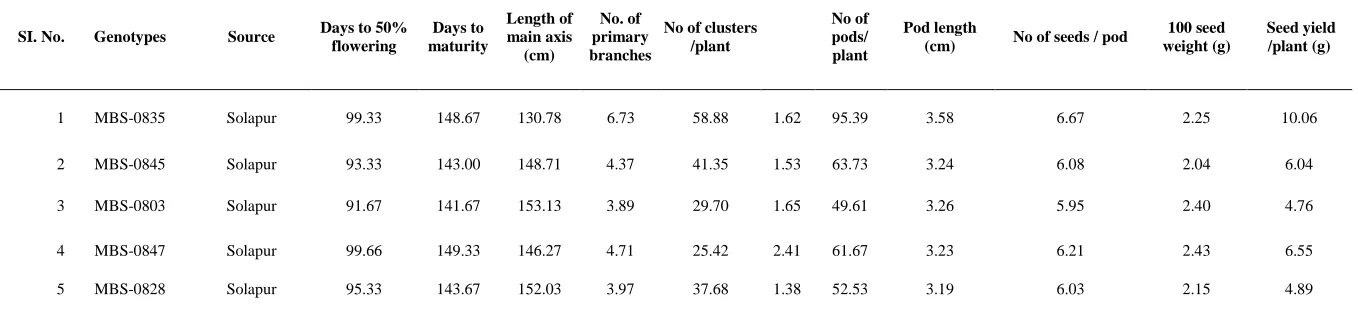
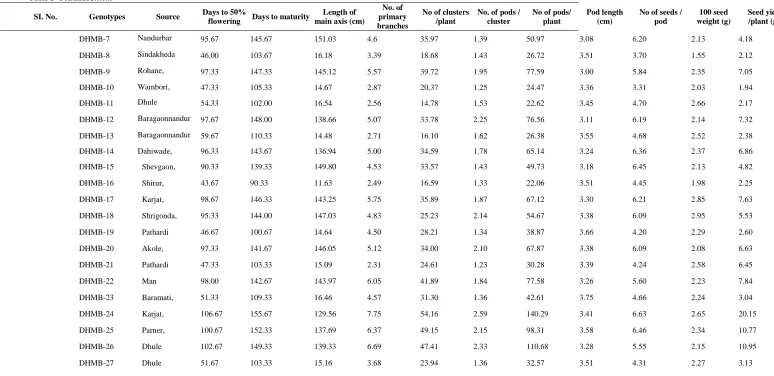
Analysis of variance for eleven characters indicated that the genotypes used in the present studies were significantly different (Table 1). The mean performances of 44 genotypes of moth bean for eleven characters studied are presented in Table 2. The genotype DHMB-16 (43.67 days) was the earliest for flowering (46 days) and days to maturity (90.33days). The genotypes DHMB-31 (20.64g) recorded the highest seed yield per plant, maximum number of cluster per plant (56.73), maximum pods per cluster (2.53) and maximum number of pods per plant (143.53). While the genotype DHMB-24 produced maximum pods per cluster (2.59) and highest seed yield per plant (20.15g).
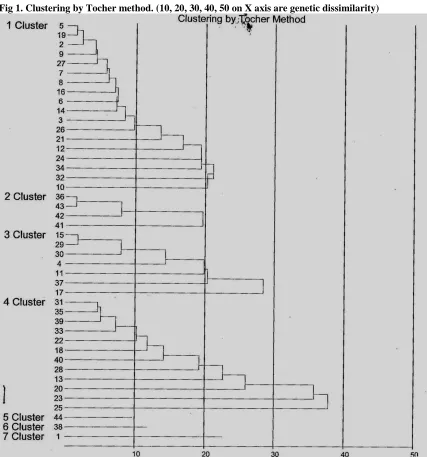
On the basis of D2 values, the forty four genotypes evaluated for eleven characters were grouped into seven clusters by using the Tocher’s method as described by Rao (1952). Cluster I was largest with 18 genotypes followed by cluster IV (12 genotypes), cluster III (7 genotypes) and cluster II (4 genotypes), while clusters V, VI and VII were monogenotypic. In the present investigation grouping of genotypes into 7 clusters suggested the presence of substantial amount of genetic diversity in the material under investigation. The clustering pattern and the eco-geographical regions of origin of each line are given in Table 1 and 3. Cluster I was the largest including 18 lines indicates that there was no association between clustering pattern and eco-geographical distribution of the cultures. Murty and Arunachalam (1966) and Somayajulu et al.
(1970) while working with different crops, reported that geographical distribution does not necessary reflect genetic divergence. Cluster II which include 4 lines, cluster III include 7 lines and cluster IV include 12 lines under study had varieties from different eco-geographical regions, thus supporting the view that geographic distribution and genetic divergence do not follow the same trend. This confirms the results reported by Bhavsar and Birari (1991) and Deokar et al.
(1991) in moth bean. Wide range of diversity was reported by many workers while evaluating moth bean genotypes (Henry and Krishna (1986); Natrajan et al. (1988); Jindal (1990) ;Deokar et al.
(1991); Kakani et al. (2003); Patil et al. (2008); Bangar et al. (2009); Das et al. (2010); Babbar et al. (2012); Yogeesh et al. (2012).
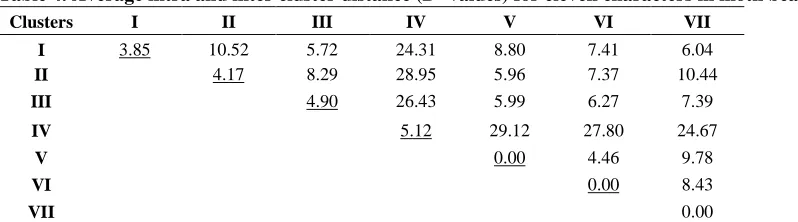
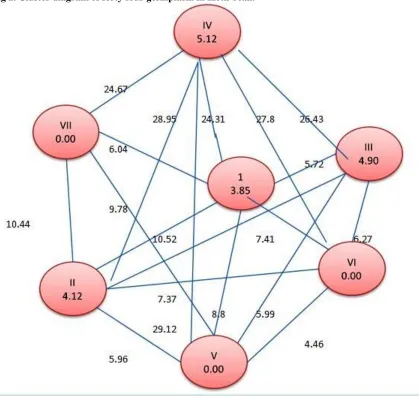
The maximum intra cluster distance was observed for cluster IV (D2 =5.12) followed by cluster III (D2=4.90) suggesting that genotypes present in these clusters might have different genetical architecture (Fig.1, Fig.2 and Table 4). However, lowest intra cluster distance was observed in cluster I (D2=3.85) indicating that genotypes present in these cluster might have genetical similarities with one another and appeared to have evolved from common gene pool. Cluster V, VI and VII showed no intra cluster distance due to its monogenotypic nature.
Maximum inter cluster distance was observed between cluster IV and cluster V (D2=29.12) followed by distance between cluster II and cluster IV (D2=28.95), cluster IV and cluster VI (D2=27.80), cluster III and cluster IV (D2=26.43) ; cluster IV and VII (D2=24.67) indicating, wide divergence among these clusters and suggest that genotype present in one cluster differ entirely from those present in other clusters. The minimum inter cluster distance was found between cluster V and cluster VI (D2=4.46) followed by cluster I and cluster III (D2=5.72), cluster II and cluster V (D2=5.96), cluster III and cluster V (D2=5.99); cluster I and cluster VII (D2=6.04). The low inter cluster distance between these clusters revealed that genetic constitution of genotypes had close proximity.
ISSN 0975-928X
http://ejplantbreeding.com 1150
al. (2012) for number of seeds per pod and 100 seed weight in mung bean (Vigna radiate L.).
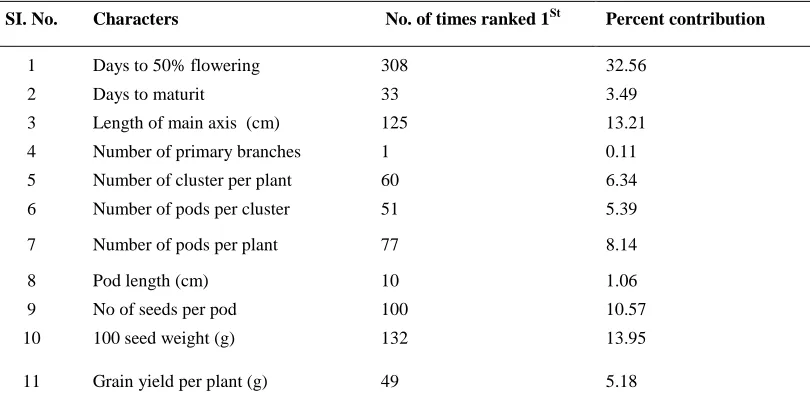
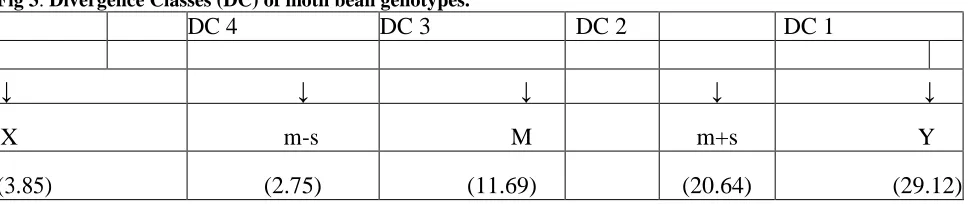
The magnitude of contribution by number of primary branches and pod length was low. These results were contradictory with the findings of Henry and Krishna (1986) for seed yield per plant. The mean of seven clusters and four intra-clusters (as monogenotypic cluster V, VI and VII had no intra-cluster distance) was 11.69 and standard deviation 8.95. The minimum (X) and maximum (Y) values among these distances were 3.85 and 29.12, respectively.
Grouping of cluster pairs into the divergence class (DC) is presented in Fig 3. On the light of discussion, initial choice of parents should be made from the cluster combinations falling in the divergence classes DC2 and DC3. While crossing among the genotypes of a cluster, the per se performance of the genotypes for different traits such as earliness (days to 50% flowering and days to maturity), length of main axis, number of branches per plant, number of cluster per plant, number of pods per cluster, number of pods per plant, pod length, number of seeds per pod, 100 seed weight, yield per plant etc. should be taken into account so, that desirable transgressivie segregants would be obtained following after hybridization.
The present study revealed no parallelism between genetic divergence and geographical distribution of genotypes which was demonstrated by grouping of genotypes from same origin into different clusters separated by high genetic distance. This suggested, that genetic drift and selection in different environments may cause geographical distances. Considering inter-cluster distances, cluster mean and per se performance, and divergence class the genotypes viz., DHMB-32, DHMB-26, DHMB-31, DHMB-30 and DHMB-16 were distinct and diverse and can be classified as promising genotypes. These genotypes can be used for inter-crossing to obtain heterosis and also wider variability in moth bean. Hybridization between the genotypes of cluster IV with the genotypes of cluster V may result in exploiting more heterosis with maximum genetic divergence and are likely to produce desirable transgressive segregants in segregating generations for further crop improvement.
.
References
Babbar, A
., V. Prakash, P. Tiwari and M. A. Iquebal. 2012. Genetic variability for chickpea under late sown season. Legume Res., 35 (1):1-7.Bangar, N. D., Amita Lakra and B. H. Chavan, 2009.
Genetic Divergence in moth
bean. J. Maharashtra agric. Univ., 34(1): 010-013.
Bhavsar, V. V. and S. P. Birari. 1991. Genetic Divergence in moth bean, [Vigna
aconitifolia (Jacq) marechal.] Biovigyanam, 17 (2): 118-120.
Das, A. M., K. Biswas and K. G. Dastidar. 2010. Genetic divergenece in green
gram (Vigna radiata). Scialert.net/abstract/doi : Ja.2010 .pp.126-130
Deokar, A. T., S. P. Birari and V. V. Bhavsar. 1991 Genetic Diversity in respect of
grain yield and its components in moth bean Vigna aconitifolia.
(Jacq ) Marechal] Annals Agril. Res., 12(1):83-87.
Gopalkrishna, J., B. Sunilkumar, and M. Prakash. 2012 Studies on genetic diversity in
mung bean (Vigna radiate L.). Legume Res., 35 (1) : 50-52.
Henry, A. and S. R. Krishna. 1986. Genetic divergence in moth bean. Indian J. Agric.
Sci. 56 (4): 298-299.
Jindal, S. K. 1990. Interspecific divergence in moth bean for grain yield and its
components. Annals Arid Zone, 27 (3-4): 267-270.
Kakani, R. K., R. C. Sharma and D. K. Garg. 2003. Genetic Divergence, variability
and character association in moth bean. Advances Arid Legumes Res.,
pp. 98-103.
Mahalanobis, P. C. 1936. On the generalized distance in statistics. Proc. Nat. Ins. Sci.,
India, 2 (1): 49-55.
Murty, B. R. and V. Arunachalam. 1966. The nature of divergence in relation to
breeding system in some crop plants. Indian J. Genet.Pl. Breed., 26; 188-198
Natarajan, C., K. Thiyagarajan and R. Rathnaswamy. 1988. Association and genetic diversity studies in green gram. Madras Agric. J. 75 (7-8) :238-245.
Patil, S .C., H. E. Patil and V. M .Jambhale. 2008. Genetic divergence studies in moth bean (Vigna aconitifolia). J.Maharashtra agric. Univ., 33(2):161-164
Rao, C. R. 1952. Advanced statistical methods in Biometrical Research. John Willey and Sons Inc., New York.
Somayajulu, P. L., A. B. Joshi, and B. R. Murty. 1970. Genetic divergence in wheat.
ISSN 0975-928X
http://ejplantbreeding.com 1151
India: retrospect and Prospects Director, . Govt. of India, Ministry of Agri. & Farmers Welfare (DAC&FW), Directorate of Pulses Development, Vindhyachal
Bhavan, Bhopal, M.P.- 462004,(Website: http://dpd.dacnet.nic.in, email
: [email protected], Printed Year-Nov., 2016) : 112-113.
Yogeesh, L. N., K. P. Viswanatha and B. A. Ganagaprasad. 2012. Genetic variability studies in moth bean germplasm for seed yield and its attributing
ISSN 0975-928X
1152
Table.1. Analysis of variance for different characters in moth bean.
SI. No. Characters Mean sum of square
Replication Genotype Error
1 Days to 50% flowering 1.96 1464.9** 2.82
2 Days to maturity 2.550 1273.26** 6.67
3 Length of main axis (cm) 9.490 9951.60** 35.49
4 Number of primary
branches 0.12 7.67** 0.19
5 Number of cluster per plant 0.034 419.32** 11.29
6 Number of pods per cluster 0.037 0.52** 0.02
7 Number of pods per plant 1.330 3303.82** 45.99
8 Pod length (cm) 0.011 0.108** 0.032
9 Number of seeds per pod 0.062 2.988** 0.139
10 100 seed weight (g) 0.011 0.290** 0.010
11 Grain yield per plant (g) 0.016 65.177** 0.957
*, ** Indicates significance at 5% and 1% level, respectively. Table 2. Mean performance of moth bean genotype.
SI. No. Genotypes Source Days to 50%
flowering
Days to maturity
Length of main axis
(cm)
No. of primary branches
No of clusters /plant
No of pods/ plant
Pod length
(cm) No of seeds / pod
100 seed weight (g)
Seed yield /plant (g)
1 MBS-0835 Solapur 99.33 148.67 130.78 6.73 58.88 1.62 95.39 3.58 6.67 2.25 10.06
2 MBS-0845 Solapur 93.33 143.00 148.71 4.37 41.35 1.53 63.73 3.24 6.08 2.04 6.04
3 MBS-0803 Solapur 91.67 141.67 153.13 3.89 29.70 1.65 49.61 3.26 5.95 2.40 4.76
4 MBS-0847 Solapur 99.66 149.33 146.27 4.71 25.42 2.41 61.67 3.23 6.21 2.43 6.55
ISSN 0975-928X
1153
6 MBS-0855 Solapur 94.33 146.67 143.47 5.32 36.96 1.84 68.31 3.18 6.05 2.14 6.35
7 MBS-0853-2 Solapur 93.00 145.00 145.56 4.77 34.40 1.69 59.97 3.49 6.72 2.14 6.15
8 MBS-0853-1 Solapur 93.00 143.00 149.15 5.01 38.85 1.75 68.12 2.99 6.13 2.07 6.02
9 MBS-0814 Solapur 93.67 143.33 149.75 4.37 36.24 1.49 54.21 3.14 6.56 2.29 5.85
10 MBS-0605 Solapur 98.67 146.67 141.15 5.63 37.32 2.17 81.53 3.56 6.53 2.35 8.39
11 MBS-0851 Solapur 99.33 144.33 143.06 6.00 38.90 2.23 85.60 3.33 6.29 2.20 8.44
12 MBS-27(C) Solapur 98.67 148.67 140.93 5.68 38.23 2.03 76.53 3.25 6.08 2.03 6.80
13 DHMB-1 Rahuri 50.67 104.67 16.15 2.99 15.71 1.32 20.75 3.64 4.67 1.58 1.88
14 DHMB-2 Kada 92.33 143.67 144.97 5.81 31.46 1.78 56.73 3.21 5.88 2.13 5.21
15 DHMB-3 Nandurbar 98.67 145.33 136.45 5.95 41.13 1.94 78.15 3.44 6.31 2.84 8.71
16 DHMB-4 Akole 95.33 148.67 150.27 4.32 31.03 1.57 47.12 3.43 6.59 2.21 4.79
17 DHMB-5 Man 104.67 154.00 137.29 8.10 57.52 1.88 108.17 3.83 6.90 2.56 12.98
ISSN 0975-928X
1154
Table 2 Continued…….
SI. No. Genotypes Source Days to 50%
flowering Days to maturity
Length of main axis (cm)
No. of primary branches
No of clusters /plant
No. of pods / cluster
No of pods/ plant
Pod length (cm)
No of seeds / pod
100 seed weight (g)
Seed yield /plant (g)
19191 DHMB-7 Nandurbar 95.67 145.67 151.03 4.6 35.97 1.39 50.97 3.08 6.20 2.13 4.18
20 DHMB-8 Sindakheda 46.00 103.67 16.18 3.39 18.68 1.43 26.72 3.51 3.70 1.55 2.12
21 DHMB-9 Rohane, 97.33 147.33 145.12 5.57 39.72 1.95 77.59 3.00 5.84 2.35 7.05
22 DHMB-10 Wambori, 47.33 105.33 14.67 2.87 20.37 1.25 24.47 3.36 3.31 2.03 1.94
23 DHMB-11 Dhule 54.33 102.00 16.54 2.56 14.78 1.53 22.62 3.45 4.70 2.66 2.17
24 DHMB-12 Baragaonnandur 97.67 148.00 138.66 5.07 33.78 2.25 76.56 3.11 6.19 2.14 7.32
25 DHMB-13 Baragaonnandur 59.67 110.33 14.48 2.71 16.10 1.62 26.38 3.55 4.68 2.52 2.38
26 DHMB-14 Dahiwade, 96.33 143.67 136.94 5.00 34.59 1.78 65.14 3.24 6.36 2.37 6.86
27 DHMB-15 Shevgaon, 90.33 139.33 149.80 4.53 33.57 1.43 49.73 3.18 6.45 2.13 4.82
28 DHMB-16 Shirur, 43.67 90.33 11.63 2.49 16.59 1.33 22.06 3.51 4.45 1.98 2.25
29 DHMB-17 Karjat, 98.67 146.33 143.25 5.75 35.89 1.87 67.12 3.30 6.21 2.85 7.63
30 DHMB-18 Shrigonda, 95.33 144.00 147.03 4.83 25.23 2.14 54.67 3.38 6.09 2.95 5.53
31 DHMB-19 Pathardi 46.67 100.67 14.64 4.50 28.21 1.34 38.87 3.66 4.20 2.29 2.60
32 DHMB-20 Akole, 97.33 141.67 146.05 5.12 34.00 2.10 67.87 3.38 6.09 2.08 6.63
33 DHMB-21 Pathardi 47.33 103.33 15.09 2.31 24.61 1.23 30.28 3.39 4.24 2.58 6.45
34 DHMB-22 Man 98.00 142.67 143.97 6.05 41.89 1.84 77.58 3.26 5.60 2.23 7.84
35 DHMB-23 Baramati, 51.33 109.33 16.46 4.57 31.30 1.36 42.61 3.75 4.66 2.24 3.04
36 DHMB-24 Karjat, 106.67 155.67 129.56 7.75 54.16 2.59 140.29 3.41 6.63 2.65 20.15
37 DHMB-25 Parner, 100.67 152.33 137.69 6.37 49.15 2.15 98.31 3.58 6.46 2.34 10.77
38 DHMB-26 Dhule 102.67 149.33 139.33 6.69 47.41 2.33 110.68 3.28 5.55 2.15 10.95
39 DHMB-27 Dhule 51.67 103.33 15.16 3.68 23.94 1.36 32.57 3.51 4.31 2.27 3.13
ISSN 0975-928X
1155
SI. No Genotypes Source Days to 50% flowering
Days to maturity
Length of main axis
(cm)
No. of primary branches
No of clusters /plant
No. of pods / cluster
No of pods/ plant
Pod length (cm)
No of seeds / pod
100 seed weight (g)
Seed yield /plant (g)
40 DHMB-28 Dhule 50.67 97.33 15.36 3.09 30.17 1.39 41.85 3.44 4.21 2.19 3.11
41 DHMB-29 Shrigond
a, 106.33 153.67 135.37 7.85 45.16 2.39 108.27 3.48 6.37 2.79 13.82
42 DHMB-30 Shewgao
n, 104.67 158.67 122.67 6.50 56.11 2.62 145.23 3.21 6.19 2.76 18.08
43 DHMB-31 Karjat, 105.67 156.33 124.26 8.78 56.73 2.53 143.53 3.51 6.61 2.71 20.64
44 DHMB-32 Ambega
on 103.33 150.66 143.21 6.67 47.75 2.42 113.24 3.25 5.38 2.84 12.51
G. Mean 84.93 135.09 107.44 5.01 35.08 1.79 66.05 3.37 5.67 2.32 6.94
S.E. ± 0.97 1.49 3.43 0.53 1.94 0.086 3.91 0.10 0.22 0.058 0.565
C.D. at 5
% 2.72 4.19 9.67 0.57 5.46 0.24 11.01 0.29 0.61 0.16 1.59
ISSN 0975-928X
1156
Table 3. Grouping of forty four moth bean genotypes into different clusters.
SI. No. Cluster No. of genotypes Name of genotypes
1 I 18 MBS-0828, DHMB-7, MBS- 0845, MBS-0814, DHMB-15, MBS-0853-2,
MBS-0853-1, DHMB-4, MBS-0855, DHMB-2, MBS-0803, DHMB-14, DHMB-9, MBS-27(C), DHMB-12, DHMB-22, DHMB-2O, MBS-0605
2 II 4 DHMB-24, DHMB-31, DHMB-30, DHMB-29
3 III 7 DHMB-3, DHMB-17, DHMB-18, MBS-0847, MBS-0851, DHMB-25,
DHMB-5
4 IV 12 DHMB-19, DHMB-23, DHMB-27, DHMB-21, DHMB-10, DHMB-6,
DHMB-28, DHMB-16, DHMB-1, DHMB-8, DHMB-11, DHMB-13
5 V 1 DHMB-32
6 VI 1 DHMB-26
7 VII 1 MBS-0835
Table 4.Average intra and inter cluster distance (D2 values) for eleven characters in moth bean.
(Underlined figures indicate intra-cluster D2 values.)
Clusters I II III IV V VI VII
I 3.85 10.52 5.72 24.31 8.80 7.41 6.04
II 4.17 8.29 28.95 5.96 7.37 10.44
III 4.90 26.43 5.99 6.27 7.39
IV 5.12 29.12 27.80 24.67
V 0.00 4.46 9.78
VI 0.00 8.43
ISSN 0975-928X
1157
Table 5. Cluster means for eleven characters in seven clusters of forty four moth bean genotypes SI. No.
Characters Cluster average Cluster
mean
I II III IV V VI VII
1 Days to 50% Flowering 95.11 103.83 99.57 49.97 103.33 102.67 99.33 93.41
2 Days to maturity 144.57 156.08 147.95 102.75 150.67 149.33 148.67 142.86
3 Length of main axis(cm) 146.15 127.89 141.58 15.07 143.21 139.33 130.78 120.57
4 No. of primary branches 4.95 7.72 5.96 3.14 6.67 6.69 6.73 5.98
5 No. of clusters / plant 35.93 53.04 39.03 21.51 47.75 47.41 58.88 43.6
6 No. of pods / cluster 1.76 2.53 2.09 1.36 2.42 2.33 1.62 2.02
7 No. of pods /plant 63.56 134.33 79.10 29.29 113.24 110.68 95.39 89.37
8 Pod length (cm) 3.23 3.40 3.44 3.51 3.25 3.28 3.58 3.38
9 No. of seeds /pod 6.18 6.45 6.35 4.19 5.38 5.55 6.67 5.82
10 100 seed weight (g) 2.19 2.73 2.60 2.19 2.84 2.15 2.25 2.42
11 Seed yield / plant (g) 6.11 18.17 8.66 2.41 12.51 10.95 10.06 9.84
Table 6. Relative percent contribution of different characters towards tota genetic divergence in moth bean.
SI. No. Characters No. of times ranked 1St Percent contribution
1 Days to 50% flowering 308 32.56
2 Days to maturit 33 3.49
3 Length of main axis (cm) 125 13.21
4 Number of primary branches 1 0.11
5 Number of cluster per plant 60 6.34
6 Number of pods per cluster 51 5.39
7 Number of pods per plant 77 8.14
8 Pod length (cm) 10 1.06
9 No of seeds per pod 100 10.57
10 100 seed weight (g) 132 13.95
ISSN 0975-928X
1158
ISSN 0975-928X
1159
ISSN 0975-928X
1160
M= The mean of seven clusters and four intra-clusters (as monogenotypic cluster V, VI and VII had no intra-cluster distance) was
11.69.
X= Minimum value of distance 3.85.
Y=Maximum valie of distance 29.12.
S=Standard deviation 8.95.
m-s= Mean - Standard deviation.
m+s= Mean + Standard deviation.
Fig 3. Divergence Classes (DC) of moth bean genotypes.