R E V I E W
Open Access
Yin Yang 1 is associated with cancer stem
cell transcription factors (SOX2, OCT4,
BMI1) and clinical implication
Samantha Kaufhold
1, Hermes Garbán
2*and Benjamin Bonavida
1*Abstract
The transcription factor Yin Yang 1 (YY1) is frequently overexpressed in cancerous tissues compared to normal
tissues and has regulatory roles in cell proliferation, cell viability, epithelial-mesenchymal transition, metastasis and
drug/immune resistance. YY1 shares many properties with cancer stem cells (CSCs) that drive tumorigenesis,
metastasis and drug resistance and are regulated by overexpression of certain transcription factors, including SOX2,
OCT4 (POU5F1), BMI1 and NANOG. Based on these similarities, it was expected that YY1 expression would be
associated with SOX2, OCT4, BMI1, and NANOG
’
s expressions and activities. Data mining from the proteomic
tissue-based datasets from the Human Protein Atlas were used for protein expression patterns of YY1 and the four
CSC markers in 17 types of cancer, including both solid and hematological malignancies. A close association was
revealed between the frequency of expressions of YY1 and SOX2 as well as SOX2 and OCT4 in all cancers analyzed.
Two types of dynamics were identified based on the nature of their association, namely, inverse or direct, between
YY1 and SOX2. These two dynamics define distinctive patterns of BMI1 and OCT4 expressions. The relationship
between YY1 and SOX2 expressions as well as the expressions of BMI1 and OCT4 resulted in the classification of
four groups of cancers with distinct molecular signatures:
1)
Prostate, lung, cervical, endometrial, ovarian and
glioma cancers (YY1
loSOX2
hiBMI1
hiOCT4
hi)
2)
Skin, testis and breast cancers (YY1
hiSOX2
loBMI1
hiOCT4
hi)
3)
Liver,
stomach, renal, pancreatic and urothelial cancers (YY1
loSOX2
loBMI1
hiOCT4
hi) and
4)
Colorectal cancer, lymphoma
and melanoma (YY1
hiSOX2
hiBMI1
loOCT4
hi). A regulatory loop is proposed consisting of the cross-talk between the
NF-kB/PI3K/AKT pathways and the downstream inter-regulation of target gene products YY1, OCT4, SOX2 and BMI1.
Keywords:
BMI1, Cancer stem cells, NANOG, OCT4, SOX2, Yin Yang 1
Background
General properties of cancer stem cells (CSCs)
Drug resistance and metastatic spread are two key
char-acteristics of tumors that make cancer so difficult to
eradicate. Tumors are comprised of heterogeneous cell
subpopulations, and these subsets respond distinctly and
differently to various therapeutics [1]. One subset of
these cells consists of cancer stem cells (CSCs), which
are largely similar to normal stem cells with respect to
both their behavior and their regulation [2]. CSCs are
pluripotent, capable of self-renewal, highly resistant to
cytotoxic therapies, and drive tumorigenesis.
In addition to different cellular responses, adaptive
changes like the epithelial to mesenchymal transition
(EMT) exacerbate metastatic spread and drug resistance.
EMT is the process by which epithelial cells lose their
apico-basolateral polarity to become migratory
mesen-chymal cells. This process is crucial to embryonic
differ-entiation but is dysregulated in cancer, affording tumor
cells invasive and migratory properties. EMT has been
shown to cause reversion to a CSC-like phenotype,
link-ing CSCs, EMT and drug resistance [3, 4].
Clearly, better molecular and biochemical
understand-ings of the phenotypic and functional properties of CSCs
will help in the development of novel and specific
tar-geted therapeutics to eradicate CSCs. Thus, these should
* Correspondence:hgarban@ucla.edu;bbonavida@mednet.ucla.edu
2NantBioScience, Inc, NantWorks, LLC & California NanoSystems Institute
(CnSI), University of California Los Angeles, Los Angeles, CA 90095, USA 1Department of Microbiology, Immunology, and Molecular Genetics, David
Geffen School of Medicine, University of California Los Angeles, Los Angeles, CA 90095, USA
reduce the inherent resistance and relapses and should
prolong survival. Below, we briefly present reported
studies on the various regulatory factors in the
develop-ment of CSCs.
CSC markers
The sex determining region Y-box 2
(SOX2),
POU class
5 homeobox 1
(POU5F1
), B cell-specific Moloney
mur-ine leukemia virus insertion site 1
(BMI1
) and Nanog
homeobox (
NANOG
) genes are four genes encoding
transcription factors that have been reported to be
in-volved in the regulation of CSCs. SOX2,
Octamer-binding transcription factor 4 (OCT4) (the transcription
factor encoded by
POU5F1
, also known as POU5F1) and
NANOG make up the core transcriptional network
re-sponsible for the regulation of stem cell self-renewal and
pluripotency [5].
SOX2
a) General properties of SOX2
The
SOX2
gene is located on chromosome
3q26.3-q27 [
6
,
7
]. The SOX2 protein is composed of 317
amino acids and has a mass of 34.3 kDa [
8
].
Originally characterized in 1994, SOX2 is a member
of the SOXB1 family of transcription factors, and its
three primary domains are an N-terminal domain, a
high-mobility group (HMG) domain, and a
transac-tivation domain [
9
]. Protein partners, nuclear import
signals, and nuclear export signals bind the HMG
domain, while the C-terminal transactivation domain
is responsible for promoter binding, causing the
acti-vation or repression of target genes [
10
].
b) SOX2 expression in various cancers
SOX2 is expressed in neural stem cells [
11
], breast
stem cells [
12
], and stem populations in the liver,
pancreas, and stomach [
13
]. SOX2 overexpression in
recurrent prostate cancer tissues has been reported
[
14
]. SOX2 is likewise overexpressed in head and
neck squamous cell carcinoma [
15
]. Bioinformatics
analysis showed
SOX2
overexpression in 7/36 solid
tumors analyzed [
16
].
Multiplication of the 3q26.3 gene locus causes SOX2
amplification, which has been reported in
glioblastoma, small-cell lung cancer and many
squa-mous cell carcinomas [
17
–
24
]. Co-amplification of
SOX2 and Protein Kinase CI
(PRKCI) has been
re-ported to be responsible for the CSC phenotype in
lung squamous cell carcinoma [
25
]. Additionally,
FGF induces SOX2 in osteoblasts [
26
].
c) SOX2 functions
In pancreatic cancer cells, SOX2 overexpression causes
increased cell proliferation via cyclin D3 induction
[
27
]. Subsequent SOX2 knockdown causes
transcriptional induction of p21
Cip1and p27
Kip1,
resulting in cell cycle arrest and cell growth inhibition
[
27
]. Similarly, SOX2 silencing inhibits cellular
proliferation in lung squamous cell carcinoma cells
[
28
]. The upregulation of BMP4, which acts as a
tumor suppressor, is responsible for this inhibition of
proliferation [
28
]. SOX2 silencing causes a decrease in
cell proliferation and loss of tumorigenicity in
glioblastoma tumor-initiating cells in immunodeficient
mice [
29
]. SOX2 has also been reported to promote
cellular proliferation in breast, prostate, and cervical
cancers, among others [
30
–
32
]. Furthermore, SOX2
has been implicated in the evasion of apoptotic signals
in prostate cancer, gastric cancer and NSCLC [
32
–
34
].
SOX2 has been reported to promote invasion,
migra-tion, and metastasis in melanoma, colorectal cancer,
glioma, gastric cancer, ovarian cancer and
hepatocellu-lar carcinoma [
20
,
35
–
38
]. SOX2 mediates invasive
and migratory phenotypes, in part, through MMP3,
MMP2, and PI3K/AKT/mTOR activations [
35
,
37
,
39
].
d) Regulation of SOX2
The ubiquitin-specific protease 22 (USP22) represses
the SOX2 promoter in embryonic differentiation [
40
].
Activation of EGFR signaling increases SOX2
expres-sion and self-renewal in prostate CSCs [
41
].
Further-more, an EGFR/STAT3/SOX2 signaling pathway has
been reported in murine breast cancer stem cells [
42
].
In primary melanoma cells, GLI1 and GLI2 have been
reported to bind the proximal
SOX2
promoter,
indicat-ing that SOX2 is regulated, in part, by Hedghog-GLI
signaling [
43
]. The PI3K/Akt signaling pathway has
been shown to be activated in prostate cancer cells
overexpressing SOX2 [
44
]. By contrast, ovarian
adeno-carcinoma cells overexpressing SOX2 have been
re-ported to possess an inhibited PI3K/Akt signaling
pathway [
45
]. These conflicting results suggest that
PI3K/Akt modulation may have an important role in
the expression of SOX2.
e) Clinical implications
OCT4
a) General properties of OCT4
The
POU5F1
gene is located on chromosome 6p21.33
[
6
,
55
]. There are 6 related pseudogenes on
chromosomes 1, 3, 8, 10 and 12 [
56
], and alternative
splicing results in multiple protein isoforms. The
canonical OCT4 protein sequence contains 360 amino
acids and weighs 38.6 kDa [
8
]. OCT4, also referred to
as POUF51 and OCT3/4, is another transcription
factor necessary for maintaining pluripotency [
57
]. The
POU domain is the main active domain for OCT4. The
POU domain is composed of two subdomains, an
amino-terminal POU specific region and a
carboxyl-terminal homeodomain, and both bind DNA through
helix-turn-helix structures [
58
].
b) OCT4 expression in various cancers
OCT4 is overexpressed in recurrent prostate cancer
tissues [
14
]. Bioinformatics analysis showed OCT4
overexpression in 9/36 of different solid tumor types
when compared to corresponding normal tissues
[
16
]. Namely, OCT4 was overexpressed in bladder,
brain, lung, ovarian, pancreatic, prostate, renal,
seminoma and testicular cancers. OCT4
overexpression was observed in 1/4 hematological
cancers
—
namely, chronic lymphocytic leukemia
—
in
the same study [
16
].
c) OCT4 functions
OCT4 works synergistically with SOX2, among
other factors, to regulate transcription. SOX2 and
OCT4 are both activators of genes involved in
pluripotency, including themselves and
NANOG
,
and repressors of genes involved in differentiation
(e.g.,
HOXB1, PAX6, MYF5
) [
59
,
60
]. SOX2 and
OCT4 interact directly to activate target gene
transcription [
61
]. OCT4/SOX2 heterodimers bind
the
NANOG
proximal promoter region to induce
transcription [
62
,
63
].
d) Regulation of OCT4
SOX2 and OCT4 regulate their own transcription by
binding the composite sox-oct elements in the
SOX2
and
POU5F1
enhancers [
64
]. In pluripotent stem
cells, Foxm1 directly binds the
POU5F1
promoter
−
3 kb upstream region [
65
]. Among others, SALL4,
ESRRB, and PAF1 have been implicated as positive
regulators of OCT4 expression, while TCF3, GCNF,
HIF and CDK2 have been identified as negative
reg-ulators [
66
].
e) Clinical implications
Like high SOX2 expression, high OCT4 expression
is associated with higher histological grade in
esophageal squamous cancer (
p
< 0.001) [
47
]. Both
NANOG and OCT4 overexpressions are associated
with both advanced cancer stage and decreased
survival in oral squamous cell and lung
adenocarcinomas [
67
].
NANOG
a) General properties of NANOG
The
NANOG
gene is located on chromosome
12p13.31 [
6
,
7
,
55
]. The 2184-nucleotide
NANOG
cDNA encodes the NANOG protein [
68
]. While
there are 11 NANOG pseudogenes [
69
], only
pseudogene 8 has an open reading frame capable of
producing the functional NANOG protein [
69
–
72
].
The canonical NANOG protein has a sequence of
305 amino acids and a mass of 34.6 kDa [
8
]. Another
isoform, NANOG-delta 48, lacks amino acids 168
–
183 and is, consequently, 289 amino acids long [
8
].
b) NANOG expression in various cancers
Both pluripotent mouse and human stem cell lines
express
NANOG
mRNA, but
NANOG
mRNA is
absent from differentiated cells [
73
]. NANOG
protein levels have been reported to be elevated in
oral squamous cell carcinoma tumor tissues as
compared to corresponding normal tissues (
p
=
0.014) [
74
].
c) NANOG functions
NANOG is capable of maintaining embryonic stem
cell pluripotency independently of the LIF-STAT3
pathway, which OCT4 is incapable of doing [
68
,
73
].
NANOG exerts many functions through its
tran-scriptional regulatory activities. NANOG regulates
the cell cycle and proliferation by directly binding
the cyclin D1 promoter [
75
,
76
]. In prostate cancer
cell lines, the induction of NANOG causes the
upre-gulations of CD133 and ALDH1 [
77
]. NANOG
alone is sufficient to induce SLUG transcription [
67
].
Furthermore, NANOG is capable of inducing
CSC-like properties in primary p53-deficient mature
mouse astrocytes; however, astrocytes with intact
p53 could not be induced [
78
]. Some functional
re-dundancy and cooperation between NANOG and
STAT3 have been reported. The two form a complex
in head and neck squamous cell carcinoma cells
[
79
], and microarray analysis showed that NANOG
also regulated 14 out of the 22 STAT3 target genes
involved in the maintenance of an undifferentiated
state [
80
].
d) Regulation of NANOG
In addition to OCT4/SOX2 heterodimers, NANOG is
regulated at a transcriptional level by multiple factors.
GLI1 and GLI2 activate
NANOG
transcription by
directly binding cis-regulatory sequences of the
NANOG
gene in neural stem cells [
81
]. In mouse
embryonic stem cells, p53 was shown to suppress
NANOG
transcription in response to DNA damage.
P53 directly binds the
NANOG
promoter through
two consensus binding motifs [
82
]. LIF-induced
STAT3 phosphorylation also results in the
upregula-tion of NANOG in embryonic stem cells [
83
].
e) Clinical implications
Increased nuclear NANOG expression has been
associated with high-grade subtypes of ovarian
can-cer and poor disease-free survival [
84
]. Additionally,
NANOG overexpression is correlated with poor
prognoses for colorectal and breast cancer patients,
as well as for ovarian cancer patients [
85
–
87
].
BMI1
a) General properties of BMI1
Ensembl identifies the
BMI1
gene as located on
chromosome 10p12.2. The BMI1 protein is
composed of 326 amino acids and has a mass of
36.9 kDa [
8
]. BMI1 is a member of the polycomb
repressive complex 1 (PRC1), which also includes
Mel-18, Mph1/Rae28, M33, Scmh1, and Ring 2. The
polycomb repressive complex 2 (PRC2) is comprised
of EED, EZH, Sux12 and YY1 [
88
].
b) BMI1 expression in various cancers
BMI1 expression levels have been reported to be
high in many tissues, including the brain, esophagus,
kidney, lungs, and blood, among others [
89
]. BMI1
levels are also elevated in various solid
tumor-forming cancers, among them neuroblastoma and
bladder cancer [
90
,
91
].
c) BMI1 functions
BMI1 is involved in the maintenance and/or
self-renewal of many stem cell types, including
embry-onic, neural, hematopoietic and prostate [
92
–
95
].
BMI1 promotes the proliferation of leukemic stem
cells in mouse models [
96
], and BMI1 activates the
self-renewal ability of neural stem cells [
97
].
BMI1 is directly responsible for the regulation of
multiple targets. BMI1 regulates the tumor
suppressors p16INK4a and p14ARF [
98
,
99
]. BMI1
also directly binds the
PTEN
promoter, resulting in
the activation of the PI3K/AKT pathway and
subsequently SNAIL stabilization and EMT
induction [
100
]. Additionally, BMI1 directly
occupies the
CDH1
promoter, causing E-cadherin
repression [
100
].
In endometrial cancer cells, the loss of BMI1 results
in the reduced expression of SOX2 and KLF4 [
101
].
CD133+ breast CSCs with high SLUG expression
have been shown to also have high BMI1 expression
[
102
]. Furthermore, BMI1 cooperates with TWIST1
to promote cancer dedifferentiation and metastasis
[
103
]. BMI1 overexpression correlates with NANOG
overexpression, high-grade status and increased
self-renewal in breast adenocarcinomas [
104
].
d) Regulation of BMI1
Multiple major regulatory pathways, including Akt,
Wnt and Notch, contribute to the regulation of
BMI1 [
105
]. Additionally, the Hedgehog pathway
activates BMI1 in breast stem cells [
106
].
e) Clinical implications
Elevated
BMI1
RNA levels have been correlated
with more advanced chronic myeloid leukemia
status [
96
,
107
]. Increased levels of BMI1 are
correlated with poor prognoses in head and neck
cancers [
103
], including in nasopharyngeal
carcinoma patients [
108
]. BMI1 is further
correlated with radio- and chemoresistance in head
and neck squamous cell carcinomas and is
considered to be a predictive factor for overall
survival [
109
]. In glioma, BMI1 expression inversely
correlates with survival and positively correlates
with poor prognosis [
110
]. In non-Hodgkin B-cell
lymphoma patients, BMI1 expression is associated
with poor outcome as well [
111
].
CSC markers
’
associations with drug resistance
Yin Yang 1 (YY1) and its relationship with CSC
transcription factors
General characteristics of YY1
Yin Yang 1 (YY1) is an ubiquitously expressed
zinc-finger transcription factor encoded by the 23 kb
YY1
gene [120
–
124]. Comprised of 414 amino acids, YY1
ex-erts various cellular functions, including transcriptional
regulation, cell proliferation, chromatin remodeling and
apoptosis [124
–
128]. YY1 regulates multiple targets,
in-cluding
ERBB2
,
p53
, caspases and HDACs, which are
implicated in cancer progression [127].
YY1 is overexpressed in many types of cancer, including
metastatic breast cancer [129, 130], colon cancer [131],
gastric cancer [132] and prostate cancer [133]. Patterns of
YY1 protein expression levels in human cancers have been
reviewed previously [134]. The enrichment of binding
sites for YY1 and NANOG was identified in the
interac-tomes of both
SOX2
and
POU5F1
[135]. Additionally,
YY1 upregulates NANOG in gastric cancer [136]. YY1 has
been previously reported to directly interact with
embry-onic ectoderm development (EED), a protein of the same
PcG family as BMI1 [137].
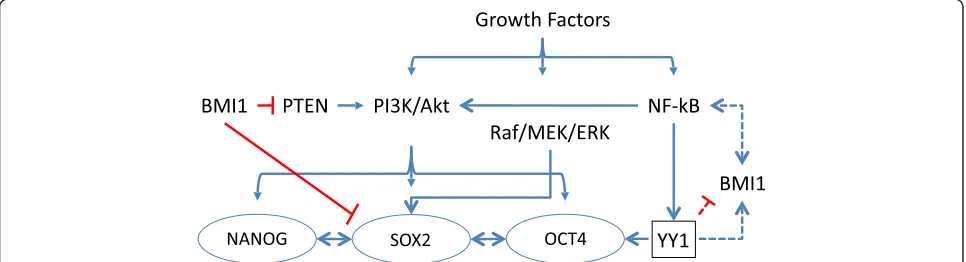
YY1 and its relationship to CSC transcription factors
There exist similar patterns of overexpression in various
cancerous tissues between the four CSC markers (SOX2,
OCT4, BMI1 and NANOG) and YY1. For example, the
overexpressions of YY1 [133], SOX2 and OCT4 [14] in
prostate cancer cell lines have been reported. These
find-ings suggested that there may be a functional correlation
between YY1 and the CSC markers (Fig. 1). Furthermore,
the binding site enrichment and interactions with NANOG
and EED suggest that YY1 may be associated with the CSC
transcription factors [135
–
137].
Data mining from proteomic datasets
Publicly available proteomics datasets were used to assess
whether YY1, SOX2, OCT4, NANOG and BMI1
expressions correlated in both solid tumors (
n
= 16) and
hematological malignancies (
n
= 1) [138].
1. SOX2, OCT4, NANOG and BMI1 were chosen as
representative CSC markers because of their
well-documented roles in stem cell maintenance as well
as data availability [
5
,
59
,
92
–
95
].
The Human Protein Atlas
’
Cancer Atlas feature
provides antibody staining information for many
proteins in various cancerous tissues [
139
]. The
antibodies used by the Human Protein Atlas for this
staining analysis are summarized in Table
1
. The
Cancer Atlas feature was interrogated to assess the
antibody staining of YY1, SOX2, OCT4, NANOG
and BMI1 in different cancer types. In each case, the
protein of interest was searched in the Cancer Atlas.
The resulting
“
staining overview
”
presented the
antibody staining profile, which differentiated stains
into high, medium, low or not detected groups, for
the protein in twenty types of cancers, namely,
breast, carcinoid, cervical, colorectal, endometrial,
glioma, head and neck, liver, lung, lymphoma,
melanoma, ovarian, pancreatic, prostate, renal, skin,
stomach, testis, thyroid and urothelial cancers. The
three cancers with sample sizes fewer than
four
—
carcinoid, head and neck, and thyroid
—
were
discarded, bringing the total types of cancers
considered herein to seventeen.
2. Example profile
SOX2 staining qualified as 0/12 high, 1/12 medium, 9/
12 low and 2/12 not detected in breast cancer. In this
case, 12 different tissues were stained from 12 different
patients. A binary system was then applied such that
only high or medium scores were considered positive
staining. To assess the percentage of positive staining,
the number of
“
positive
”
(high or medium) stains was
divided by the total number of stains performed. In the
SOX2 case presented above, (0 high +1 medium)/12
stains yields 1/12 positive staining.
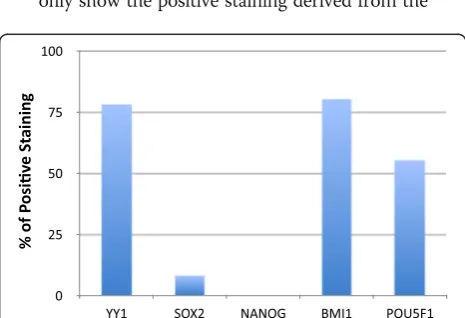
3. Example analysis
Breast cancer can be used as an example to illustrate
the complete process used by us for analysis for one
cancer type. The Human Protein Atlas
’
Cancer Atlas
reported that YY1 antibody HPA001119 yielded 2
high, 5 medium, 1 low and 1 not detected stains in
this type of cancer. Consequently, high and medium
scores comprised 7 out of a total 9 stains. In this
case, 78 % of the stains were above the binary
threshold and considered positive staining. YY1
antibody CAB009392 yielded 0 high, 6 medium, 5
low and 0 not detected stains, so the positive
staining was 6/11 or 55 %. As previously described,
the SOX2 antibody CAB010648 profile was 0 high, 1
medium, 9 low and 2 not detected stains. Only 1/12
stains exceeded the binary threshold for 8 % positive
staining. NANOG antibody CAB019380 was never
detected in breast cancer and had 0 % positive
staining. By these same processes, it was determined
that BMI1 antibody HPA030472 had 10/11 (91 %),
BMI1 antibody CAB011120 had 8/10 (80 %), OCT4
antibody CAB025600 had 11/11 (100 %) and OCT4
antibody CAB026380 had 5/9 (55 %) positive
staining.
4. Antibody selection
We have selected only one antibody staining profile
for each protein that was stained by two different
antibodies. This choice was based on the
recommendation of the Human Protein Atlas itself
and was performed for the sake of simplifying ensuing
analyses. The final antibodies used were YY1 antibody
HPA001119, SOX2 antibody CAB010648, NANOG
antibody CAB019380, BMI1 antibody CAB011120
and OCT4 antibody CAB026380 (Table
1
). Of note,
YY1 antibody HPA01119 appears to show
cross-reactivity with related protein YY2 (based on an 80 %
amino acid homology), and thus, cross-reactivity
be-tween family members by the various antibodies used
must be considered with the results. It is impossible
to ignore the possibilities that the noted expression
correlations are instead between YY2 and CSC
transcription factors, or that there is a functional
redundancy between YY1 and YY2 that cannot be
distinguished. To that end, the development of
YY1-specific antibodies is necessary to validate these
findings in vitro. Western blots should be conducted
to confirm these findings experimentally.
5. Further analyses
These procedures were repeated for each antibody
in each type of cancer and used to produce binary
expression graphs and corresponding statistical
analyses. The example breast cancer binary
frequency of the protein expression graph was used
as a prototype (Fig.
2
). The binary expression graphs
only show the positive staining derived from the
Table 1
Selected antibodies characteristics
YY1 antibody HPA001119
SOX2 antibody CAB010648
NANOG antibody CAB019380
BMI1 antibody CAB011120
OCT4 antibody CAB026380
Provider Atlas Antibodies,
Sigma-Aldrich
Chemicon SDIX Upstate SDIX
Product name HPA001119 AB5603 2929.00.02 05–637 3542.00.02
Host species Rabbit Rabbit Rabbit Mouse Rabbit
Clonality pAb pAb msAb mAb msAb
Antigen Recombinant
protein fragment
Synthetic peptide Genetic immunization
Recombinant protein
Genetic immunization
Cross reactivity YY2 (80 %) N/A N/A N/A N/A
high and medium staining of each antibody in breast
cancer. Two-factor without replication analysis of
variance was applied to analyze the source of
vari-ation between the different antibody staining figures.
Pearson correlations were performed to compare the
staining of each antibody of each marker to the
others. Post-hoc t-tests also assessed the significance
between YY1 and CSC marker expressions. From
these data, patterns of YY1, SOX2, OCT4, NANOG
and BMI1 protein expressions were elucidated and
evaluated.
Clustered expression analyses
Through the grouping of marker expression patterns,
our analyses identified four distinct tiers of cancers
(Additional file 1: Figure S1). Initially, two distinct
dynamics were identified: in clusters one and two, YY1
and SOX2 expressions share an inverse relationship,
while in clusters three and four, YY1 and SOX2
expres-sions have a strong direct correlation. The two types of
relationship between YY1 and SOX2 expression appear
to dictate distinctive patterns of expression of BMI1 and
OCT4. These patterns of expression between YY1,
SOX2, OCT4 and BMI1 were used to classify the four
tiers.
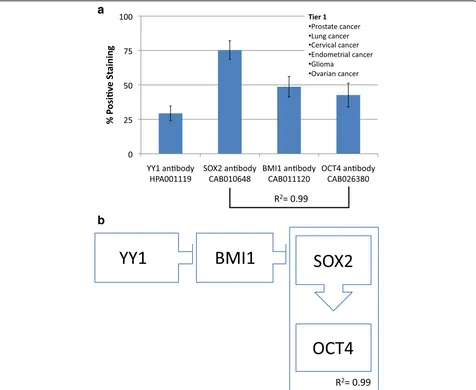
Tier 1
The first group consists of prostate, lung, cervical,
endo-metrial and ovarian cancers as well as glioma. This
group shows low YY1 expression with concomitant high
SOX2, BMI1 and OCT4 expressions (Fig. 3). Of note,
Fig. 3aFrequency of Protein expression. Antibody staining for glioma, prostate, lung, cervical, endometrial, and ovarian cancers (Tier 1). SOX2 and OCT4 have a strong direct correlation (R2= 0.99).bHypothetical functional dynamic of CSC-related transcription factors. Correlations of the
comparison of SOX2 and OCT4 expressions yields an
R
2value of 0.99, indicating a strong direct correlation.
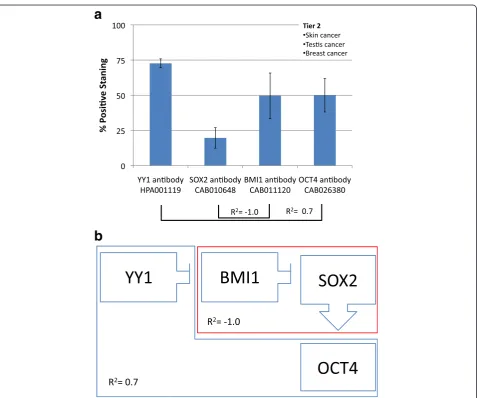
Tier 2
Tier two, characterized by high YY1 and low SOX2, is
found in skin, testis and breast cancers. SOX2 and BMI1
have a strong inverse correlation (R
2=
−
1.0) and YY1
has a direct correlation with OCT4 expression (R
2= 0.7).
These findings show an overall pattern of high YY1, low
SOX2, high BMI1 and high OCT4 (Fig. 4).
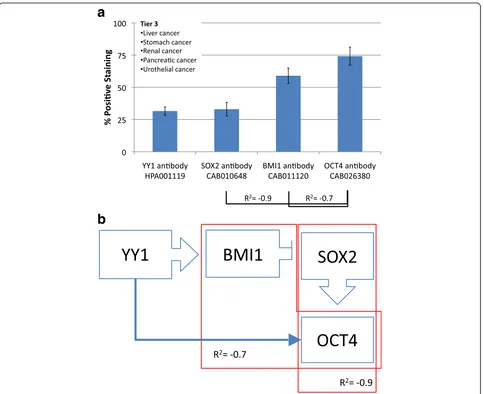
Tier 3
Liver, stomach, renal, pancreatic and urothelial cancers
make up the third tier. This cluster has low YY1 and low
SOX2 expressions. SOX2 and OCT4 have a strong
in-verse correlation (R
2=
−
0.9), and BMI1 and OCT4 also
have an inverse correlation (R
2=
−
0.7). This group has a
molecular signature of low YY1 and SOX2 with high
BMI1 and OCT4 (Fig. 5).
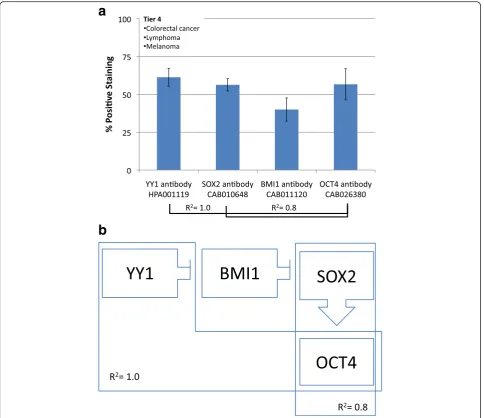
Tier 4
The fourth tier has high YY1 and high SOX2. This group
consists of colorectal cancer, lymphoma and melanoma.
YY1 and SOX2 both share strong direct correlations
with OCT4 expression (R
2= 1.0 and 0.8, respectively). In
this case, YY1, SOX2 and OCT4 all have high
expres-sions while BMI1 has low expression (Fig. 6).
Overarching results
Taken together, tiers one and two show a strong inverse
correlation between YY1 and SOX2 (R
2=
−
0.9). On the
contrary, tiers three and four show a strong direct
Fig. 4aFrequency of Protein expression. Antibody staining for skin, testis and breast cancers (Tier 2). YY1 is positively associated with OCT4 (R2=
0.7), while SOX2 is negatively associated with BMI1 (R2=−1.0).bHypothetical functional dynamic of CSC-related transcription factors. Correlations
correlation between YY1 and SOX2 expressions (R
2= 0.8).
These associations were the initial basis for the
distinc-tions among the four tiers. The tiers were then further
subdivided based on the specific frequency of expression
patterns of BMI1 and OCT4. When tiers three and four
are grouped together, such that the results from liver,
stomach, renal, pancreatic, urothelial cancers, lymphoma
and melanoma are pooled, there is also a strong inverse
correlation between YY1 and BMI1 expressions (R
2=
−
0.7). YY1 expression correlates strongly and differentially
with the CSC markers
’
expression in the different tiers.
Conclusions, implications and speculations
YY1 frequency of expression was associated with the
SOX2, BMI1 and OCT4 frequency of expression across
many cancers, though the type of association varied. The
differential patterns of the four markers
’
expressions
among the different tiers can be explained by the dual
nature of YY1
’
s activities as both an activator and a
re-pressor and in a direct or an indirect manner. We have
examined the putative regulatory regions (promoters) of
BMI1, SOX2, POU5F1 (OCT4) and YY1 for potential
YY1 binding sites and reciprocal control of each other in
a combinatorial matrix by using SABioscience
’
s
Text-Mining Application [140] and data from the University
of California, Santa Cruz (UCSC) Genome Browser
[141] in order to define predicted binding sites
associa-tions of transcription factors to their regulatory regions.
Our analysis demonstrated the presence of putative YY1
binding sites on all of the regulatory regions of the
inter-rogated transcription factors (i.e., BMI1, SOX2, OCT4)
including YY1 itself. However, none of the putative
tran-scription binding sites for BMI1, SOX2, OCT4 were
found on the YY1 or on each other
’
s regulatory regions.
Fig. 5aFrequency of Protein expression. Antibody staining for liver, stomach, renal, pancreatic and urothelial cancers (Tier 3). There areNoteworthy, a strong association (predicted binding site)
was noted between NF-
κ
B on the YY1 regulatory region
and also between YY1 on the BMI1 promoter, suggesting
a plausible transcriptional control by these factors.
The transcriptional association of YY1 on the
regula-tory regions of BMI1, SOX2, OCT4 and YY1 suggests a
multi-dynamic regulatory control of expression. There is
an NF-
κ
B-mediated induction of expression of YY1 that
can: a) inhibit the transcription of BMI1 and increase
the expression of SOX2, resulting in up-regulation of
OCT4 (e.g., Tier 1, Tier 2 and Tier 4 of the clustered
groups); or b) activate the transcription of BMI1 and
de-crease the expression of SOX2, resulting in
down-regulation of OCT4; or c) directly activate transcription
of OCT4 (e.g., Tier 3 of clustered groups). Overall, the
majority of the malignancies examined in this study have
YY1 as a potential transcriptional repressor acting on
CSCs-associated transcription factors.
Additional file
Additional file 1: Figure S1.Clustered Expression Association. Results were cluster-associated in 4 groups (tiers) based on the percentage of positive staining (Frequency of protein expression). Green boxes,≧50 % positive staining. Blue boxes, <50 % positive staining. (JPG 66 kb)
Abbreviations
Akt:protein kinase B; BMI1: B cell-specific Moloney murine leukemia virus in-sertion site 1; CSCs: cancer stem cells; EMT: epithelial-mesenchymal transition; NF-κB: nuclear factor kappa-B; PI3K: phosphatidylinositol 3-kinase; POUF51: POU class 5 homeobox 1; SOX2: sex determining region Y-box 2; YY1: Ying Yang 1.
Acknowledgments
The authors also acknowledge the research support for the reported publications used in this review and include: the Jonsson Comprehensive Cancer Center at UCLA; the University of California Gene Medicine Program; the UCLA AIDS Institute; the NCI-RO1-CA133479; NCICA107023-02S1; NCICA05715213S1; NIHR21149938.
Authors’contributions
SK was responsible for data collection and drafting the manuscript. HG contributed to study design, data analysis and manuscript editing. BB conceived of the project and edited the manuscript. All authors approved of the final manuscript.
Competing interests
The authors declare that they have no competing interest.
Received: 29 January 2016 Accepted: 9 May 2016
References
1. Zhou BB, Zhang H, Damelin M, Geles KG, Grindley JC, Dirks PB. Tumour-initiating cells: challenges and opportunities for anticancer drug discovery. Nat Rev Drug Discov. 2009;8(10):806–23.
2. Lobo NA, Shimono Y, Qian D, Clarke MF. The biology of cancer stem cells. Annu Rev Cell Dev Biol. 2007;23:675–99.
3. Mani SA, Guo W, Liao MJ, Eaton EN, Ayyanan A, Zhou AY, Brooks M, Reinhard F, Zhang CC, Shipitsin M, et al. The epithelial-mesenchymal transition generates cells with properties of stem cells. Cell. 2008;133(4): 704–15.
4. Polyak K, Weinberg RA. Transitions between epithelial and mesenchymal states: acquisition of malignant and stem cell traits. Nat Rev Cancer. 2009;9(4):265–73. 5. Kanehisa M, Goto S, Sato Y, Kawashima M, Furumichi M, Tanabe M. Data,
information, knowledge and principle: back to metabolism in KEGG. Nucleic Acids Res. 2014;42(Database issue):D199–205.
6. HUGO Gene Nomenclature Committee (HGNC).http://www.genenames.org. 7. Entrez Gene [http://www.ncbi.nlm.nih.gov/gene]
8. Uniprot [http://www.uniprot.org]
9. Stevanovic M, Zuffardi O, Collignon J, Lovell-Badge R, Goodfellow P. The cDNA sequence and chromosomal location of the human SOX2 gene. Mamm Genome. 1994;5(10):640–2.
10. Weina K, Utikal J. SOX2 and cancer: current research and its implications in the clinic. Clin Transl Med. 2014;3:19.
11. Thiel G. How Sox2 maintains neural stem cell identity. Biochem J. 2013;450(3):e1–2.
12. Hassiotou F, Beltran A, Chetwynd E, Stuebe AM, Twigger AJ, Metzger P, Trengove N, Lai CT, Filgueira L, Blancafort P, et al. Breastmilk is a novel source of stem cells with multilineage differentiation potential. Stem Cells. 2012;30(10):2164–74.
13. Sherwood RI, Chen TY, Melton DA. Transcriptional dynamics of endodermal organ formation. Dev Dyn. 2009;238(1):29–42.
14. Guzel E, Karatas OF, Duz MB, Solak M, Ittmann M, Ozen M. Differential expression of stem cell markers and ABCG2 in recurrent prostate cancer. Prostate. 2014;74(15):1498–505.
15. Lee SH, Oh SY, Do SI, Lee HJ, Kang HJ, Rho YS, Bae WJ, Lim YC. SOX2 regulates self-renewal and tumorigenicity of stem-like cells of head and neck squamous cell carcinoma. Br J Cancer. 2014;111(11):2122–30.
16. Schoenhals M, Kassambara A, De Vos J, Hose D, Moreaux J, Klein B. Embryonic stem cell markers expression in cancers. Biochem Biophys Res Commun. 2009;383(2):157–62.
17. Hussenet T, Dali S, Exinger J, Monga B, Jost B, Dembele D, Martinet N, Thibault C, Huelsken J, Brambilla E, et al. SOX2 is an oncogene activated by recurrent 3q26.3 amplifications in human lung squamous cell carcinomas. PLoS ONE. 2010;5(1):e8960.
18. Albertson DG. Gene amplification in cancer. Trends Genet. 2006;22(8):447–55. 19. Annovazzi L, Mellai M, Caldera V, Valente G, Schiffer D. SOX2 expression and
amplification in gliomas and glioma cell lines. Cancer Genomics Proteomics. 2011;8(3):139–47.
20. Alonso MM, Diez-Valle R, Manterola L, Rubio A, Liu D, Cortes-Santiago N, Urquiza L, Jauregi P, Lopez de Munain A, Sampron N, et al. Genetic and epigenetic modifications of Sox2 contribute to the invasive phenotype of malignant gliomas. PLoS ONE. 2011;6(11), e26740.
21. Bass AJ, Watanabe H, Mermel CH, Yu S, Perner S, Verhaak RG, Kim SY, Wardwell L, Tamayo P, Gat-Viks I, et al. SOX2 is an amplified lineage-survival oncogene in lung and esophageal squamous cell carcinomas. Nat Genet. 2009;41(11):1238–42.
22. Maier S, Wilbertz T, Braun M, Scheble V, Reischl M, Mikut R, Menon R, Nikolov P, Petersen K, Beschorner C, et al. SOX2 amplification is a common event in squamous cell carcinomas of different organ sites. Hum Pathol. 2011;42(8):1078–88.
23. Rudin CM, Durinck S, Stawiski EW, Poirier JT, Modrusan Z, Shames DS, Bergbower EA, Guan Y, Shin J, Guillory J, et al. Comprehensive genomic analysis identifies SOX2 as a frequently amplified gene in small-cell lung cancer. Nat Genet. 2012;44(10):1111–6.
24. Freier K, Knoepfle K, Flechtenmacher C, Pungs S, Devens F, Toedt G, Hofele C, Joos S, Lichter P, Radlwimmer B. Recurrent copy number gain of transcription factor SOX2 and corresponding high protein expression in oral squamous cell carcinoma. Genes Chromosomes Cancer. 2010;49(1):9–16. 25. Justilien V, Walsh MP, Ali SA, Thompson EA, Murray NR, Fields AP. The PRKCI
and SOX2 oncogenes are coamplified and cooperate to activate Hedgehog signaling in lung squamous cell carcinoma. Cancer Cell. 2014;25(2):139–51. 26. Mansukhani A, Ambrosetti D, Holmes G, Cornivelli L, Basilico C. Sox2
induction by FGF and FGFR2 activating mutations inhibits Wnt signaling and osteoblast differentiation. J Cell Biol. 2005;168(7):1065–76.
27. Herreros-Villanueva M, Zhang JS, Koenig A, Abel EV, Smyrk TC, Bamlet WR, de Narvajas AA, Gomez TS, Simeone DM, Bujanda L, et al. SOX2 promotes dedifferentiation and imparts stem cell-like features to pancreatic cancer cells. Oncogenesis. 2013;2, e61.
28. Fang WT, Fan CC, Li SM, Jang TH, Lin HP, Shih NY, Chen CH, Wang TY, Huang SF, Lee AY, et al. Downregulation of a putative tumor suppressor BMP4 by SOX2 promotes growth of lung squamous cell carcinoma. Int J Cancer. 2014;135(4):809–19.
29. Gangemi RM, Griffero F, Marubbi D, Perera M, Capra MC, Malatesta P, Ravetti GL, Zona GL, Daga A, Corte G. SOX2 silencing in glioblastoma tumor-initiating cells causes stop of proliferation and loss of tumorigenicity. Stem Cells. 2009;27(1):40–8.
30. Stolzenburg S, Rots MG, Beltran AS, Rivenbark AG, Yuan X, Qian H, Strahl BD, Blancafort P. Targeted silencing of the oncogenic transcription factor SOX2 in breast cancer. Nucleic Acids Res. 2012;40(14):6725–40.
31. Ji J, Zheng PS. Expression of Sox2 in human cervical carcinogenesis. Hum Pathol. 2010;41(10):1438–47.
32. Jia X, Li X, Xu Y, Zhang S, Mou W, Liu Y, Liu Y, Lv D, Liu CH, Tan X, et al. SOX2 promotes tumorigenesis and increases the anti-apoptotic property of human prostate cancer cell. J Mol Cell Biol. 2011;3(4):230–8.
33. Hutz K, Mejias-Luque R, Farsakova K, Ogris M, Krebs S, Anton M, Vieth M, Schuller U, Schneider MR, Blum H, et al. The stem cell factor SOX2 regulates the tumorigenic potential in human gastric cancer cells. Carcinogenesis. 2014;35(4):942–50.
34. Chen S, Li X, Lu D, Xu Y, Mou W, Wang L, Chen Y, Liu Y, Li X, Li LY, et al. SOX2 regulates apoptosis through MAP4K4-survivin signaling pathway in human lung cancer cells. Carcinogenesis. 2014;35(3):613–23.
35. Han X, Fang X, Lou X, Hua D, Ding W, Foltz G, Hood L, Yuan Y, Lin B. Silencing SOX2 induced mesenchymal-epithelial transition and its expression predicts liver and lymph node metastasis of CRC patients. PLoS ONE. 2012;7(8), e41335.
37. Girouard SD, Laga AC, Mihm MC, Scolyer RA, Thompson JF, Zhan Q, Widlund HR, Lee CW, Murphy GF. SOX2 contributes to melanoma cell invasion. Lab Invest. 2012;92(3):362–70.
38. Lou X, Han X, Jin C, Tian W, Yu W, Ding D, Cheng L, Huang B, Jiang H, Lin B. SOX2 targets fibronectin 1 to promote cell migration and invasion in ovarian cancer: new molecular leads for therapeutic intervention. OMICS. 2013;17(10):510–8.
39. Yang N, Hui L, Wang Y, Yang H, Jiang X. SOX2 promotes the migration and invasion of laryngeal cancer cells by induction of MMP-2 via the PI3K/Akt/ mTOR pathway. Oncol Rep. 2014;31(6):2651–9.
40. Sussman RT, Stanek TJ, Esteso P, Gearhart JD, Knudsen KE, McMahon SB. The epigenetic modifier ubiquitin-specific protease 22 (USP22) regulates embryonic stem cell differentiation via transcriptional repression of sex-determining region Y-box 2 (SOX2). J Biol Chem. 2013;288(33):24234–46. 41. Rybak AP, Tang D. SOX2 plays a critical role in EGFR-mediated
self-renewal of human prostate cancer stem-like cells. Cell Signal. 2013; 25(12):2734–42.
42. Yang J, Liao D, Chen C, Liu Y, Chuang TH, Xiang R, Markowitz D, Reisfeld RA, Luo Y. Tumor-associated macrophages regulate murine breast cancer stem cells through a novel paracrine EGFR/Stat3/Sox-2 signaling pathway. Stem Cells. 2013;31(2):248–58.
43. Santini R, Pietrobono S, Pandolfi S, Montagnani V, D’Amico M, Penachioni JY, Vinci MC, Borgognoni L, Stecca B. SOX2 regulates self-renewal and tumorigenicity of human melanoma-initiating cells. Oncogene. 2014;33(38): 4697–708.
44. Li D, Zhao LN, Zheng XL, Lin P, Lin F, Li Y, Zou HF, Cui RJ, Chen H, Yu XG. Sox2 is involved in paclitaxel resistance of the prostate cancer cell line PC-3 via the PI3K/Akt pathway. Mol Med Rep. 2014;10(6):3169–76.
45. Li Y, Chen K, Li L, Li R, Zhang J, Ren W. Overexpression of SOX2 is involved in paclitaxel resistance of ovarian cancer via the PI3K/Akt pathway. Tumour Biol. 2015.
46. Yang S, Zheng J, Xiao X, Xu T, Tang W, Zhu H, Yang L, Zheng S, Dong K, Zhou G, et al. SOX2 promotes tumorigenicity and inhibits the differentiation of I-type neuroblastoma cells. Int J Oncol. 2015;46(1):317–23.
47. Wang Q, He W, Lu C, Wang Z, Wang J, Giercksky KE, Nesland JM, Suo Z. Oct3/4 and Sox2 are significantly associated with an unfavorable clinical outcome in human esophageal squamous cell carcinoma. Anticancer Res. 2009;29(4):1233–41.
48. Toschi L, Finocchiaro G, Nguyen TT, Skokan MC, Giordano L, Gianoncelli L, Perrino M, Siracusano L, Di Tommaso L, Infante M, et al. Increased SOX2 gene copy number is associated with FGFR1 and PIK3CA gene gain in non-small cell lung cancer and predicts improved survival in early stage disease. PLoS ONE. 2014;9(4), e95303.
49. Wilbertz T, Wagner P, Petersen K, Stiedl AC, Scheble VJ, Maier S, Reischl M, Mikut R, Altorki NK, Moch H, et al. SOX2 gene amplification and protein overexpression are associated with better outcome in squamous cell lung cancer. Mod Pathol. 2011;24(7):944–53.
50. Dogan I, Kawabata S, Bergbower E, Gills JJ, Ekmekci A, Wilson W, 3rd, Rudin CM, Dennis PA. SOX2 expression is an early event in a murine model of EGFR mutant lung cancer and promotes proliferation of a subset of EGFR mutant lung adenocarcinoma cell lines. Lung Cancer. 2014;85(1):1–6. 51. Chen Y, Huang Y, Huang Y, Chen J, Wang S, Zhou J. The prognostic value
of SOX2 expression in non-small cell lung cancer: a meta-analysis. PLoS ONE. 2013;8(8), e71140.
52. Velcheti V, Schalper K, Yao X, Cheng H, Kocoglu M, Dhodapkar K, Deng Y, Gettinger S, Rimm DL. High SOX2 levels predict better outcome in non-small cell lung carcinomas. PLoS ONE. 2013;8(4), e61427.
53. Dhodapkar KM, Gettinger SN, Das R, Zebroski H, Dhodapkar MV. SOX2-specific adaptive immunity and response to immunotherapy in non-small cell lung cancer. Oncoimmunology. 2013;2(7), e25205.
54. Niu CS, Li DX, Liu YH, Fu XM, Tang SF, Li J. Expression of NANOG in human gliomas and its relationship with undifferentiated glioma cells. Oncol Rep. 2011;26(3):593–601.
55. Ensemble [http://uswest.ensembl.org/index.html]
56. RefSeq [http://www.ncbi.nlm.nih.gov/nuccore?LinkName=gene_nuccore_ refseqrna&from_uid=5460]
57. Nichols J, Zevnik B, Anastassiadis K, Niwa H, Klewe-Nebenius D, Chambers I, Scholer H, Smith A. Formation of pluripotent stem cells in the mammalian embryo depends on the POU transcription factor Oct4. Cell. 1998;95(3):379–91. 58. Scholer HR, Ciesiolka T, Gruss P. A nexus between Oct-4 and E1A: implications
for gene regulation in embryonic stem cells. Cell. 1991;66(2):291–304.
59. Boyer LA, Lee TI, Cole MF, Johnstone SE, Levine SS, Zucker JP, Guenther MG, Kumar RM, Murray HL, Jenner RG, et al. Core transcriptional regulatory circuitry in human embryonic stem cells. Cell. 2005;122(6):947–56. 60. Chen X, Xu H, Yuan P, Fang F, Huss M, Vega VB, Wong E, Orlov YL, Zhang
W, Jiang J, et al. Integration of external signaling pathways with the core transcriptional network in embryonic stem cells. Cell. 2008;133(6):1106–17. 61. Ambrosetti DC, Scholer HR, Dailey L, Basilico C. Modulation of the activity of
multiple transcriptional activation domains by the DNA binding domains mediates the synergistic action of Sox2 and Oct-3 on the fibroblast growth factor-4 enhancer. J Biol Chem. 2000;275(30):23387–97.
62. Kuroda T, Tada M, Kubota H, Kimura H, Hatano SY, Suemori H, Nakatsuji N, Tada T. Octamer and Sox elements are required for transcriptional cis regulation of Nanog gene expression. Mol Cell Biol. 2005;25(6):2475–85. 63. Do HJ, Lee WY, Lim HY, Oh JH, Kim DK, Kim JH, Kim T, Kim JH. Two potent
transactivation domains in the C-terminal region of human NANOG mediate transcriptional activation in human embryonic carcinoma cells. J Cell Biochem. 2009;106(6):1079–89.
64. Chew JL, Loh YH, Zhang W, Chen X, Tam WL, Yeap LS, Li P, Ang YS, Lim B, Robson P, et al. Reciprocal transcriptional regulation of Pou5f1 and Sox2 via the Oct4/Sox2 complex in embryonic stem cells. Mol Cell Biol. 2005;25(14): 6031–46.
65. Xie Z, Tan G, Ding M, Dong D, Chen T, Meng X, Huang X, Tan Y. Foxm1 transcription factor is required for maintenance of pluripotency of P19 embryonal carcinoma cells. Nucleic Acids Res. 2010;38(22):8027–38. 66. Jerabek S, Merino F, Scholer HR, Cojocaru V. OCT4: dynamic DNA binding
pioneers stem cell pluripotency. Biochim Biophys Acta. 2014;1839(3):138–54. 67. Chiou SH, Wang ML, Chou YT, Chen CJ, Hong CF, Hsieh WJ, Chang HT,
Chen YS, Lin TW, Hsu HS, et al. Coexpression of Oct4 and Nanog enhances malignancy in lung adenocarcinoma by inducing cancer stem cell-like properties and epithelial-mesenchymal transdifferentiation. Cancer Res. 2010;70(24):10433–44.
68. Mitsui K, Tokuzawa Y, Itoh H, Segawa K, Murakami M, Takahashi K, Maruyama M, Maeda M, Yamanaka S. The homeoprotein Nanog is required for maintenance of pluripotency in mouse epiblast and ES cells. Cell. 2003; 113(5):631–42.
69. Booth HA, Holland PW. Eleven daughters of NANOG. Genomics. 2004; 84(2):229–38.
70. Ibrahim EE, Babaei-Jadidi R, Saadeddin A, Spencer-Dene B, Hossaini S, Abuzinadah M, Li N, Fadhil W, Ilyas M, Bonnet D, et al. Embryonic NANOG activity defines colorectal cancer stem cells and modulates through AP1- and TCF-dependent mechanisms. Stem Cells. 2012;30(10): 2076–87.
71. Zhang J, Wang X, Li M, Han J, Chen B, Wang B, Dai J. NANOGP8 is a retrogene expressed in cancers. FEBS J. 2006;273(8):1723–30. 72. Fairbanks DJ, Fairbanks AD, Ogden TH, Parker GJ, Maughan PJ. NANOGP8:
evolution of a human-specific retro-oncogene. G3 (Bethesda). 2012;2(11):1447–57.
73. Chambers I, Colby D, Robertson M, Nichols J, Lee S, Tweedie S, Smith A. Functional expression cloning of Nanog, a pluripotency sustaining factor in embryonic stem cells. Cell. 2003;113(5):643–55.
74. Fu TY, Hsieh IC, Cheng JT, Tsai MH, Hou YY, Lee JH, et al. Association of OCT4, SOX2, and NANOG expression with oral squamous cell carcinoma progression. J Oral Pathol Med. 2015.
75. Han J, Zhang F, Yu M, Zhao P, Ji W, Zhang H, Wu B, Wang Y, Niu R. RNA interference-mediated silencing of NANOG reduces cell proliferation and induces G0/G1 cell cycle arrest in breast cancer cells. Cancer Lett. 2012; 321(1):80–8.
76. Choi SC, Choi JH, Park CY, Ahn CM, Hong SJ, Lim DS. Nanog regulates molecules involved in stemness and cell cycle-signaling pathway for maintenance of pluripotency of P19 embryonal carcinoma stem cells. J Cell Physiol. 2012;227(11):3678–92.
77. Jeter CR, Liu B, Liu X, Chen X, Liu C, Calhoun-Davis T, Repass J, Zaehres H, Shen JJ, Tang DG. NANOG promotes cancer stem cell characteristics and prostate cancer resistance to androgen deprivation. Oncogene. 2011;30(36): 3833–45.
78. Moon JH, Kwon S, Jun EK, Kim A, Whang KY, Kim H, Oh S, Yoon BS, You S. Nanog-induced dedifferentiation of p53-deficient mouse astrocytes into brain cancer stem-like cells. Biochem Biophys Res Commun. 2011;412(1): 175–81.
chemoresistance in hyaluronan/CD44-activated head and neck squamous cell carcinoma cells. Oncogene. 2012;31(2):149–60.
80. Bourillot PY, Aksoy I, Schreiber V, Wianny F, Schulz H, Hummel O, Hubner N, Savatier P. Novel STAT3 target genes exert distinct roles in the inhibition of mesoderm and endoderm differentiation in cooperation with Nanog. Stem Cells. 2009;27(8):1760–71.
81. Po A, Ferretti E, Miele E, De Smaele E, Paganelli A, Canettieri G, Coni S, Di Marcotullio L, Biffoni M, Massimi L, et al. Hedgehog controls neural stem cells through p53-independent regulation of Nanog. EMBO J. 2010;29(15): 2646–58.
82. Golubovskaya VM. FAK and Nanog cross talk with p53 in cancer stem cells. Anticancer Agents Med Chem. 2013;13(4):576–80.
83. Suzuki A, Raya A, Kawakami Y, Morita M, Matsui T, Nakashima K, Gage FH, Rodriguez-Esteban C, Izpisua Belmonte JC. Nanog binds to Smad1 and blocks bone morphogenetic protein-induced differentiation of embryonic stem cells. Proc Natl Acad Sci U S A. 2006;103(27):10294–9.
84. Siu MK, Wong ES, Kong DS, Chan HY, Jiang L, Wong OG, Lam EW, Chan KK, Ngan HY, Le XF, et al. Stem cell transcription factor NANOG controls cell migration and invasion via dysregulation of E-cadherin and FoxJ1 and contributes to adverse clinical outcome in ovarian cancers. Oncogene. 2013; 32(30):3500–9.
85. Nagata T, Shimada Y, Sekine S, Hori R, Matsui K, Okumura T, Sawada S, Fukuoka J, Tsukada K. Prognostic significance of NANOG and KLF4 for breast cancer. Breast Cancer. 2014;21(1):96–101.
86. Lee M, Nam EJ, Kim SW, Kim S, Kim JH, Kim YT. Prognostic impact of the cancer stem cell-related marker NANOG in ovarian serous carcinoma. Int J Gynecol Cancer. 2012;22(9):1489–96.
87. Meng HM, Zheng P, Wang XY, Liu C, Sui HM, Wu SJ, Zhou J, Ding YQ, Li J. Over-expression of Nanog predicts tumor progression and poor prognosis in colorectal cancer. Cancer Biol Ther. 2010;9(4):295–302.
88. Raaphorst FM. Deregulated expression of Polycomb-group oncogenes in human malignant lymphomas and epithelial tumors. Hum Mol Genet. 2005; 14(Spec No 1):R93–100.
89. Huber GF, Albinger-Hegyi A, Soltermann A, Roessle M, Graf N, Haerle SK, Holzmann D, Moch H, Hegyi I. Expression patterns of Bmi-1 and p16 significantly correlate with overall, disease-specific, and recurrence-free survival in oropharyngeal squamous cell carcinoma. Cancer. 2011;117(20): 4659–70.
90. Nowak K, Kerl K, Fehr D, Kramps C, Gessner C, Killmer K, Samans B, Berwanger B, Christiansen H, Lutz W. BMI1 is a target gene of E2F-1 and is strongly expressed in primary neuroblastomas. Nucleic Acids Res. 2006;34(6): 1745–54.
91. Shafaroudi AM, Mowla SJ, Ziaee SA, Bahrami AR, Atlasi Y, Malakootian M. Overexpression of BMI1, a polycomb group repressor protein, in bladder tumors: a preliminary report. Urol J. 2008;5(2):99–105.
92. Fasano CA, Dimos JT, Ivanova NB, Lowry N, Lemischka IR, Temple S. shRNA knockdown of Bmi-1 reveals a critical role for p21-Rb pathway in NSC self-renewal during development. Cell Stem Cell. 2007;1(1):87–99.
93. Yadirgi G, Leinster V, Acquati S, Bhagat H, Shakhova O, Marino S. Conditional activation of Bmi1 expression regulates self-renewal, apoptosis, and differentiation of neural stem/progenitor cells in vitro and in vivo. Stem Cells. 2011;29(4):700–12.
94. Oguro H, Yuan J, Ichikawa H, Ikawa T, Yamazaki S, Kawamoto H, Nakauchi H, Iwama A. Poised lineage specification in multipotential hematopoietic stem and progenitor cells by the polycomb protein Bmi1. Cell Stem Cell. 2010;6(3): 279–86.
95. Lukacs RU, Memarzadeh S, Wu H, Witte ON. Bmi-1 is a crucial regulator of prostate stem cell self-renewal and malignant transformation. Cell Stem Cell. 2010;7(6):682–93.
96. Lessard J, Sauvageau G. Bmi-1 determines the proliferative capacity of normal and leukaemic stem cells. Nature. 2003;423(6937):255–60. 97. Molofsky AV, He S, Bydon M, Morrison SJ, Pardal R. Bmi-1 promotes neural
stem cell self-renewal and neural development but not mouse growth and survival by repressing the p16Ink4a and p19Arf senescence pathways. Genes Dev. 2005;19(12):1432–7.
98. Park IK, Morrison SJ, Clarke MF. Bmi1, stem cells, and senescence regulation. J Clin Invest. 2004;113(2):175–9.
99. Dimri GP, Martinez JL, Jacobs JJ, Keblusek P, Itahana K, Van Lohuizen M, Campisi J, Wazer DE, Band V. The Bmi-1 oncogene induces telomerase activity and immortalizes human mammary epithelial cells. Cancer Res. 2002;62(16):4736–45.
100. Song LB, Li J, Liao WT, Feng Y, Yu CP, Hu LJ, Kong QL, Xu LH, Zhang X, Liu WL, et al. The polycomb group protein Bmi-1 represses the tumor suppressor PTEN and induces epithelial-mesenchymal transition in human nasopharyngeal epithelial cells. J Clin Invest. 2009;119(12):3626–36. 101. Dong P, Kaneuchi M, Watari H, Hamada J, Sudo S, Ju J, Sakuragi N.
MicroRNA-194 inhibits epithelial to mesenchymal transition of endometrial cancer cells by targeting oncogene BMI-1. Mol Cancer. 2011;10:99. 102. Storci G, Sansone P, Trere D, Tavolari S, Taffurelli M, Ceccarelli C, Guarnieri T,
Paterini P, Pariali M, Montanaro L, et al. The basal-like breast carcinoma phenotype is regulated by SLUG gene expression. J Pathol. 2008;214(1):25–37. 103. Yang MH, Hsu DS, Wang HW, Wang HJ, Lan HY, Yang WH, Huang CH, Kao
SY, Tzeng CH, Tai SK, et al. Bmi1 is essential in Twist1-induced epithelial-mesenchymal transition. Nat Cell Biol. 2010;12(10):982–92.
104. Paranjape AN, Balaji SA, Mandal T, Krushik EV, Nagaraj P, Mukherjee G, Rangarajan A. Bmi1 regulates self-renewal and epithelial to mesenchymal transition in breast cancer cells through Nanog. BMC Cancer. 2014;14:785. 105. Wicha MS. Targeting self-renewal, an Achilles’heel of cancer stem cells. Nat
Med. 2014;20(1):14–5.
106. Liu S, Dontu G, Mantle ID, Patel S, Ahn NS, Jackson KW, Suri P, Wicha MS. Hedgehog signaling and Bmi-1 regulate self-renewal of normal and malignant human mammary stem cells. Cancer Res. 2006;66(12):6063–71. 107. Mohty M, Yong AS, Szydlo RM, Apperley JF, Melo JV. The polycomb group
BMI1 gene is a molecular marker for predicting prognosis of chronic myeloid leukemia. Blood. 2007;110(1):380–3.
108. Song LB, Zeng MS, Liao WT, Zhang L, Mo HY, Liu WL, Shao JY, Wu QL, Li MZ, Xia YF, et al. Bmi-1 is a novel molecular marker of nasopharyngeal carcinoma progression and immortalizes primary human nasopharyngeal epithelial cells. Cancer Res. 2006;66(12):6225–32.
109. Vormittag L, Thurnher D, Geleff S, Pammer J, Heiduschka G, Brunner M, Grasl M, Erovic BM. Co-expression of Bmi-1 and podoplanin predicts overall survival in patients with squamous cell carcinoma of the head and neck treated with radio(chemo)therapy. Int J Radiat Oncol Biol Phys. 2009;73(3):913–8.
110. Li J, Gong LY, Song LB, Jiang LL, Liu LP, Wu J, Yuan J, Cai JC, He M, Wang L, et al. Oncoprotein Bmi-1 renders apoptotic resistance to glioma cells through activation of the IKK-nuclear factor-kappaB Pathway. Am J Pathol. 2010;176(2):699–709.
111. van Kemenade FJ, Raaphorst FM, Blokzijl T, Fieret E, Hamer KM, Satijn DP, Otte AP, Meijer CJ. Coexpression of BMI-1 and EZH2 polycomb-group proteins is associated with cycling cells and degree of malignancy in B-cell non-Hodgkin lymphoma. Blood. 2001;97(12):3896–901.
112. Piva M, Domenici G, Iriondo O, Rabano M, Simoes BM, Comaills V, Barredo I, Lopez-Ruiz JA, Zabalza I, Kypta R, et al. Sox2 promotes tamoxifen resistance in breast cancer cells. EMBO Mol Med. 2014;6(1):66–79.
113. Yang L, Zhang X, Zhang M, Zhang J, Sheng Y, Sun X, Chen Q, Wang LX. Increased Nanog expression promotes tumor development and Cisplatin resistance in human esophageal cancer cells. Cell Physiol Biochem. 2012;30(4):943–52.
114. Du Y, Shi L, Wang T, Liu Z, Wang Z. Nanog siRNA plus Cisplatin may enhance the sensitivity of chemotherapy in esophageal cancer. J Cancer Res Clin Oncol. 2012;138(10):1759–67.
115. Tsai LL, Yu CC, Chang YC, Yu CH, Chou MY. Markedly increased Oct4 and Nanog expression correlates with cisplatin resistance in oral squamous cell carcinoma. J Oral Pathol Med. 2011;40(8):621–8.
116. Crea F, Duhagon Serrat MA, Hurt EM, Thomas SB, Danesi R, Farrar WL. BMI1 silencing enhances docetaxel activity and impairs antioxidant response in prostate cancer. Int J Cancer. 2011;128(8):1946–54.
117. Zhang S, Balch C, Chan MW, Lai HC, Matei D, Schilder JM, Yan PS, Huang TH, Nephew KP. Identification and characterization of ovarian cancer-initiating cells from primary human tumors. Cancer Res. 2008; 68(11):4311–20.
118. Wang E, Bhattacharyya S, Szabolcs A, Rodriguez-Aguayo C, Jennings NB, Lopez-Berestein G, Mukherjee P, Sood AK, Bhattacharya R. Enhancing chemotherapy response with Bmi-1 silencing in ovarian cancer. PLoS ONE. 2011;6(3), e17918.
119. Yin T, Wei H, Gou S, Shi P, Yang Z, Zhao G, Wang C. Cancer stem-like cells enriched in Panc-1 spheres possess increased migration ability and resistance to gemcitabine. Int J Mol Sci. 2011;12(3):1595–604.
121. Park K, Atchison ML. Isolation of a candidate repressor/activator, NF-E1 (YY-1, delta), that binds to the immunoglobulin kappa 3’enhancer and the immunoglobulin heavy-chain mu E1 site. Proc Natl Acad Sci U S A. 1991; 88(21):9804–8.
122. Hariharan N, Kelley DE, Perry RP. Delta, a transcription factor that binds to downstream elements in several polymerase II promoters, is a functionally versatile zinc finger protein. Proc Natl Acad Sci U S A. 1991;88(21):9799–803. 123. Flanagan JR, Becker KG, Ennist DL, Gleason SL, Driggers PH, Levi BZ, Appella
E, Ozato K. Cloning of a negative transcription factor that binds to the upstream conserved region of Moloney murine leukemia virus. Mol Cell Biol. 1992;12(1):38–44.
124. Thomas MJ, Seto E. Unlocking the mechanisms of transcription factor YY1: are chromatin modifying enzymes the key? Gene. 1999;236(2):197–208. 125. Shi Y, Lee JS, Galvin KM. Everything you have ever wanted to know about
Yin Yang 1. Biochim Biophys Acta. 1997;1332(2):F49–66.
126. Liu H, Shi Y. Yin Yang 1. In: Iuchi S, Kuldell N, editors. Zinc Finger Proteins: From Atomic Contact to Cellular Function. 1st ed. New York: Springer US; 2005. p. 182–94.
127. Gordon S, Akopyan G, Garban H, Bonavida B. Transcription factor YY1: structure, function, and therapeutic implications in cancer biology. Oncogene. 2006;25(8):1125–42.
128. Wilkinson FH, Park K, Atchison ML. Polycomb recruitment to DNA in vivo by the YY1 REPO domain. Proc Natl Acad Sci U S A. 2006;103(51):19296–301. 129. Thomassen M, Tan Q, Kruse TA. Gene expression meta-analysis identifies
metastatic pathways and transcription factors in breast cancer. BMC Cancer. 2008;8:394.
130. Wan M, Huang W, Kute TE, Miller LD, Zhang Q, Hatcher H, Wang J, Stovall DB, Russell GB, Cao PD, et al. Yin Yang 1 plays an essential role in breast cancer and negatively regulates p27. Am J Pathol. 2012;180(5):2120–33. 131. Chinnappan D, Xiao D, Ratnasari A, Andry C, King TC, Weber HC.
Transcription factor YY1 expression in human gastrointestinal cancer cells. Int J Oncol. 2009;34(5):1417–23.
132. Kang W, Tong JH, Chan AW, Zhao J, Dong Y, Wang S, Yang W, Sin FM, Ng SS, Yu J, et al. Yin Yang 1 contributes to gastric carcinogenesis and its nuclear expression correlates with shorter survival in patients with early stage gastric adenocarcinoma. J Transl Med. 2014;12:80.
133. Seligson D, Horvath S, Huerta-Yepez S, Hanna S, Garban H, Roberts A, Shi T, Liu X, Chia D, Goodglick L, et al. Expression of transcription factor Yin Yang 1 in prostate cancer. Int J Oncol. 2005;27(1):131–41.
134. Bonavida B, Kaufhold S. Prognostic significance of YY1 protein expression and mRNA levels by bioinformatics analysis in human cancers: a therapeutic target. Pharmacol Ther. 2015;150:149–68.
135. Gao F, Wei Z, An W, Wang K, Lu W. The interactomes of POU5F1 and SOX2 enhancers in human embryonic stem cells. Sci Rep. 2013;3:1588. 136. Wang AM, Huang TT, Hsu KW, Huang KH, Fang WL, Yang MH, Lo SS, Chi
CW, Lin JJ, Yeh TS. Yin Yang 1 is a target of microRNA-34 family and contributes to gastric carcinogenesis. Oncotarget. 2014;5(13):5002–16. 137. Satijn DP, Hamer KM, den Blaauwen J, Otte AP. The polycomb group
protein EED interacts with YY1, and both proteins induce neural tissue in Xenopus embryos. Mol Cell Biol. 2001;21(4):1360–9.
138. Uhlen M, Fagerberg L, Hallstrom BM, Lindskog C, Oksvold P, Mardinoglu A, Sivertsson A, Kampf C, Sjostedt E, Asplund A, et al. Proteomics. Tissue-based map of the human proteome. Science. 2015;347(6220):1260419.
139. Human Protein Atlas [http://www.proteinatlas.org/cancer]
140. SABioscience’s Text-Mining Application [http://www.sabiosciences.com/ chipqpcrsearch.php?app=TFBS]
141. University of California, Santa Cruz (UCSC) Genome Browser [https:// genome.ucsc.edu]
• We accept pre-submission inquiries
• Our selector tool helps you to find the most relevant journal
• We provide round the clock customer support
• Convenient online submission
• Thorough peer review
• Inclusion in PubMed and all major indexing services
• Maximum visibility for your research
Submit your manuscript at www.biomedcentral.com/submit