R E S E A R C H
Open Access
Integrated multi-omic analysis of
host-microbiota interactions in acute oak decline
Martin Broberg
1,2, James Doonan
1, Filip Mundt
3, Sandra Denman
4and James E. McDonald
1*Abstract
Background:Britain’s native oak species are currently under threat from acute oak decline (AOD), a decline-disease where stem bleeds overlying necrotic lesions in the inner bark and larval galleries of the bark-boring beetle,Agrilus biguttatus, represent the primary symptoms. It is known that complex interactions between the plant host and its microbiome, i.e. the holobiont, significantly influence the health status of the plant. In AOD, necrotic lesions are caused by a microbiome shift to a pathobiome consisting predominantly ofBrenneria goodwinii,Gibbsiella quercinecans,Rahnella victorianaand potentially other bacteria. However, the specific mechanistic processes of the microbiota causing tissue necrosis, and the host response, have not been established and represent a barrier to understanding and managing this decline.
Results:We profiled the metagenome, metatranscriptome and metaproteome of inner bark tissue from AOD symptomatic and non-symptomatic trees to characterise microbiota-host interactions. Active bacterial virulence factors such as plant cell wall-degrading enzymes, reactive oxygen species defence and flagella in AOD lesions, along with host defence responses including reactive oxygen species, cell wall modification and defence regulators were identified.B.goodwiniidominated the lesion microbiome, with significant expression of virulence factors such as the phytopathogen effectoravrE. A smaller proportion of microbiome activity was attributed toG.quercinecansandR.victoriana. In addition, we describe for the first time the potential role of two previously uncharacterised Gram-positive bacteria predicted from metagenomic binning and identified as active in the AOD lesion metatranscriptome and metaproteome, implicating them in lesion formation.
Conclusions:This multi-omic study provides novel functional insights into microbiota-host interactions in AOD, a complex arboreal decline disease where polymicrobial-host interactions result in lesion formation on tree stems. We present the first descriptions of holobiont function in oak health and disease, specifically, the relative lesion activity ofB.goodwinii,G. quercinecans,Rahnella victorianaand other bacteria. Thus, the research presented here provides evidence of some of the mechanisms used by members of the lesion microbiome and a template for future multi-omic research into holobiont characterisation, plant polymicrobial diseases and pathogen defence in trees.
Keywords:Holobiont, Multi-omics, Meta-omics, Microbiome, Microbiota, Plant-microbiome interactions
Background
The current global spread of tree diseases and pests are threatening the diversity, visual aesthetics and ecological roles of forests [1]. Oak trees (Quercus roburand Quer-cus petraea) constitute an iconic and fundamental part of British forests and are currently under threat from an episode of acute oak decline (AOD), a complex decline-disease resulting from a combination of several biotic and abiotic factors [2]. AOD is potentially lethal to the trees and has been primarily spreading through southern
and central England, and southern Wales [3]. The decline-disease shares similarities to oak declines re-ported in mainland Europe [4]. The primary symptoms of AOD consist of stem bleeds, cracks in the outer bark plates, necrotic tissue in the underlying inner bark and larval galleries of the bark-boring beetleAgrilus bigutta-tus in close proximity to the lesions [5,6]. Recently, we identified several bacterial species, Brenneria goodwinii, Gibbsiella quercinecans and Rahnella victoriana, as key members of the AOD lesion microbiome [2,4] and dem-onstrated through infectivity studies thatB.goodwiniiand G.quercinecans cause tissue maceration in the inner bark, the primary symptom of AOD [4]. TheEnterobacteriaceae, to whichG.quercinecansbelongs,Yersiniaceaeto whichR. * Correspondence:[email protected]
1School of Biological Sciences, Bangor University, Memorial Building, Deiniol
Road, Bangor, Gwynedd LL57 2UW, UK
Full list of author information is available at the end of the article
victorianabelongs andPectobacteriaceae, to whichB. good-winii belongs, include widespread and well-characterised plant-associated bacteria, acting either beneficially or as phytopathogens, with common virulence-associated fea-tures such as plant cell wall-degrading enzymes (PCWDEs), protein transport systems, effector proteins, motility and toxin production [7]. However, the specific functional mechanisms that underlie and trigger lesion formation by B. goodwinii and G. quercinecans are unknown and cur-rently represent a significant barrier to understanding the aetiology of AOD, and ultimately in managing the decline. Furthermore, the roles ofR.victorianaand other abundant members of the AOD lesion microbiome, as symbionts or pathogens, and their interactions with the host or other members of the microbiota are poorly understood. The AOD microbiome therefore represents an excellent model system that provide new insights into plant holobionts. Here, we performed multi-omic analysis of host-microbiota interactions in non-symptomatic and AOD symptomatic oak in order to understand the functional shifts and mech-anistic processes underlying polybacterial lesion formation and host defences in AOD. The results will therefore pro-vide insights into the triggers and functional mechanisms of lesion formation, allow identification of key causal agents of the decline, identify candidate markers for rapid field diagnostic tests and ascertain potential markers for future breeding of resistant oak, all of which will contribute to future management of the decline.
The microbiome is increasingly recognised as crucial to the understanding of plant health [8]. Indeed, microbiomes have been characterised across the roots, stems and leaves of model plants, transforming our understanding of beneficial and deleterious interactions within the holobiont [9–11]. While the stem microbiome has been generally less explored than the phylloplane (foliage) or the rhizosphere in trees, it may perform important functions, for example nitrogen fixation [9]. Holistic analysis of the microbiome and its interactions with the host by high-throughput gen-omics, transcriptomics and proteomics (multi-omics) has become highlighted as an important area in plant research [8,12,13]. Metagenomics provides gene inventories of en-vironmental samples that are/can be linked to specific functions, while metatranscriptomics and metaproteomics demonstrate gene activity [14–16]. These methods serve to identify and profile the phenotype of the holobiont, a term increasingly used to describe the combination of host and microbiome, across time and space, with metage-nomics identifying the hologenome of the holobiont [17,18]. Thus, it is important to obtain information and evidence showing the mechanisms of functional change as the healthy microbiome of oak succumbing to AOD shifts into an AOD microbiome, and where otherwise, benign mi-crobes may become opportunistic pathobionts and increase/change in activity [4].
Our study had four aims: (1) to expand upon the
known taxonomic composition of AOD-associated
microbiota by performing bioinformatic genome recon-struction from metagenomic data of organisms un-detected by previous taxonomic analyses, in order to gain further clarity of the composition of the micro-biome; (2) to identify the functional activity, host-microbe interactions and relative importance ofB. good-winii, G. quercinecans, R. victoriana and other bacteria in the AOD microbiome in lesion formation using their complete genome sequences for mapping of our meta-omic data; (3) to investigate the possibility of functional genes belonging to other bacteria of interest identified by Denman et al. [4] in AOD lesion formation and host infection dynamics; and (4) to investigate the oak host response in AOD, in order to understand the aetiology and host reaction to infection in active AOD lesions. To achieve these aims, we performed the first parallel multi-omic analysis of inner bark from non-symptomatic oak trees (no symptoms of poor health) and lesion tissue from oaks affected by AOD (clearly visible active stem lesions and reduced crowns), demonstrating that B. goodwiniiis the most active member of the AOD lesion microbiome, driving tissue maceration and host defence suppression. Furthermore, through assembly of draft genomes from metagenome datasets, we identified at least two bacterial taxa in the AOD microbiome that had not previously been identified, belonging to theClostridioides and Carnobac-terium genera, but exhibiting virulence-associated tran-scriptomic and proteomic activity in AOD lesions. This suggests that the AOD lesion microbiome is even more complicated than previously thought, and further research into the Gram-positive component is required.
Results
Functional potential of the AOD lesion microbiome and identification of two abundant Gram-positive bacteria through metagenome binning
the host DNA was depleted using an NEB Next Micro-biome enrichment kit in order to focus on the microbiota for this stage of the analysis. The functional potential of the microbiome was initially identified using MG-RAST [19] (Additional file 1: Table S1, Additional file 2: Table S2, Additional file 3: Table S3, Additional file 4: Table S4, Additional file 5: Table S5, Additional file 6: Table S6, Additional file7: Table S7 and Additional file8: Table S8), revealing that approximately 67–95% of the predicted genes in AOD lesion microbiomes were bacterial, whereas only 0.6–6% of genes in non-symptomatic samples were derived from bacteria. Functional microbiome analysis of SEED subsystem gene category abundances (functional gene categories) demonstrated a clear distinction between symptomatic and non-symptomatic samples, corroborat-ing previous investigations of the AOD microbiome shift, and providing a genetic database for our holistic multi-omic analysis (Fig. 1a) [2–4, 6]. Specifically, the MG-RAST analysis demonstrated that functional SEED subsys-tem gene category abundances, associated with normal plant activity were significantly more abundant in non-symptomatic tree samples, while those associated with
bacterial activity, bacteriophage activity and plant defence were more abundant in symptomatic trees (Additional file9: Table S9, Fig.1b).
The metagenome databases of annotated genes were combined revealing 627 distinct genes identified in all symptomatic samples, but undetected and thus considered absent in the non-symptomatic samples (Additional file10: Table S10). These genes were 99% bacterial and included proteins involved in virulence (membrane transport, PCWDEs, iron scavenging, motility and chemotaxis, stress responses and regulation). In contrast, 223 dis-tinct genes (80% plant associated, 20% fungal), in-volved mainly in general metabolism, were identified in all non-symptomatic samples, but in none of the symptomatic samples (Additional file 11: Table S11).
Although several new species of bacteria have been isolated from AOD lesions, it was important to attempt to identify any as-yet uncultivated microorganisms in the AOD lesion microbiome that may play an important role in lesion formation. Using metagenomic binning, we generated two draft genomes belonging to the genera Clostridioides and Carnobacterium, and other bacteria
(Additional file12: Table S12), from metagenomic reads, thus extending the AOD-associated microbiome of puta-tively unculturable organisms for further analysis. The predicted genome sizes were 5.45 and 2.42 Mbp and the genome completions were 97.5 and 66.7%, respectively for the Clostridioides and Carnobacterium bacteria, and both exhibiting < 5% contamination. However, as no ribosomal RNAs were identified in the Clostridioides genome, both genomes were determined to be medium quality drafts as outlined in the guidelines by Bowers et al. [20]. These genomes were annotated and found to contain PCWDE, secretion systems, catalases and ROS-defence associated genes, flagella and other virulence-associated genes (Additional file 12: Table S12 and Additional file 13). As a contrast to large public data-bases such as Swissprot where our newly identified bacterial species are not yet represented, the annotated genomes were combined into a narrowed-down database for specified bioinformatic analysis, containing the anno-tated oak transcriptome from NCBI (Additional file 14: Table S13), the annotated genomes of AOD-associated bacteriaB. goodwinii, G. quercinecans, R.victorianaand other bacteria whose genomes had homology to AOD lesion metagenome coding domains; Escherichia coli, Dickeya dadantii, Pectobacterium carotovorum, Erwinia billingae, Serratia marcescens and Clavibacter michiga-nensis (Additional file 13). This database allowed us to specifically clarify the activity of each bacterial organism of interest in the AOD microbiome, as well as specify which host genes and proteins are active.
Metatranscriptome analysis reveals active host defences and the primary active pathogens of the AOD
microbiome
We performed metatranscriptome analysis of symptomatic and non-symptomatic inner bark tissue to identify the func-tional activity of the host and its microbiota and to specific-ally determine the function and relative role ofB.goodwinii, G. quercinecans, R. victoriana and other bacteria in the AOD lesion microbiome. The metatranscriptomes were profiled and compared across samples (Additional file 15: Table S14, Additional file 16: Table S15, Additional file 17: Table S16, Additional file18: Table S17, Additional file19: Table S18, Additional file20: Table S19 and Additional file21: Table S20). In symptomatic tissue, 11–21% of anno-tated predicted transcripts were bacterial (2–3% in non-symptomatic tissue) (Additional file 15: Table S14, Additional file16: Table S15, Additional file17: Table S16, Additional file18: Table S17, Additional file19: Table S18, Additional file 20: Table S19 and Additional file 21: Table S20). These data demonstrate that the genetic shift in the metagenome also translates into an enhanced functional activity of bacteria.
We identified 216 transcripts present in all AOD symp-tomatic samples but absent in non-sympsymp-tomatic trees (based on annotation, Additional file22: Table S21). Of the symptomatic transcripts, 94% were associated with bacteria, partly involved in virulence (regulation, membrane trans-port, signalling, biofilm, sporulation and PCWDEs), the remaining 6% were associated partly with plant defence and cell wall synthesis, revealing increased bacterial phyto-pathogenic activity in symptomatic tissue. Conversely, 263 transcripts were identified across all non-symptomatic samples, but not in any symptomatic sample (97% eukaryotic, 3% bacterial, Additional file23: Table S22).
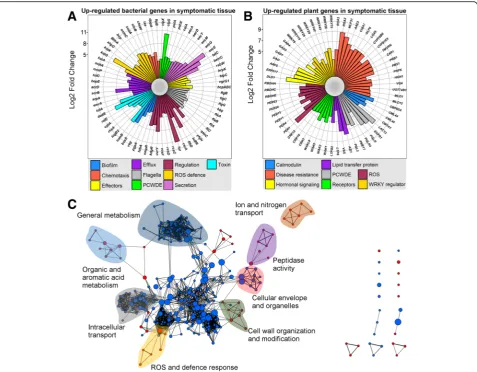
In order to generally assess quantitative differences between non-symptomatic and symptomatic metatran-scriptomes, we performed a gene expression analysis, identifying 6419 differentially expressed genes in symp-tomatic tissue (Additional file 24: Table S23). The 3064 downregulated genes in symptomatic tissue mainly displayed homology to plants (69%), fungi (16%), animals (9%) and bacteria (5%), while the 3355 upregulated (up-regulated is used generally here to include bacterial genes that may for example be unrepresented in non-symptomatic tissue) displayed homology to bacteria (61%), plants (32%), animals (4%) and fungi (2%). Many of the upregulated bacterial genes were associated with virulence, for example, biofilm formation, chemotaxis and motility, effectors, efflux pumps, PCWDEs, viru-lence regulation, reactive oxygen species (ROS) defence, protein secretion systems and toxin production (Fig.2a). Upregulated plant genes associated with symptomatic trees included calmodulin binding and production, disease resistance, hormonal signalling, PCWDEs, mem-brane receptors, ROS production and protection and the WRKY superfamily stress response transcription factors (Fig.2b). Furthermore, 31 downregulated and 66 upregu-lated genes were identified as originating from viruses. The majority of downregulated viral genes belonged to plant viruses, while the majority of upregulated viral genes belonged to bacteriophages (Additional file24: Table S23). To further clarify the host response in the symptom-atic tissue, we performed a geneset enrichment analysis (GSEA) on the expression data homologous to Arabi-dopsis genes (Fig. 2c) [21, 22]. GSEA demonstrated up-regulation of 190 genesets and downup-regulation of 276 genesets (Additional file 25: Table S24). Upregulated genesets were partly associated with defence and wound-ing response, ROS burst, cell wall modification and cell death. Downregulated genesets were partly associated with organelle organisation, circadian rhythm, protein transport, cell-cell signalling, photoperiodism and regu-lation of development, demonstrating a redistribution of resources in the host from growth to defence.
lesion formation in our previous study [4], along with bacterial draft genomes extracted from the metagenomic data, and the Q. robur transcriptome available in the NCBI database, which we annotated (Additional file 14: Table S13) [23]. The narrowed-down database allowed for specifying the representation of all bacteria of interest and the oak host in AOD lesions the metatranscriptomes and metaproteomes, and comparing symptomatic against non-symptomatic field samples (Additional file 26: Table S25, Additional file27: Table S26, Additional file28: Table S27, Additional file29: Table S28, Additional file30: Table S29, Additional file 31: Table S30 and Additional file 32:
Table S31). We could significantly detect (FDR < 0.05, fold change > 2) 499 upregulated genes in symptomatic samples and 92 downregulated genes. Of the 499 upregu-lated genes, 295 wereB.goodwiniigenes, 198 were oak genes and 6 belonged to the predicted bacterium of the genus Clostridioides (Additional file 33: Table S32). However, studying the identified gene transcripts of each sample, we could detect PCWDEs (for example oligogalacturonate lyases, proteases, pectate lyases, pectate disaccharide lyases and cellulases), toxins (for example toxin A, toxin RTX, HigB-2 and Colicin V) and other virulence-associated genes (for example effectors HopM1, YopJ, flagella and pathogenicity
factors) as active (Additional file 26: Table S25, Additional file27: Table S26, Additional file28: Table S27, Additional file29: Table S28, Additional file 30: Table S29, Additional file 31: Table S30, Additional file32: Table S31 and Additional file33: Table S32). The genes of interest to virulence and survival were mainly identified as belonging to B.goodwinii(Additional file34: Figure S1A) but also to the putative Clostridioides and Carnobacterium. Using our narrowed-down database, the percentage of bacterial reads in the metatranscriptome of AOD symptomatic samples ranged between 1.1 and 3.3%, withB.goodwinii correspond-ing to 33–82% of those reads. In non-symptomatic samples, the percentage of bacterial reads was only 0.02–0.07%, with no clear difference between different species. For the host, we could identify genes covering similar categories as for the Swissprot analysis (Additional file34: Figure S1B), with sev-eral defence-associated regulators and genes activated, such as mitogen-activated protein kinase, kinase AtM2K9, suggesting activation of the mitogen-activated protein kinase stress response cascade. Furthermore, the defence-associated genes AtNDR/HIN1-like protein 3 and 13 were significantly upregulated suggesting en-hanced defence, along with genes for toxin and ROS resistance such as AtGSTU8 and AtDTX29.
Metaproteome analysis suggestsB.goodwiniiis the dominant pathogen in the AOD lesion microbiome
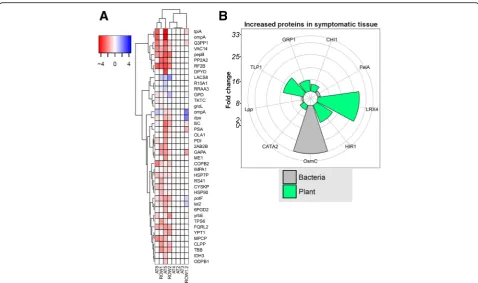
In order to further confirm the results of the metagenomic and metatranscriptomic data, by identifying active proteins of the microbiome members of interest to the AOD disease aetiology, and the host defence, we performed metaproteo-mic analysis using mass spectrometry. Using genes identified via metagenomics and metatranscriptomics as a reference database, we identified 629 proteins, of which 59 were bacterial and 570 eukaryotic (Additional file 35: Table S33). As expected, bacterial proteins were detected in all tissue samples but were generally higher in abun-dance in symptomatic samples. However, several core pro-teins of phytopathogenic bacteria were detected only in symptomatic tree samples, such as FliC, PepB, PotF and OmpA, along with various plant-associated transketolases, alcohol dehydrogenases and aldolases (Fig.3a). In a com-parative analysis of symptomatic versus non-symptomatic samples, bacterial proteins PelA (plant cell wall-degrading enzyme) and OsmC (survival) were significantly increased in symptomatic tissue (Fig.3b), along with host-associated proteins CHI1 (chitinase), CAT2 (catalase), LRX4 (cell wall formation regulation), HIR1 (hypersensitive reaction) and GRP1 and TLP1 (lignin formation). Metaproteomics clearly demonstrates an increased abundance of bacterial proteins, and a host defence response, in AOD lesions.
Using the narrowed-down database described for the metatranscriptomics, we re-performed the metapro-teome analysis (Additional file36: Table S34). We found
a total of 122 proteins significantly (p< 0.05, fold change > 2) differently abundant in symptomatic samples com-pared to non-symptomatic samples using student’s T test, or undetected in all non-symptomatic samples and detected in all symptomatic samples (Additional file 37: Table S35). Additionally, a Benjamini-Hochberg multiple test correction was performed on the p values, which yielded significance (FDR < 0.05) for one gene, BG_04787, a 4-hydroxy-tetrahydrodipicolinate synthase. However, the identified proteins in general supported the metagenomic and metatranscriptomic results. Among the proteins with increased abundance in AOD symptomatic samples were those ofB.goodwiniiandG.quercinecans, as well as that of our predicted Clostridioides. Only one protein, pre-dicted from oak transcript DN950644.1, homologous to a vesicle transport protein found in Arabidopsis thaliana, was increased in abundance in healthy samples; the other 121 proteins were more abundant in symptomatic samples, of which 23.5% were bacterial. Of those proteins, 18 proteins belonging to B. goodwinii were detected, including a superoxide dismutase, aldolases, a catalase and lipoproteins, suggesting survival in the oak host. Several host pectinesterases, proteases and chitinases were in-creased in abundance, suggesting PCWDE maceration taking place and anti-fungal activity. Furthermore, 3 proteins belonging to G. quercinecans were significantly increased in symptomatic tissue, including a Colicin V secretion protein, along with a signal recognition protein and a hypothetical protein of unknown functions, suggest-ing bacterial competition. The data of the narrowed-down database here provides a similar but re-focused picture of bacterial survival and virulence from the most prominent AOD microbiome member,B.goodwinii, along with host defence in the AOD lesions (Additional file38: Figure S2).
Discussion
data between different samples (Additional file 39: Table S36). The detection of predominantly plant-as-sociated genes in metagenome datasets from the non-symptomatic samples suggests that the depletion of host DNA was not complete. However, while the microbiome enrichment step depletes the host DNA, it does not completely remove all host DNA. In addition, both culture-based and molecular studies have suggested a very low proportion of microbial biomass in healthy tissue, which makes it reasonable to suggest that even with a microbiome enrichment step, a large proportion of host DNA will likely remain [4,24].
The increased bacterial activity in AOD lesions may explain an increased bacteriophage activity, as bacterio-phages capitalise on the abundant presence of hosts (i.e. bacteria) and stressful conditions, as suggested in bacteriophage predation studies [25]. We previously demonstrated in our taxonomic study that fungi, animals (aside from A. biguttatus) and viruses were not signifi-cantly associated with AOD [4]. Furthermore, bacterial and plant-associated genes were detected as present and consistently active across the -omic datasets presented here, further corroborating our previous study of the
importance of these aspects. Although A. biguttatus is still an interesting agent associated with AOD, further studies are required to determine its role, as proteins and genes associated with beetles or insects were not consistently found here across our datasets.
The study was conducted in field conditions, where we located AOD in two different locations, and in two different species of oak (Q. robur and Q. petraea). The samples AT5 and AT8 were from lesions exhibiting drier, callused later stages of AOD, while the samples ROW1, ROW1-2 and ROW2 were taken from trees exhibiting fresh wet lesion areas. The differences in tree and location may impact statistical analyses, along with extraction efficiency differences in macerated lesion tissue and healthy bark. Macerated tissue is already de-graded to an extent, but it also contains more phenolics, DNAses, RNAses and proteases and other compounds inhibiting the extraction efficiency. However, overall the data collected here across the -omic disciplines exhibits strong similarities for the symptomatic samples in terms of microbiome community structure, and transcriptomic and proteomic analysis results, providing a strong frame-work for the functional mechanissms of AOD.
The metatranscriptomic data highlights substantial host-microbiome interactions, demonstrating an increase in transcripts of phytopathogenic bacteria in stem lesions along with transcripts involved in host defence. The redundancy in many of the bacterial transcripts (multiple differently assembled transcripts annotated as the same gene, even housekeeping genes) further suggests that different bacteria are operating as a plant tissue macerat-ing community. The coincidental up- and downregulation of plant transcripts classified as the same gene, or within the same functional category (e.g. defence, regulation and hormone signalling), demonstrates complex host activity. This activity is clarified by the GSEA, highlighting a tran-scription profile in symptomatic oak trees general to microbial pathogenic infection; the triggering of defence-associated processes in the plant cells, balanced by the downregulation of development, internal organisation and metabolism [26]. Identified bacterial virulence-associated genes might be co-opted for tree diagnostics and monitor-ing, whereas beneficial plant regulators and pathogen defence genes might be used as markers for future oak breeding and monitoring.
Our results reveal the details of the microbiome activ-ity in the AOD lesions, on one hand by using a broad-spectrum public database such as Swissprot (Additional file1: Table S1, Additional file2: Table S2, Additional file3: Table S3, Additional file 4: Table S4, Additional file 5: Table S5, Additional file 6: Table S6, Additional file 7: Table S7, Additional file 8: Table S8, Additional file 9: Table S9, Additional file10: Table S10 and Additional file11: Table S11; Additional file14: Table S13, Additional file15: Table S14, Additional file16: Table S15, Additional file17: Table S16, Additional file18: Table S17, Additional file19: Table S18, Additional file20: Table S19, Additional file21: Table S20, Additional file22: Table S21, Additional file23: Table S22, Additional file24: Table S23, Additional file25: Table S24 and Additional file26: Table S25), and on the other a narrowed-down database containing bacteria of interest and gene transcripts identified in oak. Specifically, we observed the dominance of aB.goodwiniiin virulence-associated activity, aided by positive and Gram-negative bacteria of interest and concomitant detection of host defence responses typical of phytopathogen infection in oak stems. The analysis confirms an active enterobacterial and pectobacterial community displaying active virulence factors not detected in healthy trees. Previous taxonomic analysis of the AOD microbiome suggested that there is an AOD microbiome composed of several bacteria in AOD lesions, whereB.goodwiniiis the most abundant bacterium [4]. Our functional metatranscriptomic and metaproteomic analysis corroborates these data, showing that in numbers of virulence-associated genes and amount of transcripts (Additional file25: Table S24, Additional file26: Table S25, Additional file27: Table S26, Additional file28: Table S27,
Additional file29: Table S28, Additional file30: Table S29, Additional file31: Table S30, Additional file32: Table S31, Additional file33: Table S32, Additional file35: Table S33, Additional file 36: Table S34 and Additional file 37: Table S35), B. goodwinii is the most active member of the AOD microbiome based on our metaproteome and metatranscriptome data (Fig. 4, Table 1), followed byG.quercinecans andR.victorianaand drafted genomes assigned to Gram-positive bacteriaClostridioidesand Car-nobacterium. These Gram-positive bacteria may previously have evaded interest due to a lack of isolation from lesions, and because prior to draft genome assembly in this analysis, they were not represented in public databases. Conse-quently, these data demonstrate the significant potential of draft genome assembly from metagenome datasets to iden-tify candidate microorganisms for targeted analysis.
Taking the metatranscriptomic and metaproteomic data together, the results demonstrate that at least B.
goodwinii and possibly other bacteria from the AOD
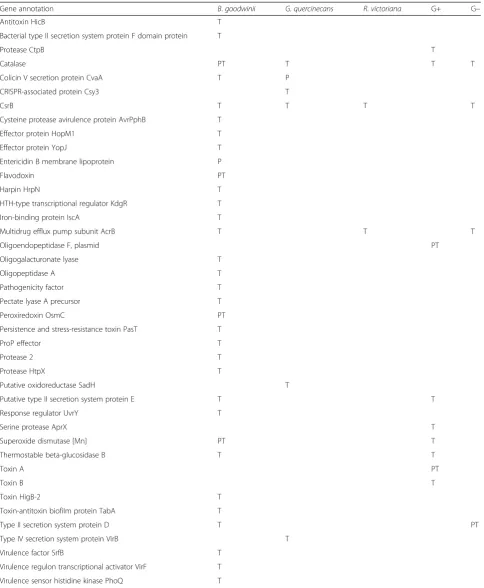
Table 1List of genes and proteins of interest involved in virulence, bacterial survival and interactions identified in the metaproteome and metatranscriptome of AOD lesions and their corresponding bacterial species/group of origin
Gene annotation B.goodwinii G.quercinecans R.victoriana G+ G−
Antitoxin HicB T
Bacterial type II secretion system protein F domain protein T
Protease CtpB T
Catalase PT T T T
Colicin V secretion protein CvaA T P
CRISPR-associated protein Csy3 T
CsrB T T T T
Cysteine protease avirulence protein AvrPphB T
Effector protein HopM1 T
Effector protein YopJ T
Entericidin B membrane lipoprotein P
Flavodoxin PT
Harpin HrpN T
HTH-type transcriptional regulator KdgR T
Iron-binding protein IscA T
Multidrug efflux pump subunit AcrB T T T
Oligoendopeptidase F, plasmid PT
Oligogalacturonate lyase T
Oligopeptidase A T
Pathogenicity factor T
Pectate lyase A precursor T
Peroxiredoxin OsmC PT
Persistence and stress-resistance toxin PasT T
ProP effector T
Protease 2 T
Protease HtpX T
Putative oxidoreductase SadH T
Putative type II secretion system protein E T T
Response regulator UvrY T
Serine protease AprX T
Superoxide dismutase [Mn] PT T
Thermostable beta-glucosidase B T T
Toxin A PT
Toxin B T
Toxin HigB-2 T
Toxin-antitoxin biofilm protein TabA T
Type II secretion system protein D T PT
Type IV secretion system protein VirB T
Virulence factor SrfB T
Virulence regulon transcriptional activator VirF T
Virulence sensor histidine kinase PhoQ T
G+ signifies the two Gram-positive bacteria belonging to theClostridioidesandCarnobacterium, while G−signifies other Gram-negative bacteria excludingB.
goodwinii,G.quercinecansandR.victoriana.P signifies detection of that gene in the proteomic data, while T signifies detection of the gene in the transcriptomic
microbiome are also present in healthy tissue, although at very low rates, and without significant virulence-associated activity. However, the presence of low levels ofB. goodwiniiin non-symptomatic trees may represent another example of the established phenomena that certain members of the microbiome may represent pathobionts; temporarily benign microorganisms that under altered conditions in the host may impart disease causation, and often, their activity is triggered or regu-lated by other members of the microbiota [17]. This phenomenon has also been described for the olive knot disease where activity of the key pathogenPseudomonas savastanoi is regulated by the non-pathogenic Erwinia oleae, E. toletanta andPantoea agglomerans [27]. Thus, B. goodwinii, G. quercinecans, R. victoriana and other bacteria identified in healthy tissue may perform this type of role. Comparing the output of metatranscrip-tomics and metagenomics using a generalised database such as Swissprot with the narrowed-down databased created for this study, there was a strong similarity in the shift in bacterial activity between symptomatic and non-symptomatic samples. With the narrowed-down database, we can through proteomic and transcriptomic analysis speculate thatB.goodwiniiis primarily acting in a survivalist manner in mature AOD lesions, utilising catalases and superoxide dismutases as a way to combat the host defences, and using entericidin for inhibiting other bacteria. However, samples ROW1 and ROW1-2, which were taken from trees with significantly more active lesions (fresh and wet bleeding, instead of dry
“caked over” scab-like lesions in AT5 and AT8) also reveal a stronger activity in PCWDE and virulence-associated genes (regardless of database). The Gram-positive bacteria of this study were also found to be active primarily in the fresher lesions, while almost ab-sent in the older lesions. Consequently, these results suggest that the Gram-positive bacteria lead a transitory phase, whileB.goodwiniiis highly active during maturity of the AOD lesions. The other Gram-negative bacteria involved in the AOD lesions were found to perform mainly interbacterial actions and stress responses. These results suggest that G. quercinecans, R. victoriana and other Gram-negative bacteria, at the advanced stages of the AOD lesions sampled here, are aiding the more viru-lent activities by B. goodwinii and the Gram-positive bacteria by supressing the effects of the oxidative and antimicrobial environment in the lesion while at the same time competing with each other. The tree host seems to have several of its own PCWDEs active in the AOD lesions, which may be of detriment to the host’s own health. Activity of tree chitinase in AOD may explain the absence of any fungal organisms in the AOD microbiome [28, 29]. The results here also dem-onstrate similar general trends on a metaproteomic
and metatranscriptomic level regardless of type of bioinformatic tools used. The databases used in future multi-omic analyses will prove more fine-tuned and reliable as the publicly available oak genome and general microbe genome databases are further refined and annotated.
Conclusions
Multi-omic analysis of oak-microbiome interactions in non-symptomatic and AOD non-symptomatic trees has provided important insights into the oak hologenome and its role in health and disease. This study demonstrates the power of draft genome reconstruction and multi-omicanalyses for characterising microbiome activity and interactions and con-comitant host defences, providing a knowledge base and conceptual framework that will be increasingly important in future studies of host-microbiome interactions [13,30], and in the management of AOD, that represents a significant threat to the UK’s iconic oak.
Methods
In-field oak tissue sampling
Collection of inner bark tissue from oak stems was per-formed in June 2015. The appropriate permissions were obtained from land owners prior to sampling, and Forest Research guidelines were followed for sampling. Briefly, the fully barked panels (approximately 10 × 15 cm WxB) were removed from the bleeding points of affected trees including the lesion margin and surrounding visually unaffected tissue (or in non-symptomatic trees, from po-sitions of similar above-ground height) using a sterilised mallet and chisel. The sampled tissue was immediately flash frozen on dry ice. In total, 8 samples were ex-tracted from 7 trees; 3 non-symptomatic (samples AT2, AT3 and AT4) and two symptomatic (samples AT5 and AT8) from English oak (Q. robur) at Attingham Park, and two symptomatic (samples ROW1, ROW1-2, each sampled from different bleeds on the same tree, and ROW2) from sessile oak(Q. petraea)in Hill Court near Ross-on-Wye (see Denman et al., [4] for further details on field sites and sampling methods). In the laboratory tissue pieces from the frozen, active lesion margin were removed using a chisel and mallet and homogenised by grinding with a sterile mortar and pestle. DNA, RNA and protein were extracted from the homogenised tissue of each sample (see below), aside from sample ROW2 not providing RNA of sufficient quality and quantity.
DNA extraction
manufacturer’s instructions. In order to enrich micro-biome DNA, the host DNA was depleted from the sample using the NEBnext microbiome DNA enrich-ment kit (New England Biolabs) according to the manu-facturer’s instructions. Subsequently, the DNA was purified and concentrated using the Genomic DNA Clean and Concentrator kit (Zymo Research) according to the manufacturer’s instructions and stored at−20 °C.
RNA extraction
RNA was extracted from approximately 50 mg of homo-genised oak tissue using a modified procedure for isolat-ing RNA from woody plant material [31]. Briefly, 5 ml of extraction buffer (4 M guanidine thiocyanate, 0.2 M sodium acetate pH 5.0, 25 mM EDTA, 2.5% (w/v) poly-vinylpyrrolidone and 1% (v/v) β-mercaptoethanol) was added to oak tissue kept frozen in a sterilised mortar using liquid nitrogen. The frozen tissue in extraction buffer was further ground until thawed. Subsequently, an additional 2.5 ml of extraction buffer and 500 μl of 20% sodium lauroyl sarcosinate were mixed into the sample. The sample mixture was shaken vigorously at room temperature for 15 min and further processed using the RNeasy Plant Mini kit (Qiagen). After centrifu-gation in the QIAShredder column, 350μl of the super-natant was mixed with 0.9 volumes of ethanol and subsequently centrifuged in the RNeasy Mini column. After this centrifugation step, the manufacturer’s in-structions for the RNeasy Plant Mini kit were followed. The extracted RNA was treated with DNase I (Qiagen) and further concentrated and purified using the RNeasy MinElute Cleanup kit (Qiagen) following the manufac-turer’s instructions. The purified RNA was checked for quality using 1% agarose gel electrophoresis and a Nano-Drop spectrophotometer (LabTech), and the concentration determined using the Qubit RNA HS assay kit (Thermo Fisher) following the manufacturer’s instructions. Subse-quently, rRNA was depleted from RNA extracts using a 1:1 combination of the Ribo-Zero rRNA Removal kits for plant seed/root and for bacteria (Illumina) according to the manufacturer’s instructions. The rRNA-depleted samples were again purified using the RNeasy MinElute Cleanup kit (Qiagen) again and stored at−80 °C.
Protein extraction
Proteins were extracted from approximately 50 mg of homogenised oak tissue using a modified method for protein extraction from woody tissue [32]. Briefly, the oak tissue was ground in 2-ml solubilisation buffer (50 mM Tris-HCl, 25 mM EDTA, 500 mM thiourea, 0.5% DTT). The mixture underwent shaking (150 rpm) for 1 h at ambient temperature. The samples were subsequently centrifuged at 20000gfor 20 min, and the supernatant was extracted and stored at 4 °C. The procedure was repeated
using the remaining pellet. The supernatant was extracted and pooled with the previous supernatant. Ice cold 20% tri-chloric acid in acetone with 0.5% DTT was added in a 1:1 ratio to the supernatant pool and precipitated at −20 °C overnight. After precipitation, the mixture was centrifuged at 20000g for 60 min and washed with ice cold acetone (centrifuged at 20000gfor 30 min). The pellet was air dried, re-suspended in 3% SDS solution and stored at−80 °C.
Metagenomic analysis
DNA samples were sent to the Centre for Genomic Re-search (CGR) at the University of Liverpool for sequen-cing. Samples were assayed for quality using a Fragment Analyzer (Advanced Analytical Technologies). Libraries were prepared using the Nextera XT Library Preparation kit (Illumina), and subsequently paired-end sequenced (2 × 125 bp) on one lane of the Illumina HiSeq platform. Raw sequences were trimmed using Cutadapt 1.2.1 and additionally Sickle 1.200 [33–35]. The total size of meta-genome data was 52 gigabases (Gb).
For functional analysis, the trimmed reads were assembled de novo using Ray Meta (version 2.3.1) [36]. A k-mer size of 51 was used for the assembly of all sam-ple datasets (N50 of 896-1116 for non-symptomatic samples, and N50 of 6154-127666 for symptomatic samples). Functional analysis was performed on the as-sembled contigs using the on-line metagenome analysis platform MG-RAST, which provided abundances in SEED subsystems for the samples. These subsystems were compared between symptomatic and non-symptomatic samples using the STAMP software package (version 2.1.3) [37]. SEED subsystems with a significant difference (FDR < 0.05) between symptomatic and non-symptomatic samples were identified using STAMP for performing a White’s non-parametric t test and Benjamini-Hochberg multiple test correction.
In order to detect bacteria of potential interest that may have evaded detection from traditional isolation methods that have been performed previously in AOD research, we utilised MetaBAT v0.32.4 to construct puta-tive genomes from the metagenomic data [38]. The binned genomes were further analysed using CheckM v1.0.6 and AMPHORA2 to determine their taxonomy [39, 40]. Gene prediction and annotation of the binned genomes was performed using Prokka v1.11 [41].
Metatranscriptomic analysis
using Cutadapt 1.2.1 and additionally Sickle 1.200. The total size of the metatranscriptome sample data was 54 Gb.
Trimmed high-quality sequences were assembled de novo using Trinity (version 2.2.0) [42, 43]. The Trino-nate (version 3.0.0) pipeline combined with bowtie (version 1.1.2) and RSEM (version 1.2.29) were used to functionally annotate Trinity contigs using the Swissprot database (based on simultaneous hits using both BLAST-P e value < 10−5and BLAST-X evalue < 10−20) and to align reads and quantify transcripts [44, 45]. Pu-tative rRNA sequences were identified using RNAmmer (version 1.2) [46].
For differential expression analysis, raw paired reads from all metatranscriptomes were combined and analysed using the Trinonate pipeline as described. Predicted bowtie reads and RSEM-based counts were used in combination with the voom function of the limma R package to determine significantly differentially expressed genes between non-symptomatic and non-symptomatic samples (cutoff FDR < 0.05 and a minimal log2fold change <−2 and > 2) [47,48].
Geneset enrichment analysis (GSEA) was performed on Arabidopsis-associated genes demonstrating a statis-tically significant change in expression as determined by the voom analysis. Geneset enrichment analysis allows for an overview of the impact of relative gene expression on larger processes (genesets). This is based on a Kolmogorov-Smirnov statistics of highly expressed genes between two traits, which has been used based on statis-tically significant expression profiling results of RNA sequencing data [22, 49, 50]. Genesets used for analysis were provided in the PlantGSEA platform database [21]. This database incorporates databases from the Gene Ontology Consortium (GO) and the Kyoto Encyclopedia of Genes and Genomes (KEGG) among others [51–54]. The analysis was performed on the GenePattern server (Broad Institute). Software parameters included 1000 permutations and a gene set size range from 5 to 1000 [22, 55, 56]. A P value cutoff of < 0.05 using a GSEA Kolmogorov-Smirnov-based statistics was set to deter-mine genesets with significantly altered expression.
We previously identified three primary bacterial species as causal agents of AOD lesion formation, along with several other bacteria associated with a microbiome shift. In order to determine which bacteria and bacterial genes are truly active in lesions, we compiled a narrowed-down database based on the 10 most abun-dant bacterial species in AOD lesions as determined by Kraken analysis and 16 of the most complete predicted genomes from the metagenomic data. Furthermore, we added the oak transcriptome based on the NCBI data-base proposed by Ueno et al. [23], which we annotated using the Trinotate pipeline with Swissprot as a refer-ence (Additional file 12: Table S12). The database was
created as the bacterial species we are certain are caus-ing AOD are poorly represented in databases such as Swissprot, which on the other hand has the advantage of containing more data. Thus, this narrowed-down data-base was used as an alternative reference for read
align-ment of the metatranscriptomes using Bowtie2
v1.1.2 [57], and transcripts were counted for each sam-ple using eXpress v1.5.1 [58], and a cutoff of at least 3 counted transcripts per sample was used. Expression profiling between sample groups was performed as pre-viously described using voom, using a cutoff of FDR < 0.05 and a fold change > 2.
Metaproteomic analysis
Protein samples were sent to the Proteomics Facility at the University of Bristol for analysis using mass spec-trometry. Aliquots of eight samples were digested with trypsin (2.5 μg trypsin per 100 μg protein; 37 °C, over-night), labelled with Tandem Mass Tag (TMT) ten plex reagents according to the manufacturer’s protocol (Thermo Fisher Scientific) and the labelled samples pooled. The pooled sample was fractionated by high pH reversed-phase chromatography using an Ultimate 3000 liquid chromatography system (Thermo Fisher Scientific). The resulting fractions were evaporated to dryness and re-suspended in 1% formic acid prior to analysis by nano-LC MSMS using an Orbitrap Fusion Tribrid mass spectrom-eter (Thermo Scientific). High pH RP fractions were further fractionated using an Ultimate 3000 nanoHPLC system in line with an Orbitrap Fusion Tribrid mass spec-trometer (Thermo Scientific). Peptides were ionised by nano-electrospray ionisation at 2.0 kV using a stainless steel emitter with an internal diameter of 30μm (Thermo Scientific) and a capillary temperature of 275 °C.
All spectra were acquired using an Orbitrap Fusion Tribrid mass spectrometer controlled by Xcalibur 2.0 soft-ware (Thermo Scientific) and operated in data-dependent acquisition mode using an SPS-MS3 workflow.
The raw data files were processed and quantified using Proteome Discoverer software v1.4 (Thermo Scientific) and searched against a database comprised of proteins predicted by the metagenome and metatranscriptome datasets, using SEQUEST [59]. Peptide precursor mass tolerance was set at 10 ppm, and MS/MS tolerance was set at 0.6 Da. Search criteria included oxidation of methionine, carbamidometh-ylation of cysteine and the addition of the TMT mass tag to peptide N-termini and lysine as fixed modifications. The reverse database search option was enabled, and all peptide data was filtered to satisfy false discovery rate (FDR) of 5%. Peptides were collapsed to protein groups which expres-sions are represented by their summed peptide median intensity. Expression values were log10 transformed and
differentiated proteins between symptomatic and non-symptomatic samples, we performed a two-sample moder-ated t test. Raw peak intensity values of the experiment were deposited at the PRIDE repository [61].
Additional files
Additional file 1: Table S1.Metagenomic gene annotation of sample AT2. MG-RAST gene predictions for sample AT2, based on the Swissprot database. MG-RAST ID 4702452.3. (XLSX 497 kb)
Additional file 2: Table S2.Metagenomic gene annotation of sample AT3. MG-RAST gene predictions for sample AT3, based on the Swissprot database. MG-RAST ID 4702456.3. (XLSX 470 kb)
Additional file 3: Table S3.Metagenomic gene annotation of sample AT4. MG-RAST gene predictions for sample AT4, based on the Swissprot database. MG-RAST ID 4702454.3. (XLSX 471 kb)
Additional file 4: Table S4.Metagenomic gene annotation of sample AT5. MG-RAST gene predictions for sample AT5, based on the Swissprot database. MG-RAST ID 4702457.3. (XLSX 240 kb)
Additional file 5: Table S5.Metagenomic gene annotation of sample AT8. MG-RAST gene predictions for sample AT8, based on the Swissprot database. MG-RAST ID 4702453.3. (XLSX 355 kb)
Additional file 6: Table S6.Metagenomic gene annotation of sample ROW1. MG-RAST gene predictions for sample ROW1, based on the Swis-sprot database. MG-RAST ID 4702451.3. (XLSX 515 kb)
Additional file 7: Table S7.Metagenomic gene annotation of sample ROW1–2. MG-RAST gene predictions for sample ROW1-2, based on the Swissprot database. MG-RAST ID 4702458.3. (XLSX 277 kb)
Additional file 8: Table S8.Metagenomic gene annotation of sample ROW2. MG-RAST gene predictions for sample ROW2, based on the Swis-sprot database. MG-RAST ID 4702455.3. (XLSX 564 kb)
Additional file 9: Table S9.Comparisons of metagenomic functional gene categories. Gene counts for MG-RAST SEED subsystem categories for all samples in this study. (XLSX 595 kb)
Additional file 10: Table S10.Common core metagenome of AOD symptomatic tissue. Genes identified in all symptomatic samples (AT5, AT8, ROW1, ROW1–2 and ROW2), and in no non-symptomatic samples. Based on MG-RAST annotation using Swissprot as reference database. (XLSX 105 kb)
Additional file 11: Table S11.Common core metagenome of non-symptomatic samples. Genes identified in all non-non-symptomatic samples (AT2, AT3 and AT4), and in no symptomatic samples. Based on MG-RAST annotation using Swissprot as reference database. (XLSX 64 kb)
Additional file 12: Table S12.Constructed bacterial genomes of this study. List of constructed genomes based on metagenomic read binning using the MetaBat software, their assigned genera and ID used in this study, and corresponding CheckM software analysis results. (XLSX 10 kb)
Additional file 13:Narrowed-down database containing all predicted and annotated genes of all organisms used in the specialised data analysis of this study. (FASTA 46859 kb)
Additional file 14: Table S13.Metatranscriptomic gene annotation of sample AT2. Identified unique genes in the metatranscriptome of sample AT2, using transcripts assembled using Trinity and annotating using the Trinotate pipeline. Swissprot was used as reference database. (XLSX 8417 kb)
Additional file 15: Table S14.Metatranscriptomic gene annotation of sample AT3. Identified unique genes in the metatranscriptome of sample AT3, using transcripts assembled using Trinity and annotating using the Trinotate pipeline. Swissprot was used as reference database. (XLSX 1326 kb)
Additional file 16: Table S15.Metatranscriptomic gene annotation of sample AT4. Identified unique genes in the metatranscriptome of sample AT4, using transcripts assembled using Trinity and annotating using the Trinotate pipeline. Swissprot was used as reference database. (XLSX 1219 kb)
Additional file 17: Table S16.Metatranscriptomic gene annotation of sample AT5. Identified unique genes in the metatranscriptome of sample AT5, using transcripts assembled using Trinity and annotating using the Trinotate pipeline. Swissprot was used as reference database. (XLSX 1134 kb)
Additional file 18: Table S17.Metatranscriptomic gene annotation of sample AT8. Identified unique genes in the metatranscriptome of sample AT8, using transcripts assembled using Trinity and annotating using the Trinotate pipeline. Swissprot was used as reference database. (XLSX 664 kb)
Additional file 19: Table S18.Metatranscriptomic gene annotation of sample ROW1. Identified unique genes in the metatranscriptome of sample ROW1, using transcripts assembled using Trinity and annotating using the Trinotate pipeline. Swissprot was used as reference database. (XLSX 1123 kb)
Additional file 20: Table S19.Metatranscriptomic gene annotation of sample ROW1–2. Identified unique genes in the metatranscriptome of sample ROW1–2, using transcripts assembled using Trinity and annotating using the Trinotate pipeline. Swissprot was used as reference database. (XLSX 1349 kb)
Additional file 21: Table S20.Common core metatranscriptome of AOD symptomatic tissue. Identified genes common to all symptomatic samples, but unidentified in non-symptomatic samples. Based on tran-scripts assembled using Trinity and annotated using Trinotate. Swissprot was used a reference database. (XLSX 1420 kb)
Additional file 22: Table S21.Common core metatranscriptome of non-symptomatic tissue. Identified genes common to all non-symptomatic samples, but unidentified in symptomatic samples. Based on transcripts assembled using Trinity and annotated using Trinotate. Swissprot was used a reference database. (XLSX 22 kb)
Additional file 23: Table S22.Comparative gene expression analysis of metatranscriptomes. List of genes identified as significantly altered in expression comparing the metatranscriptomes of symptomatic to non-symptomatic samples, using the voom function in R (limma package). Reference database for gene annotations was Swissprot. (XLSX 37 kb)
Additional file 24: Table S23.Geneset enrichment analysis results. Genesets identified as significantly differently expressed when comparing symptomatic to non-symptomatic samples, using the GSEA module of the GenePattern software (Broad Institute). (XLSX 1847 kb)
Additional file 25: Table S24.Metaproteome analysis of all samples on peptide level. Peptide level read output from Proteome Discoverer software (Thermo Fisher Scientific) version 2.1 for each protein, with a confidence FDR < 0.05. (XLSX 60 kb)
Additional file 26: Table S25.Constructed narrowed-down database. Dataset of annotated genes associated withQuercus roburandQuercus petraea, as found on the NCBI website. (XLSX 12886 kb)
Additional file 34: Figure S1.Analysis of metatranscriptomes using a curated database of abundant bacteria in the AOD lesion microbiome reveals thatBrenneria goodwiniiis the key pathogen, but assisted by others.A:Brenneria goodwinii(Bg in the figure) virulence-associated genes significantly upregulated in symptomatic samples compared to non-symptomatic samples. Genes were determined to be significantly dif-ferent in expression by using the limma package in R (statistical cutoff at FDR < 0.05, and log2cutoff at > 2). Circles in light grey going out from the centre indicate log2fold changes, with the ratio numbers indicated to the side of the plots. Genes were separated into different colour coded categories. B: Oak tree defence-associated genes upregulated in symptomatic samples compared to non-symptomatic samples, based on our in-house annotated oak transcriptome database. (TIFF 946 kb)
Additional file 35: Table S33.Differentially expressed genes in AOD symptomatic tissue. List of significant genes resulting from comparative analysis of the non-symptomatic samples and symptomatic samples using the voom function of the R-package limma, based on an FDR value < 0.05 and log2-fold change of <−2 and > 2. These results were generated on read hits against our narrowed-down database (Additional file13). (XLSX 860 kb)
Additional file 36: Table S34.Metaproteome analysis of all samples on protein level using the narrowed-down database. Peptide level read output from Proteome Discoverer software (Thermo Fisher Scientific) version 2.1 for each protein, with a confidence FDR < 0.05. (XLSX 668 kb)
Additional file 37: Table S35.Comparative proteome results of genes of interest. List of all annotated proteins of interest using our narrowed-down database (Additional file13). (XLSX 28 kb)
Additional file 38: Figure S2.Metaproteome analysis using a curated database of abundant bacteria in the AOD lesion microbiome confirms the dominance ofBrenneria goodwiniiin AOD. Using our narrowed-down database, we re-performed comparative metaproteomics of our non-symptomatic vs. non-symptomatic samples. Genes were determined to be significantly different in abundance using a student’s t-test. Gene names in all capital letters correspond to oak host genes, while belong toB. goodwinii. Categories of interest are depicted in the colour key. Genes with an abundance fold change of 15 were not detected in non-symptomatic tissue. Circles in light grey going out from the centre indicate the different log2fold changes, with the numbers indicated to the side of the plots. (TIFF 435 kb)
Additional file 39: Table S36.List of all identified unique genetic features based on the Swissprot database in each sample, divided into data derived from Metagenome, Metatranscriptome and Metaproteome. (XLSX 868 kb)
Acknowledgements
Access to trees for sampling was provided by Attingham Park and Hill Court Manor; we thank the site managers for their assistance and co-operation in allowing us access to the trees. We thank Maciej Kaczmarek (Forest Research) and Emma Ransom-Jones (Bangor University) for technical assistance during tissue sampling, Pia Koldkjaer and John Kenny (CGR, Liverpool) for assistance with DNA and RNA sequencing and Kate Heesom (University of Bristol) for assistance with proteome mass spectrometry. We thank Woodland Heritage for funding most of this work but also thank the Forestry Commission and Defra for their contribution.
Funding
This work was funded by Woodland Heritage, UK.
Availability of data and materials
Raw read files of all metagenomes are available at the NCBI Sequence Read Archive (SRA) under Bioproject PRJNA321868. Individual Biosample accession numbers are: AT2 (SAMN05150009), AT3 (SAMN05150010), AT4 (SAMN05150011), AT5 (SAMN05150012), AT8 (SAMN05150013), ROW1 (SAMN05150014), ROW1-2 (SAMN05150015) and ROW2 (SAMN05150016). Assembled metagenomes and associated annotations are available on MG-RAST: AT2 (4702452.3), AT3 (4702456.3), AT4 (4702454.3), AT5 (4702457.3), AT8 (4702453.3), ROW1 (4702451.3), ROW1-2 (4702458.3), ROW2 (4702455.3). Raw reads for metatranscriptome libraries are available at the NCBI SRA under Bioproject PRJNA322128. Individual Biosample accession numbers are: AT2 (SAMN05179858), AT3 (SAMN05179859), AT4 (SAMN05179860), AT5 (SAMN05179861), AT8 (SAMN05179862), ROW1 (SAMN05179863) and ROW1-2 (SAMN05179864).
Raw intensity values and the protein sequence database used for analysis of meta-proteomic data are available on PRIDE under accession number PXD004991.
Authors’contributions
MB, JM and SD conceived the experiments. MB and SD performed the tissue sampling. MB and JD performed the experiments. MB performed the analysis and interpretation of experimental data. FM aided with the analysis of metaproteomic data. MB, JM and SD wrote the manuscript. JM and SD secured the funding. All authors have read and approved the final manuscript.
Ethics approval and consent to participate Not applicable
Consent for publication Not applicable
Competing interests
The authors declare that they have no competing interests.
Publisher’s Note
Springer Nature remains neutral with regard to jurisdictional claims in published maps and institutional affiliations.
Author details
1School of Biological Sciences, Bangor University, Memorial Building, Deiniol
Road, Bangor, Gwynedd LL57 2UW, UK.2Swedish University of Agricultural Sciences, Almas Alle 8, 750 07 Uppsala, Sweden.3Broad Institute, 415 Main St., Cambridge, MA 02142, USA.4Forest Research, Centre for Forestry and Climate Change, Alice Holt Lodge, Farnham, Surrey GU10 4LH, UK.
Received: 7 September 2017 Accepted: 19 January 2018
References
1. Cohen WB, Yang Z, Stehman SV, Schroeder TA, Bell DM, Masek JG, et al. Forest disturbance across the conterminous United States from 1985–2012: the emerging dominance of forest decline. For Ecol Manag. 2016;360:242–52. 2. Denman S, Brown N, Kirk S, Jeger M, Webber J. A description of the
symptoms of Acute Oak Decline in Britain and a comparative review on causes of similar disorders on oak in Europe. Forestry. 2014;87:535–51. 3. Brown N, Jeger M, Kirk S, Williams D, Xu X, Pautasso M, et al. Acute Oak
Decline and Agrilus biguttatus: the co-occurrence of stem bleeding and D-shaped emergence holes in Great Britain. Forests. 2017;8:87.
4. Denman S, Doonan J, Ransom-Jones E, Broberg M, Plummer S, Kirk S, et al. Microbiome and infectivity studies reveal complex polyspecies tree disease in Acute Oak Decline. ISME J. 2018;12(2):386-99.
5. Brown N, Inward DJG, Jeger M, Denman S. A review of Agrilus biguttatus in UK forests and its relationship with acute oak decline. Forestry. 2015;88:53–63. 6. Brady C, Allainguillaume J, Denman S, Arnold D. Rapid identification of
bacteria associated with Acute Oak Decline by high-resolution melt analysis. Lett Appl Microbiol. 2016;63:89–95.
7. Charkowski A, Blanco C, Condemine G, Expert D, Franza T, Hayes C, et al. The role of secretion systems and small molecules in soft-rot
Enterobacteriaceae pathogenicity. Annu Rev Phytopathol. 2012;50:425–49. 8. van der Heijden MGA, Hartmann M. Networking in the plant microbiome.
PLoS Biol. 2016;14:e1002378.
9. Hacquard S, Schadt CW. Towards a holistic understanding of the beneficial interactions across thePopulusmicrobiome. New Phytol. 2015;205:1424–30. 10. Bulgarelli D, Garrido-Oter R, Münch PC, Weiman A, Dröge J, Pan Y, et al.
Structure and function of the bacterial root microbiota in wild and domesticated barley. Cell Host Microbe. 2015;17:392–403.
11. Turner TR, James EK, Poole PS. The plant microbiome. Genome Biol. 2013;14:209. 12. Franzosa EA, Hsu T, Sirota-Madi A, Shafquat A, Abu-Ali G, Morgan XC, et al.
Sequencing and beyond: integrating molecular“omics”for microbial community profiling. Nat Rev Microbiol. 2015;13:360–72.
13. Vayssier-Taussat M, Albina E, Citti C, Cosson J-F, Jacques M-A, Lebrun M-H, et al. Shifting the paradigm from pathogens to pathobiome: new concepts in the light of meta-omics. Front Cell Infect Microbiol. 2014;4:29. 14. Cardenas E, Tiedje JM. New tools for discovering and characterizing
15. Hultman J, Waldrop MP, Mackelprang R, David MM, McFarland J, Blazewicz SJ, et al. Multi-omics of permafrost, active layer and thermokarst bog soil microbiomes. Nature. 2015;521:208–12.
16. Moran MA, Satinsky B, Gifford SM, Luo H, Rivers A, Chan L-K, et al. Sizing up metatranscriptomics. ISME J. 2013;7:237–43.
17. Pitlik SD, Koren O. How holobionts get sick—toward a unifying scheme of disease. Microbiome. 2017;5:64.
18. Theis KR, Dheilly NM, Klassen JL, Brucker RM, Baines JF, Bosch TCG, et al. Getting the hologenome concept right: an eco-evolutionary framework for hosts and their microbiomes. mSystems. 2016;1:e00028–16.
19. Meyer F, Paarmann D, D’Souza M, Olson R, Glass E, Kubal M, et al. The metagenomics RAST server—a public resource for the automatic phylogenetic and functional analysis of metagenomes. BMC Bioinformatics. 2008;9:386.
20. Bowers RM, Kyrpides NC, Stepanauskas R, Harmon-Smith M, Doud D, Reddy TBK, et al. Minimum information about a single amplified genome (MISAG) and a metagenome-assembled genome (MIMAG) of bacteria and archaea. Nat Biotechnol. 2017;35:725–31.
21. Yi X, Du Z, Su Z. PlantGSEA: a gene set enrichment analysis toolkit for plant community. Nucleic Acids Res. 2013;41:W98–103.
22. Subramanian A, Tamayo P, Mootha VK, Mukherjee S, Ebert BL, Gillette MA, et al. Gene set enrichment analysis: a knowledge-based approach for interpreting genome-wide expression profiles. Proc Natl Acad Sci. 2005;102:15545–50. 23. Ueno S, Le Provost G, Léger V, Klopp C, Noirot C, Frigerio J-M, et al.
Bioinformatic analysis of ESTs collected by Sanger and pyrosequencing methods for a keystone forest tree species: oak. BMC Genomics. 2010;11:650. 24. Denman S, Plummer S, Kirk S, Peace A, Mc Donald JE. Isolation studies
reveal a shift in the cultivable microbiome of oak affected with Acute Oak Decline. Syst Appl Microbiol. 2016;39(7):484-90.
25. Ashelford KE, Day MJ, Fry JC. Elevated abundance of bacteriophage infecting bacteria in soil. Appl Environ Microbiol. 2003;69:285–9. 26. Bolton MD. Primary metabolism and plant defense–fuel for the fire. Mol
Plant-Microbe Interact MPMI. 2009;22:487–97.
27. Buonaurio R, Moretti C, da Silva DP, Cortese C, Ramos C, Venturi V. The olive knot disease as a model to study the role of interspecies bacterial communities in plant disease. Front Plant Sci. 2015;6:434.
28. Schlumbaum A, Mauch F, Vögeli U, Boller T. Plant chitinases are potent inhibitors of fungal growth. Nature. 1986;324:365–7.
29. Oliveira-Garcia E, Valent B. How eukaryotic filamentous pathogens evade plant recognition. Curr Opin Microbiol. 2015;26:92–101.
30. Berg G, Grube M, Schloter M, Smalla K. Unraveling the plant microbiome: looking back and future perspectives. Front Microbiol. 2014;5:148. 31. Kalinowska E, Chodorska M, Paduch-Cichal E, Mroczkowska K. An improved
method for RNA isolation from plants using commercial extraction kits. Acta Biochim Pol. 2012;59:391–3.
32. Pagter M, Sergeant K, Møller SM, Bertram HC, Renaut J. Changes in the proteome and water state in bark and xylem of Hydrangea paniculata during loss of freezing tolerance. Environ Exp Bot. 2014;106:99–111. 33. Del Fabbro C, Scalabrin S, Morgante M, Giorgi FM. An extensive evaluation
of read trimming effects on Illumina NGS data analysis. PLoS One. 2013;8: e85024.
34. Martin M. Cutadapt removes adapter sequences from high-throughput sequencing reads. EMBnetjournal. 2011;17:10–2.
35. Joshi N, Fass J. Sickle: a sliding-window, adaptive, quality-based trimming tool for FastQ files. 2011; Available from: http://github.com/najoshi/sickle. 36. Boisvert S, Raymond F, Godzaridis É, Laviolette F, Corbeil J. Ray Meta: scalable de novo metagenome assembly and profiling. Genome Biol. 2012;13:R122.
37. Parks DH, Tyson GW, Hugenholtz P, Beiko RG. STAMP: statistical analysis of taxonomic and functional profiles. Bioinformatics. 2014;30:3123–4. 38. Kang DD, Froula J, Egan R, Wang Z. MetaBAT, an efficient tool for accurately
reconstructing single genomes from complex microbial communities. PeerJ. 2015;3:e1165.
39. Parks DH, Imelfort M, Skennerton CT, Hugenholtz P, Tyson GW. CheckM: assessing the quality of microbial genomes recovered from isolates, single cells, and metagenomes. Genome Res. 2015;25:1043–55.
40. Wu M, Scott AJ. Phylogenomic analysis of bacterial and archaeal sequences with AMPHORA2. Bioinformatics. 2012;28:1033–4.
41. Seemann T. Prokka: rapid prokaryotic genome annotation. Bioinformatics. 2014;30:2068–9.
42. Grabherr MG, Haas BJ, Yassour M, Levin JZ, Thompson DA, Amit I, et al. Full-length transcriptome assembly from RNA-Seq data without a reference genome. Nat Biotechnol. 2011;29:644–52.
43. Haas BJ, Papanicolaou A, Yassour M, Grabherr M, Blood PD, Bowden J, et al. De novo transcript sequence reconstruction from RNA-seq using the Trinity platform for reference generation and analysis. Nat Protoc. 2013;8:1494–512. 44. Li B, Dewey CN. RSEM: accurate transcript quantification from RNA-Seq data
with or without a reference genome. BMC Bioinformatics. 2011;12:323. 45. Langmead B. Aligning short sequencing reads with bowtie. Curr Protoc
Bioinformatics. 32:11.7.1-11.7.14.
46. Lagesen K, Hallin P, Rodland EA, Staerfeldt H-H, Rognes T, Ussery DW. RNAmmer: consistent and rapid annotation of ribosomal RNA genes. Nucleic Acids Res. 2007;35:3100–8.
47. Law CW, Chen Y, Shi W, Smyth GK. voom: precision weights unlock linear model analysis tools for RNA-seq read counts. Genome Biol. 2014;15:R29. 48. Ritchie ME, Phipson B, Wu D, Hu Y, Law CW, Shi W, et al. limma powers
differential expression analyses for RNA-sequencing and microarray studies. Nucleic Acids Res. 2015;43:e47.
49. Mootha VK, Lindgren CM, Eriksson K-F, Subramanian A, Sihag S, Lehar J, et al. PGC-1α-responsive genes involved in oxidative phosphorylation are coordinately downregulated in human diabetes. Nat Genet. 2003;34:267–73. 50. Trapnell C, Hendrickson DG, Sauvageau M, Goff L, Rinn JL, Pachter L.
Differential analysis of gene regulation at transcript resolution with RNA-seq. Nat Biotechnol. 2012;31:46–53.
51. Ashburner M, Ball CA, Blake JA, Botstein D, Butler H, Cherry JM, et al. Gene ontology: tool for the unification of biology. The Gene Ontology Consortium. Nat Genet. 2000;25:25–29.
52. Kanehisa M, Goto S. KEGG: kyoto encyclopedia of genes and genomes. Nucleic Acids Res. 2000;28:27–30.
53. Kanehisa M, Sato Y, Kawashima M, Furumichi M, Tanabe M. KEGG as a reference resource for gene and protein annotation. Nucleic Acids Res. 2016;44:D457–62.
54. The Gene Ontology Consortium. Gene Ontology Consortium: going forward. Nucleic Acids Res. 2015;43:D1049–56.
55. Merico D, Isserlin R, Stueker O, Emili A, Bader GD. Enrichment map: a network-based method for gene-set enrichment visualization and interpretation. PLoS One. 2010;5:e13984.
56. Reich M, Liefeld T, Gould J, Lerner J, Tamayo P, Mesirov JP. GenePattern 2.0. Nat. Genet. 2006;38:500–1.
57. Langmead B, Salzberg SL. Fast gapped-read alignment with Bowtie 2. Nat. Methods. 2012;9:357–9.
58. Roberts A, Pachter L. Streaming fragment assignment for real-time analysis of sequencing experiments. Nat Methods. 2012;10(1):71-3.
59. Eng JK, McCormack AL, Yates JR. An approach to correlate tandem mass spectral data of peptides with amino acid sequences in a protein database. J Am Soc Mass Spectrom. 1994;5(11):976–89.
60. Smyth GK. Linear models and empirical Bayes methods for assessing differential expression in microarray experiments. Stat Appl Genet Mol Biol. 2004;3:1–25.
61. Vizcaíno JA, Csordas A, del-Toro N, Dianes JA, Griss J, Lavidas I, et al. 2016 update of the PRIDE database and its related tools. Nucleic Acids Res. 2016; 44:D447–56.
• We accept pre-submission inquiries
• Our selector tool helps you to find the most relevant journal
• We provide round the clock customer support • Convenient online submission
• Thorough peer review
• Inclusion in PubMed and all major indexing services
• Maximum visibility for your research
Submit your manuscript at www.biomedcentral.com/submit