R E S E A R C H A R T I C L E
Open Access
A microRNA biomarker of hepatocellular
carcinoma recurrence following liver
transplantation accounting for
within-patient heterogeneity
Qing Yan Xie
1, Anthony Almudevar
1, Christa L. Whitney-Miller
2, Christopher T. Barry
3and Matthew N. McCall
1,4*Abstract
Background:Liver cancer, of which hepatocellular carcinoma (HCC) is by far the most common type, is the second
most deadly cancer (746,000 deaths in 2012). Currently, the only curative treatment for HCC is surgery to remove the malignancy (resection) or to remove the entire diseased liver followed by transplantation of healthy liver tissue. Given the shortage of healthy livers, it is crucial to provide transplants to patients that have the best chance of long-term survival. Currently, transplantation is determined via the Milan criteria—patients within Milan (single tumor < 5 cm or 2–3 tumors < 3 cm with no extrahepatic spread nor intrahepatic vascular invasion) are typically eligible for transplantation. However, combining microRNA expression profiling with the Milan criteria can improve prediction of recurrence.
HCC often presents with multiple distinct tumor foci arising from local spread of a primary tumor or from the oncogenic predisposition of the diseased liver. Substantial genomic heterogeneity between tumor foci within a single patient has been reported; therefore, biomarker development must account for the possibility of highly heterogeneous genomic profiles from the same individual.
Methods:MicroRNA profiling was performed on 180 HCC tumor samples from 89 patients who underwent liver
transplantation at the University of Rochester Medical Center. The primary outcome was recurrence-free survival time, and patients were observed for 3 years post-transplantation.
Results:MicroRNA expression profiles were used to develop a biomarker that distinguishes HCC patients at greater risk of recurrence post-transplantation. Unsupervised clustering uncovered two distinct subgroups with vast differences in standard transplantation selection criteria and recurrence-free survival times. These subgroups were subsequently used to identify microRNAs strongly associated with HCC recurrence. Our results show that reduced expression of five specific microRNAs is significantly associated with HCC recurrence post-transplantation.
Conclusions:MicroRNA profiling of distinct tumor foci, coupled with methods that address within-subject tumor heterogeneity, has the potential to significantly improve prediction of HCC recurrence post-transplantation. The development of a clinically applicable HCC biomarker would inform treatment options for patients and contribute to liver transplant selection criteria for practitioners.
Keywords:microRNA, Biomarker, Hepatocellular carcinoma (HCC), Liver transplantation, Recurrence
* Correspondence:mccallm@gmail.com
1
Department of Biostatistics and Computational Biology, University of Rochester Medical Center, Rochester, NY, USA
4Department of Biomedical Genetics, University of Rochester Medical Center,
Rochester, NY, USA
Full list of author information is available at the end of the article
Background
Hepatocellular carcinoma (HCC) is one of the most common malignancies worldwide, accounting for the second most cancer-related deaths [1, 2]. In the U.S., it has been predicted by 2030 to become the third leading cause of cancer-related death, surpassing breast, prostate, and colorectal cancers [3]. The only curative treatment is surgery: either tumor resection or liver transplantation. However, patients undergoing these treatments still have a high risk of recurrence. Both resection and transplantation result in 80 % 5-year patient survival rates in appropriately selected patients. However, the recurrence rate in 5 years for resection is 70 % whereas with transplantation the 5-year recurrence rate is 15–20 % [4]. Even though the 5-year HCC recurrence rate after transplantation seems acceptably low at 15–20 %, improved selection criteria would further optimize outcomes and therefore more efficiently use the precious resource of donor liver tissue. The current selection criteria for transplant-ation, the Milan criteria, are a single tumor < 5 cm or 2–3 tumors < 3 cm with no extrahepatic spread or intrahepatic vascular invasion [5]. While the Milan criteria alone per-form reasonably well, combining the Milan criteria with a microRNA biomarker has been shown to improve predic-tion of recurrence [6].
MicroRNAs are receiving growing attention as bio-markers due to their diverse role in cellular regulation. In cancer, microRNAs have shown promise as both diag-nostic and progdiag-nostic biomarkers [7]. A recent study re-ported a microRNA biomarker of HCC recurrence after liver transplantation from serum exosome samples [8]. Other studies have proposed microRNA biomarkers of HCC recurrence based on microRNA expression profiles from solid tumor biopsies [9–12].
Tumor biopsy followed by histopathology, or more re-cently genomic analysis, is a standard procedure to as-sess the type, severity, and prognosis of many cancers. Typically only one biopsy is taken from each patient. While this may be sufficient to determine whether a mass is malignant or benign, it is insufficient to capture within-patient tumor heterogeneity, which has been shown to exist both between tumor foci [13, 14] and within a single tumor [15, 16]. Therefore, biopsying and analyzing only one sample per patient runs the risk of failing to capture the cells driving the malignant pheno-type. While the goal of precision medicine is to harness between-patient tumor heterogeneity to tailor treatment to specific features of an individual's cancer profile, within-patient tumor heterogeneity poses a serious chal-lenge to this goal. Within-patient tumor heterogeneity affects both biomarker development and application. During development, heterogeneity will reduce the power to detect genomic signatures associated with the phenotype of interest. Even if a biomarker is successfully
developed, both good and poor prognosis signatures may be present within the same patient complicating clinical application.
Hepatocellular carcinoma (HCC) is particularly well suited to the study of within-patient heterogeneity be-cause it often presents with multiple tumor foci. In pa-tients with multifocal HCC, the individual lesions can arise from either local dissemination of the primary tumor or from the oncogenic predisposition of the dis-eased liver. In the latter case, a patient with multifocal HCC may have multiple tumors that are clonally unre-lated and presumably exhibit distinct genomic profiles. This presents a challenge to genomic analyses attempting to associate sample-level genomic profiles (e.g. microRNA expression) with patient-level phenotypic data (e.g. recurrence-free survival). Furthermore, recurrence of HCC post-transplantation is commonly associated with multifocal tumors.
The goals of this study are to: (1) further examine the association between microRNA expression, current transplantation selection criteria, and HCC recurrence, and (2) to develop a biomarker of HCC recurrence post-transplantation that is able to incorporate information from multiple tumor foci. The approach proposed in this paper addresses the challenge of within-patient heterogen-eity by developing a sample-level model of recurrence and coupling this model with patient-level information to make predictions.
Methods
Patient and sample description
The data are comprised of 180 tumor samples from 89 HCC patients who underwent liver transplantation at the University of Rochester Medical Center (GEO Series accession number GSE67140). This study was performed with approval of the University of Rochester Research Subjects Review Board (RSRB00029467). Liver explant pathology specimens (paraffin embedded blocks) from patients undergoing liver transplant for HCC were de-identified prior to processing and analysis, so individuals were exempt from consent. Demographics of the patient cohort are shown in Additional file 1: Table S1. Of these 97 tumor samples from 69 HCC patients were previ-ously described in Barry et al. [6]. By nearly doubling the number of tumor samples, we are able to investigate the effect of within-subject heterogeneity on microRNA bio-markers of HCC recurrence. Each patient was observed for 3 years and recurrence-free survival time (or censor-ing time) was recorded.
MicroRNA purification and array hybridization
used to isolate miRNA from formalin-fixed paraffin em-bedded (FFPE) liver tumor tissues. Samples were assessed for the presence of enriched miRNA using an Experion Bioanalyzer (Bio-Rad, Hercules, CA, USA). MicroRNA labeling was performed using the FlashTag Biotin RNA labeling kit (Genisphere, Hatfield, PA, USA). MicroRNA expression was assessed using Affymetrix GeneChip miRNA 1.0 microarrays (Affymetrix, Santa Clara, CA, USA). Array hybridization, washing, and staining was performed at the Upstate Medical University microarray core facility in Syracuse, NY, according to the manufac-turer’s instructions. Arrays were scanned using a Gene-Chip Scanner 7G Plus.
Quality control and data preprocessing
Array quality was assessed by visual inspection of re-sidual pseudo chip images, Normalized Unscaled Stand-ard Error (NUSE) medians and interquartile ranges, and Relative Log Expression (RLE) medians and interquartile ranges [17]. Of the 10 poor quality arrays, 6 were rehy-bridized resulting in improved quality. There was insuffi-cient genetic material to rehybridize the other four poor quality samples. Analysis was performed on 176 samples of acceptable quality from 89 HCC patients.
The data included in this study span four distinct batches, based on the date on which the microarray hybridization occurred. Samples from the same patient sometimes span multiple batches. All samples were processed and analyzed in the same manner.
Arrays were preprocessed using Robust Multi-array Average (RMA) [18]. Subsequent analysis was re-stricted to the 847 human microRNA probe sets. Recurrence-free survival time was the primary out-come of interest in these data. All data analyses were performed using the R/Bioconductor statistical com-puting environment [19]. The processed data and R scripts needed to reproduce all analyses were submit-ted with this manuscript as additional data files and made freely available on GitHub: https://github.com/ mccallm/HCCmicroRNA.
MicroRNA expression in multifocal tissue samples
For patients with unifocal HCC, patient-level and sample-level models are identical. In other words, re-currence post-transplantation is predicted based on the single observed sample. In the case of multifocal HCC, we obtained multiple samples from distinct tumor foci. In this case, it is important to distinguish between patient-level and sample-level modeling. Sam-ples from the same individual may have vastly different genomic profiles. As such, it is crucial to distinguish between the sample(s) that are driving recurrence and those that are not.
Visualization and examination of sample-level clustering
First, we used the t-Distributed Stochastic Neighbor Em-bedding (t-SNE) technique to visualize the distribution of samples. The t-SNE is a nonlinear dimensionality reduction technique that facilitates visualization of high dimensional data in two or three dimensions [20]. It is implemented in the R package Rtsne. Principal Compo-nent Analysis (PCA) was also used to visualize the data in a low dimensional space.
Second, we use several unsupervised learning algorithms to identify potential subgroups within the data. We eval-uated nine different unsupervised learning methods (Hierarchical clustering, KMeans, DiANA, Fanny, Pam, Clara, Som, Sota and Model based clustering) using the clValid package, and found that KMeans with 2 clusters resulted in the clearest separation between subgroups in our data. This appears consistent with the results from the t-SNE analysis.
Feature selection
One KMeans cluster (cluster one) consists mostly of samples from HCC recurrent patients, and the other cluster (cluster two) includes samples from both recur-rent and non-recurrecur-rent patients. Samples from recurrecur-rent patients in cluster one are labeled aspoor prognosis,and samples from non-recurrent patients in cluster two are labeled as good prognosis. The former class is comprised of 22 samples, and the latter contains 66 samples. These class labels address the possible ambiguity for multifocal patients with samples in both clusters and are used as training data for feature selection. By selecting the train-ing data in this manner, we guarantee that there are no patients who have samples in both the training and test-ing sets.
We used the 88 selected samples and their class labels to determine features that are associated with poor prog-nosis. Mutual information was used to measure the con-tribution of each feature to sample classification. The mutual information of a feature (X) and a class (Y) is the expected value of the point-wise mutual information over the HCC recurrence and non-recurrence outcomes, as follows:
I Xð ;YÞ ¼X y∈Y
X
x∈X
p xð ;yÞlog p xð ;yÞ
p xð Þp yð Þ
;
greater the mutual information value, the more the fea-ture is associated with HCC recurrence.
Biomarker assessment
We applied Naïve Bayes and Support Vector Machine learning models to assess the ability of the proposed bio-marker to predict sample membership in the subgroups. The Naive Bayes and Support Vector Machine functions are from R package, e1071 version 1.6-4. The Support Vector Machine kernel type used was a radial basis with a cost value of 1000. For both classifiers, the 88 previ-ously described samples were used as training data and the remaining 88 samples as test data. While multiple samples may come from the same patient, no patient had samples in both the training and test data sets.
Results
Visualization of microRNA Expression Reveals Two Subgroups
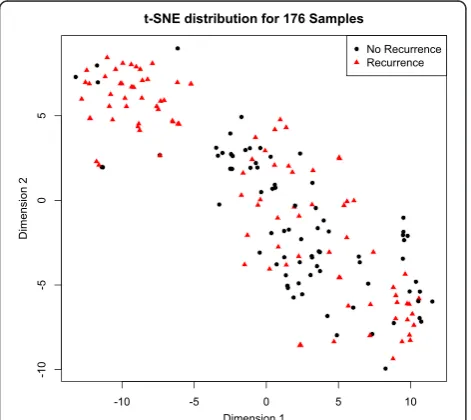
The data consist of 847 microRNAs measured across 176 samples. t-Distributed Stochastic Neighbor Embed-ding (t-SNE) facilitates visualization of high dimensional data in a low-dimensional space [20]. Samples that clus-ter in the low-dimensional space have a higher probabil-ity of association in higher dimensions. Projection of the microRNA expression data into two-dimensional space (Fig. 1) shows that the samples form two distinct
subgroups. In the top left subgroup, most of the samples are from recurrent patients, while samples in the bottom right subgroup are from a mix of recurrent and non-recurrent patients. A plot of the first two principal components (Additional file 1: Figure S1) also shows separation into two distinct subgroups. Because recur-rence applies to patients not samples, unsupervised sample-level analyses have the potential to uncover within-patient heterogeneity.
Unsupervised Clustering into Two Subgroups
To gain more insight into the groups observed in Fig. 1, we used KMeans clustering to group the data into two clusters. Similar to the t-SNE grouping, cluster 1 was comprised primarily of samples from recurrent patients, and cluster 2 was comprised of samples from both re-current and non-rere-current patients. For each sample, we calculated the distance between its microRNA expres-sion profile and the average expresexpres-sion profile of each subgroup (i.e. the two KMeans cluster centers). An MA-plot of the difference in distances (M = d2-d1) versus the average distance (A = {d1 + d2}/2) shows a clear separ-ation between the two subgroups (Fig. 2). Subgroup 1 (above the dashed line in Fig. 2) is comprised of 50
Fig. 1Two-dimensional representation of microRNA expression profiles.
176 samples with 847 dimensions are mapped into two dimensions via t-Dimensional Stochastic Neighbor Embedding using the Rtsne package. Samples closer together have more similar microRNA expression profiles. The samples from HCC recurrent patients are indicated with red triangles. The samples from non-recurrent patients are indicated with black circles. The majority of samples in the upper left are from recurrent patients; those in the bottom right are from a mixture of recurrent and non-recurrent patients
Fig. 2MA-plot of distance between the microRNA expression profile
samples, 43 of which are from recurrent patients and 7 of which are from non-recurrent patients. Subgroup 2 (below the dashed line in Fig. 2) is comprised of 126 samples, 71 of which are from non-recurrent patients and 55 of which are from recurrent patients. The data were acquired in four batches as described in the Methods Section. The batch in which the data were col-lected and analyzed does not appear to be strongly asso-ciated with subgroup, with the possible exception of batch 3, which is comprised of primarily non-recurrent patients (Additional file 1: Figure S2).
In Fig. 2, the labels,RecurrenceandNo Recurrence,are applied to all samples from a given patient; however, not all of the samples from that patient necessarily contrib-uted to the recurrence. Since a patient with multifocal disease may have multiple samples analyzed, and just one sample might be responsible for the recurrence, the samples in cluster 2 could include relatively benign sam-ples from either HCC recurrent patients or non-recurrent patients. In fact, 21 out of 55 samples (38 %) from recurrent patients in cluster 2 come from patients with at least one sample in cluster 1. In contrast, only 5 out of 71 samples (7 %) from non-recurrent patients in cluster 2 come from patients with at least one sample in cluster 1. This suggests that many of the samples from recurrent patients that fall in cluster 2 may not be re-sponsible for the recurrence; rather a different sample from the same patient that falls in cluster 1 may be re-sponsible for the recurrence. This highlights the ration-ale for using unsupervised clustering – the relationship between recurrence status and microRNA expression is complicated by the heterogeneity between samples from the same patient.
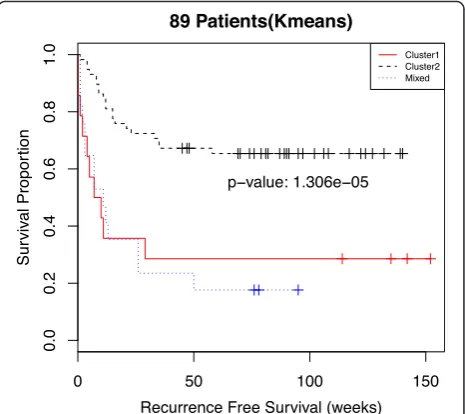
Sample-Level Clustering Is Associated with Patient Survival
Combining sample-level information across tumor foci, we can categorize patients into three groups. The first group is comprised of patients all of whose samples are in cluster 1. The second group is made up of patients all of whose samples are in cluster 2. The third group con-sists of patients with samples in both cluster 1 and cluster 2 (labeled asMixed). Additional file 1: Table S2 shows the distribution of samples between clusters stratified by the number of samples per patient. Kaplan-Meier survival curves for each of these three patient groups (Fig. 3) show that recurrence-free survival time is strongly differentiated by membership in one of the three groups (p-value = 1.3x10⁻⁵). A Cox proportional hazards model shows a sta-tistically significant difference between the poor prognosis and good prognosis groups but no discernable difference between the poor prognosis group and the mixed group (Additional file 1: Table S3). The hazard ratios from a multivariate Cox regression (Additional file 1: Table S4)
and Kaplan-Meier curves stratified by batch (Additional file 1: Figure S3) demonstrate that the results do not ap-pear to be strongly dependent on the batch variable. While there appears to be a strong association between group membership and recurrence-free survival, it is use-ful to look at the relationship between these groups and current clinical criteria for transplantation.
Association of microRNA expression with clinical covariates
Additional file 1: Figure S4 shows the association be-tween the two microRNA-based subgroups and four clinical criteria for transplantation: (A) vascularization, (B) focality, and (C) number of tumors, as well as (D) the Milan criteria (a combination of the other criteria). In general, criteria that favor transplantation are less common in the poor prognosis subgroup (cluster 1). Of note, 100 % (50/50) of samples in the poor prognosis subgroup are from vascularized tumors, while only 24 % (30/126) of the samples in the good prognosis subgroup show increased vascularization. Also, 84 % (42/50) of samples in the poor prognosis subgroup are from pa-tients who fall outside the Milan criteria. In contrast, 39 % (49/126) of samples in the good prognosis sub-group are from patients who fall within the Milan
Fig. 3Kaplan-Meier curves of recurrence-free survival for all 89
criteria. The Milan criteria reflect primarily patient-level measurements, so interpretation of their association with sample-level microRNA expression profiles is complicated by patients with samples in both subgroups. Additional file 1: Table S5 shows the distribution of patients across the Milan criteria and microRNA expression clusters. For the poor prognosis group, half (7/14) of the patients are outside Milan and half (7/14) are within Milan. For the good prognosis group the split is 30 of 58 within Milan and 28 of 58 outside Milan. The 17 patients in the mixed group are all outside Milan.
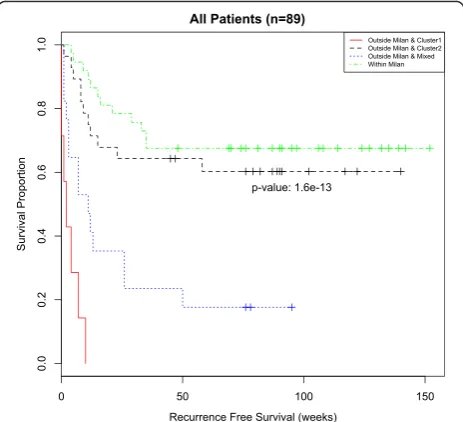
Previous work reported a biomarker that was strongly associated with recurrence-free survival time independent of Milan status [6]. While our unsupervised sample-level analysis showed a strong association with recurrence-free survival (Fig. 3) and a similar association in patients out-side Milan (Additional file 1: Figure S5A), it did not show a significant association with recurrence-free survival time for patients within Milan (Additional file 1: Figure S5B). In fact, patients outside Milan with microRNA expression profiles all in the good prognosis subgroup had similar recurrence-free survival to patients within Milan (Fig. 4), and both of these groups differed significantly from pa-tients outside Milan with at least one poor prognosis sample. A Cox proportional hazards model shows a sta-tistically significant difference between the Within Milan group and the Outside Milan & Cluster 1 (poor prognosis) group as well as the Outside Milan & Mixed group; however there was no discernable difference be-tween the Within Milan group and the Outside Milan & Cluster 2 (good prognosis) group (Additional file 1: Table S6).
This latter group, Outside Milan & Cluster 2 (good prognosis), represents a group of patients who would be deemed unfit for liver transplantation based on the Milan criteria but would appear to have a good chance of recurrence free survival if they received a liver trans-plant. In summary, it appears that there is a subset of patients who would benefit from microRNA profiling when used with the Milan criteria to determine trans-plantation. However, it is unlikely that all 847 micro-RNAs used to differentiate between the good and poor prognosis subgroups are associated with HCC recur-rence, nor would it be practical to perform microRNA profiling of tumor biopsies unless absolutely necessary. To obtain a clinically applicable microRNA biomarker, it is desirable to identify a subset of microRNAs that are actually associated with HCC recurrence.
Feature selection
The previous results are based on the expression of 847 microRNAs in each sample. We hypothesize that a rela-tively small subset of these are the primary biomarkers for HCC recurrence. To find such features, we used
mutual information as described in the Materials and Methods Section. After calculating the mutual informa-tion for each microRNA, we selected the top five fea-tures, which had mutual information values much greater than the rest (Additional file 1: Table S7). These five features are miR-122_st, miR-126_st, miR-15a_st, miR-22_st and miR-30a_st. Classification of patients into poor, mixed, and good prognosis clusters based on the expression of these five microRNAs exactly matched the classification using all 847 microRNAs. This means that the results shown in the Kaplan-Meier survival curves (Fig. 4) and Cox proportional hazard model (Additional file 1: Table S6) are identical whether one uses all 847 microRNAs or just these 5 microRNAs.
The first feature, miR-122, is specific to the liver and a reduced level of miR-122 is associated with HCC pro-gression and metastasis [21]. Next, miR-126 regulates angiogenesis and is normally expressed in endothelial cells, such as capillaries and larger blood vessels. It is
Fig. 4Kaplan-Meier curves of recurrence-free survival as delineated
also associated with innate immune response [22]. Func-tioning as a tumor suppressor, miR-15a targets oncogene BCL2, and within tumor cells miR-15a itself is down regulated [23]. In several cancers, miR-22 has been shown to be associated with differentiation, metastasis and prognosis. In HCC, miR-22 is especially down reg-ulated [24]. Down-regulation of miR-30a in HCC is strongly associated with decreased disease-free sur-vival. In addition, tumor cell migration, invasion and epithelial-mesenchymal transition are associated with its down-regulation [25]. In a recent study on micro-RNA profiling in HCC vascular invasion, miR-122,
miR-126, miR-15a, and miR-30a are down regulated in HCC samples with vascular invasion [26].
Discretized microRNA expression is associated with recurrence-free survival
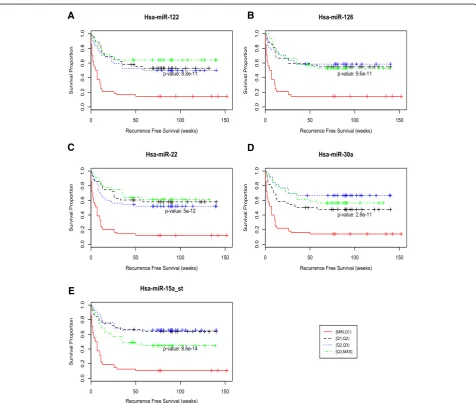
Figure 5 shows the recurrence free survival curves based on the four different expression intervals for the top five microRNAs. Patients with samples in the lowest interval, [min,Q1], have significantly worse survival than those with samples in the other three intervals. This suggests an association between recurrence and reduced expres-sion of these five microRNAs. Additional file 1: Figures
A
C
B
D
E
Fig. 5The relationship between microRNA expression and recurrence free survival time was examined for the five microRNAs with the highest
mutual information: (a) miR-122_st, (b) miR-126_st, (c) miR-30a_st, (d) miR-22_st, and (e) miR-15a_st. Kaplan-Meier HCC recurrence free survival for 5 microRNAs. Each of the 4 curves in the figures indicates survival times for a different quartile of microRNA expression values, with red being the lowest values and green the highest. It is clear from the red curves representing the lowest quartile expression values, that poor recurrence-free survival is associated with low levels of expression of these 5 microRNAs—p-values: 8.8x10⁻¹¹(miR-122), 9.6x 10⁻¹¹(miR-126), 5X10⁻¹²(miR-22),
S6–S10 show the expression values for the 5 miRNAs stratified by patient and colored by prognosis group. The centers shown in the figures (poor prognosis center and good prognosis center) are K-Means centers for each group.
The expression of these 5 microRNAs can be used to predict recurrence more expediently than using the full set of 847 microRNAs. To confirm the reduced feature set, we used supervised machine learning models to clas-sify samples as poor or good prognosis. Specifically, we used naïve Bayes and support vector machine learning models with these five microRNA features. As described in the Material and Methods Section, half the samples were used for training and the other half for testing. The naïve Bayes model successfully classifies 28 of the testing samples as poor prognosis, and 60 as good prognosis. The support vector machine model replicates the naïve Bayes results. Given that the poor prognosis class was shown to be strongly associated with recurrence, we can conclude that these five microRNAs are an effective re-duced feature set.
Finally, we examined the association between these five microRNAs and the measured clinical covariates. These 5 microRNAs appear to be associated with recur-rence and vascularization, and to a lesser degree tumor stage, HCV, and the Milan criteria (Additional file 1: Figures S11–S15).
Relationship to Previously Published Biomarker Approach
A previous approach to addressing within-subject het-erogeneity in a subset of these data was to summarize from sample-level microRNA expression to patient-level profiles by considering the two extrema for each micro-RNA (the minimum and maximum observed values within each patient) [6]. This approach was used to identify a biomarker of HCC recurrence in a subset of the data considered in this manuscript. Of the five microRNAs identified in this manuscript, two were also part of the previous biomarker, miR-122 and miR-22.
To examine the performance of the previous approach, we applied the min/max procedure to summarize micro-RNA expression to the patient level. Here we consider three different min/max feature sets: (1) the 60 features with an FDR < 0.2 (all microRNAs in Table 2 of [6]), (2) the 6 features that were most consistently selected dur-ing cross-validation (bold microRNAs in Table 2 of [6]), and (3) 16 microRNAs previously reported in the litera-ture as associated with HCC malignancy. We performed KMeans clustering on all 89 patients using each of these feature sets. Note that because the min/max procedure summarizes expression at the patient-level, clustering can be performed on patients rather than samples. While this differs from the biomarker methodology actu-ally used in the original manuscript, it allows the most
direct comparison to the results reported in this manu-script. MA-plots of the patient-level min/max expression profiles show a similar separation between recurrent and non-recurrent patients as the sample-level analysis (Additional file 1: Figures S16, S18, and S20). The 60 features seem to show the most separation between the two clusters; both the 16 and 6 feature sets result in a few samples that are approximately equidistant from both clusters.
Next, we examined the Kaplan-Meier recurrence-free survival curves based on each of the three feature sets (Additional file 1: Figures S17, S19, S21). All three fea-ture sets were able to classify patients into good and poor prognosis groups (p-values < 0.0001). Finally, we discretized microRNA expression into the four ranges used for the five microRNA biomarker reported here and examined the associated between each of the six microRNAs in feature set 2 and recurrence-free survival (Additional file 1: Figure S22).
Finally, we fit a Cox proportional hazards model using each of the three min/max feature sets together with the Milan criteria to group patients. All three feature sets were able to distinguish between the Within Milan group and the Outside Milan & Cluster 1 (poor progno-sis) group, and there was no discernable difference be-tween the Within Milan group and the Outside Milan & Cluster 2 (good prognosis) group (Additional file 1: Tables S8-S9). However, the estimated hazard ratios were substantially less using the min/max feature sets. The 16 and 60 min/max feature sets produced identical results with hazard ratios of 5.91 with a 95 % confi-dence interval of (2.87, 12.16). The 6 min/max feature set resulted in a hazard ratio of 5.29 with a 95 % confi-dence interval of (2.58, 10.88). In contrast the 5 micro-RNA biomarker proposed in this manuscript yielded a hazard ratio of 18.93 with a 95 % confidence interval of (6.74, 53.14).
Discussion
There are limited donor liver organs available for the HCC patients in need of liver transplantation. The dis-covery of biomarkers to predict HCC recurrence after liver transplantation is therefore important to appropri-ately use valuable organs. MicroRNAs are popular markers as they are logistically easy to obtain and can be effective in classifying tissue types and tumor tissues of origin [27]. Recent research has shown that a microRNA biomarker of HCC recurrence when used with the Milan criteria can improve prediction of recurrence post-transplantation [6].
profiles from the same patient are most strongly associ-ated with HCC recurrence. We assume that if HCC recurs after liver transplantation, there is at least one sample, and corresponding microRNA expression profile, that is re-sponsible for the recurrence. For patients with multifocal disease this implies that not all foci are equally responsible for recurrence. Previous approaches either analyzed only one sample per patient [9–12] or used summarized sample-level information from multifocal patients [6], whereas our approach uses both sample-level and patient-level information to predict recurrence. This has implica-tions for patients with highly heterogeneous microRNA expression profiles.
We identified five microRNAs that appear to be strongly associated with recurrence post transplantation. These five microRNAs (122_st, 126_st, miR-15a_st, miR-22_st and miR-30a_st) are down regulated in samples from recurrent patients. This is consistent with previous research that reported down-regulation of miR-30a through comparisons of tumor and non-tumor tissue and showed reduced disease-free survival times are significantly associated with down regulation of miR-30a [25]. Both miR-126 and miR-122 have been previ-ously reported as down regulated in HCC [11]. Finally, miR-15a was previously reported to be associated with shorter recurrence-free survival in HCC patients [9]. These five microRNAs represent a potential biomarker to predict HCC recurrence after liver transplantation, when used in concert with the Milan criteria. Develop-ment and validation of an assay to exclusively measure these five microRNAs is necessary to determine the clin-ical utility of the proposed biomarker.
The number of distinct tumor foci is associated with disease severity as well as recurrence post-transplantation, and together with tumor size, tumor number is a key component of the Milan criteria. Furthermore, patients for whom multiple foci were analyzed are more likely to exhibit heterogeneous microRNA expression profiles sim-ply due to a greater number of samples undergoing gen-omic analysis. For this reason, we do not assign special significance to the mixed subgroup (Figs. 3 and 4), rather we consider this subgroup to be comparable to the poor prognosis subgroup. Patients in either of these subgroups have at least one poor prognosis sample and have gener-ally poorer recurrence free survival following transplant-ation. However, several studies have reported intra-tumor heterogeneity itself as a predictor of prognosis [28, 29] and suggested focusing further investigations on the underlying causes of heterogeneity [30].
A key finding is that for patients with heterogeneous miRNA expression values, a subset of the within-patient values can be statistically significant predictors of post transplant recurrence. In particular, there are 17 patients from the mixed group who have samples from both
clusters (Additional file 1: Table S2). Patient-level sum-maries for these patients based on average expression are potentially misleading due to the heterogeneity be-tween samples from the same patient. Failure to account for within-patient heterogeneity can negatively impact both biomarker development and application. Further-more, patients with heterogeneous microRNA expres-sion profiles consistently fall outside the Milan criteria (Additional file 1: Table S5) and have recurrence free survival comparable to patients with purely poor prog-nosis microRNA expression profiles (Fig. 3).
In this work, we have focused on within-patient tumor heterogeneity. Heterogeneity has also been reported within individual samples [31, 32] and between patients with the same cancer subtype [33]. While methods have been developed to address each of these types of hetero-geneity [34, 35], careful modeling of these sources of heterogeneity remains an important challenge in gen-omic medicine.
Despite these limitations, the results reported in this manuscript suggest that microRNA expression profiling of distinct tumor foci could improve prediction of recur-rence and therefore aid in determining candidates for transplantation. Specifically, measuring the expression of these five microRNAs may represent a low cost addition to standard evaluation. However, increased data collec-tion comes with a cost –very small tumors with defini-tive radiographic characteristics of HCC are seen frequently but difficult to biopsy because of their small size. Furthermore, small nodules can be difficult to distinguish from regenerative nodules in the cir-rhotic liver. Finally, one must weigh the additional in-formation gained against the risk of multiple biopsies; in HCC, one is often biopsying a diseased liver with an increased risk of bleeding. When biopsy is com-bined with a tumor ablative technique such as radio-frequency ablation, bleeding risks are minimized by cauterizing along the biopsy needle tract. Therefore, tumor sampling for genomic analysis is perhaps best performed in the Interventional Radiology Suite or the operating room. The clinical challenge in survey-ing the entire tumor burden in a patient is formidable and will require a combination of advances in both medical and genomic techniques.
Conclusions
Ethics approval and consent to participate
This study was performed with approval of the Univer-sity of Rochester Research Subjects Review Board (RSRB00029467). Liver explant pathology specimens (paraffin embedded blocks) from patients undergoing liver transplant for HCC were de-identified prior to processing and analysis, so individuals were exempt from consent.
Consent to publish
Not applicable.
Availability of data and materials
Raw data are available via the Gene Expression Omnibus (GEO) with accession number GSE67140: http:// www.ncbi.nlm.nih.gov/geo/query/acc.cgi?acc=GSE67140. Processed and annotated data, as well as R scripts for the analyses are freely available on GitHub: https:// github.com/mccallm/HCCmicroRNA.
Description of additional data files
The Supplementary Materials contain additional Figures (S1–S22) and Tables (S1–S9) referenced in the manu-script. All supplementary tables and figures are included in a single file: SupplementaryMaterials.docx.
Additional file
Additional file 1:Supplementary Materials. (DOCX 3656 kb)
Abbreviations
GEO:Gene Expression Omnibus; HCC: Hepatocellular carcinoma;
PCA: Principal components analysis; t-SNE: t-Distributed stochastic neighbor embedding.
Competing interests
They authors declare that they have no competing interests.
Authors’contributions
QYX carried out the analyses and drafted the manuscript. AA helped conceive the analyses and was involved in the coordination and implementation of the study. CLW performed pathological analyses. CTB conceived of the study, collected the samples, and coordinated and implemented the study. MNM conceived the analyses, processed the data, was involved in the coordination and implementation of the study, and helped draft the manuscript. All authors have read and approved the final version of the manuscript.
Acknowledgements
The authors thank Kuang Hsiang Chuang for his technical contribution.
Funding
The work of MNM and QYX was partially funded by the National Human Genome Research Institute of the National Institutes of Health under Award Number R00HG006853. The content is solely the responsibility of the authors and does not necessarily represent the official views of the National Institutes of Health. This work was also supported by the Roche Organ Transplant Research Fund (# 871634732) and the Wilmot Cancer Center.
Author details
1Department of Biostatistics and Computational Biology, University of
Rochester Medical Center, Rochester, NY, USA.2Department of Pathology,
University of Rochester Medical Center, Rochester, NY, USA.3Department of Surgery, University of Rochester Medical Center, Rochester, NY, USA.
4Department of Biomedical Genetics, University of Rochester Medical Center,
Rochester, NY, USA.
Received: 6 November 2015 Accepted: 21 March 2016
References
1. Yang JD, Roberts LR. Epidemiology and management of hepatocellular carcinoma. Infect Dis Clin North Am. 2010;24:899–919. viii.
2. Ferlay J, Soerjomataram I, Ervik M, Dikshit R, Eser S, Mathers C, et al. GLOBOCAN 2012 v1.0, Cancer Incidence and Mortality Worldwide: IARC CancerBase No. 11. Lyon, France: International Agency for Research on Cancer. 2013. Available from: http://globocan.iarc.fr. Accessed on 06/07/2015. 3. Rahib L, Smith BD, Aizenberg R, Rosenzweig AB, Fleshman JM, Matrisian LM.
Projecting cancer incidence and deaths to 2030: the unexpected burden of thyroid, liver, and pancreas cancers in the United States. Cancer Res. 2014;74(11):2913–21.
4. El-Serag HB. Hepatocellular carcinoma. N Engl J Med. 2011;365:1118–27. 5. Mazzaferro V, Regalia E, Doci R, Andreola S, Pulvirenti A, Bozzetti F, Montalto
F, Ammatuna M, Morabito A, Gennari L. Liver transplantation for the treatment of small hepatocellular carcinomas in patients with cirrhosis. N Engl J Med. 1996;334(11):693–9.
6. Barry CT, D’Souza M, McCall M, Safadjou S, Ryan C, Kashyap R, Marroquin C, Orloff M, Almudevar A, Godfrey TE. Micro RNA expression profiles as adjunctive data to assess the risk of hepatocellular carcinoma recurrence after liver transplantation. Am J Transplant. 2012;12(2):428–37.
7. Pichler M, Calin GA. MicroRNAs in cancer: from developmental genes in worms to their clinical application in patients. Br J Cancer. 2015. doi:10.1038/bjc.2015.253.
8. Sugimachi K, Matsumura T, Hirata H, Uchi R, Ueda M, Ueo H, et al. Identification of a bona fide microRNA biomarker in serum exosomes that predicts hepatocellular carcinoma recurrence after liver transplantation. Br J Cancer. 2015;112:532–8.
9. Huang YH, Lin KH, Chen HC, Chang ML, Hsu CW, Lai MW, et al. Identification of postoperative prognostic microRNA predictors in hepatocellular carcinoma. PLoS One. 2012;7(5):e37188.
10. Xia H, Ooi LL, Hui KM. MiR-216a/217-induced epithelialmesenchymal transition targets PTEN and SMAD7 to promote drug resistance and recurrence of liver cancer. Hepatology. 2013;58(2):629–41. 11. Gong J, He X, Tian D. Emerging role of microRNA in hepatocellular
carcinoma (Review). Oncol Lett. 2015;9(3):1027–33.
12. Han Z, Zhong L, Teng M, Fan J, Tang H, Wu J, et al. Identification of recurrence-related microRNAs in hepatocellular carcinoma following liver transplantation. Mol Oncol. 2012;6(4):445–57.
13. Arora R, Koch MO, Eble JN, Ulbright TM, Li L, Cheng L. Heterogeneity of Gleason grade in multifocal adenocarcinoma of the prostate. Cancer. 2004;100(11):2362–6.
14. Cheng L, MacLennan GT, Zhang S, Wang M, Zhou M, Tan PH, et al. Evidence for polyclonal origin of multifocal clear cell renal cell carcinoma. Clin Cancer Res. 2008;14(24):8087–93.
15. Yachida S, Jones S, Bozic I, Antal T, Leary R, Fu B, et al. Distant metastasis occurs late during the genetic evolution of pancreatic cancer. Nature. 2010;467:1114–7.
16. Gerlinger M, Rowan AJ, Horswell S, Larkin J, Endesfelder D, Gronroos E, et al. N Engl J Med. 2012;366:883–92.
17. Bolstad BM, Collin F, Brettschneider J, Simpson K, Cope L, Irizarry RA, Speed TP. Quality Assessment of Affymetrix GeneChip Data. In: Gentleman R, Carey V, Huber W, Irizarry R, Dudoit S, editors. Bioinformatics and Computational Biology Solutions Using R and Bioconductor. Springer: New York; 2005. p. 33–47.
18. Irizarry RA, Hobbs B, Collin F, Beazer-Barclay YD, Antonellis KJ, Scherf U, Speed TP. Biostatistics. 2003;4(2):249–64.
20. Van der Maaten LJP, Hinton GE. Visualizing High-Dimensional Data Using t-SNE. J Mach Learn Res. 2008;9:2579–605.
21. Coulouarn C, Factor VM, Anderson JB, Durkin ME, Thorgeirsson SS. Loss of miR-122 expression in liver cancer correlates with suppression of the hepatic phenotype and gain of metastatic properties. Oncogene. 2009;28(40):3526–36.
22. Bai Y, Lu W, Han N, Bian H, Zhu M. Functions of miR126 and innate immune response. Yi Chuan. 2014;36(7):631–6.
23. Cimmino A, Calin GA, Fabbri M, Iorio MV, Ferracin M, Shimizu M, et al. Proc Natl Acad Sci. 2005;102(39):13944–9.
24. Zhou L, He J, Zhang Y. MicroRNA-22 expression in hepatocellular carcinoma and its correlation with ezrin protein. J Int Med Res. 2013;41(4):1009–16.
25. Liu Z, Tu K, Liu Q. Effects of microRNA-30a on migration, invasion and prognosis of hepatocellular carcinoma. FEBS Lett. 2014;588(17):3089–97. 26. Chuang KS, Whitney-Miller CL, Chu CY, Zhou ZR, Dokus MK, Schmit S, Barry
CT. MicroRNA-494 Is a Master Epigenetic Regulator of Multiple Invasion-Suppressor MicroRNAs by Targeting Ten Eleven Translocation 1 in Invasive Human Hepatocellular Carcinoma Tumors. Hepatology. 2015. doi:10.1002/hep.27816.
27. Lu J, Getz G, Miska EA, Alvarez-Saavedra E, Lamb J, Peck D, et al. MicroRNA expression profiles classify human cancers. Nature. 2005;435:834–8. 28. McGranahan N, Burrel RA, Endesfelder D, Novelli MR, Swanton C. Cancer
chromosomal instability: therapeutic and diagnostic challenges. EMBO Rep. 2012;13:528–38.
29. Park SY, Gonen M, Kim HJ, Michor F, Polyak K. Cellular and genetic diversity in the progression of in situ human breast carcinomas to an invasive phenotype. J Clin Invest. 2010;120(2):636–44.
30. de Bruin EC, Taylor TB, Swanton C. Intra-tumor heterogeneity: lessons from microbial evolution and clinical implications. Genome Med. 2013;5:101. 31. Liotta L, Petricoin E. Molecular profiling of human cancers. Nat Rev Genet.
2000;1:48–56.
32. Wang Y, Xia XQ, Jia Z, Sawyers A, Yao H, Wang-Rodriquez J, et al. In silico dissection of cell-type-associated patterns of gene expression in prostate cancer. Cancer Res. 2010;70:6448–55.
33. Ecker S, Pancaldi V, Rico D, Valencia A. Higher gene expression variability in the more aggressive subtype of chronic lymphocytic leukemia. Genome Med. 2015;7:8.
34. Quon G, Haider S, Deshwar AG, Cui A, Boutros PC, Morris Q. Computational purification of individual tumor gene expression profiles leads to significant improvements in prognostic prediction. Genome Med. 2013;5:29. 35. Bravo HC, Pihur V, McCall M, Irizarry R, Leek J. Gene expression anti-profiles
as a basis for accurate universal cancer signatures. BMC Bioinformatics. 2012;13:272.
• We accept pre-submission inquiries
• Our selector tool helps you to find the most relevant journal
• We provide round the clock customer support
• Convenient online submission
• Thorough peer review
• Inclusion in PubMed and all major indexing services • Maximum visibility for your research
Submit your manuscript at www.biomedcentral.com/submit