R E S E A R C H
Open Access
A comparison of brain magnetic resonance
imaging lesions in multiple sclerosis by
race with reference to disability
progression
Yuri Nakamura
1, Laura Gaetano
2,3, Takuya Matsushita
1, Altermatt Anna
2,4, Till Sprenger
5, Ernst-Wilhelm Radue
6,
Jens Wuerfel
2,4, Lorena Bauer
2,7, Michael Amann
2,3,8, Koji Shinoda
1, Noriko Isobe
9, Ryo Yamasaki
1,
Takahiko Saida
10,11, Ludwig Kappos
3and Jun-ichi Kira
1*Abstract
Background:We compared the magnetic resonance imaging (MRI) features between Japanese and Caucasian
patients with multiple sclerosis (MS), and identified the relationships between MRI features and disability. Methods: From the baseline data of phase II fingolimod trials, 95 Japanese and 246 Caucasian relapsing-remitting MS patients were enrolled. The number, volume, and distribution of brain MRI lesions were evaluated using T2-weighted (T2W) images. Cross-sectional total normalized brain volume (NBV), normalized cortical gray matter volume, normalized deep gray matter volume (NDGMV), normalized white matter volume (NWMV), and normalized thalamic volume were measured.
Results:Japanese patients had significantly lower Expanded Disability Status Scale (EDSS) scores than Caucasian patients (mean 2.0 vs. 2.3,p= 0.008), despite a similar disease duration. Japanese patients showed a trend towards fewer T2W-lesions (median 50 vs. 65,p= 0.08) and significantly lower frequencies of cerebellar and parietal lobe lesions (p= 0.02 for both) than Caucasian patients. There were no differences in T2W-lesion volume between races, whereas Japanese patients had a significantly larger T2W-lesion volume per lesion compared with Caucasian patients (median 140 mm3vs. 85 mm3,p< 0.0001). T2W-lesion volumes were positively correlated with EDSS scores in Japanese patients (p< 0.0001). In both races, NBV, normalized cortical gray matter volume, NDGMV, and thalamic volume were negatively correlated with disease duration and EDSS scores (p< 0.01 for all). NWMV was negatively correlated with disease duration and EDSS scores only in Caucasian patients (p= 0.03 andp= 0.004, respectively). NBV, NDGMV, NWMV, and thalamic volume were consistently smaller in Japanese compared with Caucasian patients throughout the entire examined disease duration (p= 0.046,p= 0.01,p= 0.005, andp= 0.04, respectively). Japanese patients had a significantly faster reduction in NDGMV (p= 0.001), particularly for thalamic volume (p= 0.001), with disease duration compared with Caucasian patients.
Conclusions:Gray matter atrophy is a common denominator for disability in Japanese and Caucasian patients.
Additional contributory factors for disability include T2W-lesion volume in Japanese patients and white matter atrophy in Caucasian patients. Less frequent parietal and cerebellar involvement with fewer T2W-lesions may underlie milder disability in Japanese patients.
Keywords: Brain lesions, Brain volume, Disability, Magnetic resonance imaging, Multiple sclerosis, Progression, Race
* Correspondence:[email protected]
1Department of Neurology, Neurological Institute, Graduate School of
Medical Sciences, Kyushu University, 3-1-1 Maidashi, Higashi-ku, Fukuoka 812-8582, Japan
Full list of author information is available at the end of the article
Background
Multiple sclerosis (MS) is an autoimmune demyelinating disorder of the central nervous system, caused by a com-plex interaction between environmental and genetic fac-tors. As such, the clinical and magnetic resonance imaging (MRI) features of MS are likely influenced by differences in genetic backgrounds between racial groups. Indeed, in-dividuals with African ancestry, who develop MS less fre-quently than those with European ancestry [1], show more rapid disease progression after MS onset [2,3].
The prevalence of MS is also low in individuals with Asian ancestry, including Japanese people. To our know-ledge, only one study has conducted a direct comparison of disease severity between British and Japanese MS pa-tients. This institutional study, which took place after the discovery of a specific biomarker for neuromyelitis optica (neuromyelitis optica IgG) revealed that Japanese MS patients exhibited milder disability compared with Caucasian patients [4]. The fourth nationwide survey of MS in Japan also showed that only 49.5% of patients with the conventional form of MS had brain lesions ful-filling the Barkhof criteria [5] after an average disease duration of 10.4 years [6]. This proportion was much lower than that for Caucasian patients, with 74% of pa-tients with early relapsing-remitting MS (RRMS) [7], and approximately 50% of patients with clinically isolated syndrome [8], having brain lesions fulfilling the Barkhof criteria after a disease duration of 2 years.
Two studies have suggested that Japanese patients with MS may have lower cerebellar involvement and fewer intra-cortical lesions, as revealed by MRI, than Caucasian patients [9,10]. In addition, although the Swanton modi-fied criteria can predict the conversion from a clinically isolated syndrome to clinically definite MS according to baseline MRI findings with high sensitivity and accuracy in Western countries [11,12], the sensitivity of these cri-teria was reported to be far lower in Asian individuals [13]. These observations suggest that the milder MS sever-ity found in Japanese compared with Caucasian individ-uals may relate to a lower frequency of brain lesions.
To our knowledge, no studies have performed a direct MRI comparison between Asian and Caucasian MS pa-tients using the same imaging protocol. Thus, in the present study, we directly compared brain MRI findings in Japanese and Caucasian MS patients, using pooled baseline data from the phase II fingolimod trials in Japan and Western countries, obtained using a standardized MRI protocol, with the aim to clarify the mechanisms of the milder disease course in Japanese MS patients.
Methods Patients
We examined brain MRI from a population of patients with RRMS selected from pooled baseline data from
phase II fingolimod trials for treatment of MS. The trials were conducted at 32 centers in 10 European countries and Canada, and at 43 centers in Japan. All participants from Europe and Canada were Caucasian, and all partic-ipants from Japan were Japanese. The eligibility criteria for the core studies were previously described in detail [14, 15]. In brief, participants were between 18 and 60 years of age, with a clinical diagnosis of relapsing MS. Patients had at least one of the following: one or more relapses in the previous year before enrollment, two or more relapses in the previous 2 years, and at least one contrast-enhanced T1-weighted (T1W) brain lesion on baseline MRI. Patients also had at least one T2-weighted (T2W) brain lesion, were neurologically stable without relapse, and had a Kurtzke’s Expanded Disability Status Scale (EDSS) score [16] ranging from 0 to 6. Exclusion criteria were use of corticosteroids (within the previous 30 days), immunomodulatory therapy (within the prior 3 months), or immunosuppressive treatment (e.g., aza-thioprine or methotrexate within the past 6 months).
We collected baseline demographic and clinical data including sex, age, disease duration from the initial symptom, EDSS score, Multiple Sclerosis Severity Score (MSSS), and previous MS treatment exposure such as disease-modifying drugs (DMDs) or immunosuppressive therapy. Of the participants who met the baseline eligi-bility criteria for the phase II fingolimod clinical trial, 167 Japanese and 250 Caucasian patients had RRMS. In the Japanese RRMS group, 70 patients did not consent to take part in the present study and were not included. Clinical parameters from two of the Japanese patients were unavailable, and these patients were excluded from this study. In the Caucasian RRMS group, four patients were excluded as their baseline scans or clinical parame-ters were unavailable. Demographics and MRI parameparame-ters were available for a total of 95 Japanese and 246 Caucasian patients. All participants provided written informed con-sent, and the research protocol for the study was approved by the Kyushu University Ethics Committee.
Image acquisition
MRI images were obtained using 1.5 T scanners with in-terleaved axial 3.0-mm-thick slices, field of view = 25 cm, and matrix = 128 × 128. The imaging protocol in-cluded axial proton density (repetition time [TR] 2800– 3800 ms; echo time [TE] 14–40) and T2W fast/turbo spin echo (TR 2800–3800 ms; TE 80–1200 ms). Add-itionally, T1W conventional spin echo (TR 500–650 ms; TE 10–20 ms) and post-contrast T1W spin-echo images (TR 500–650 ms; TE 10–20 ms) were obtained.
MRI analysis
were blinded to clinical information, conducted T2W-le-sion segmentation on T2W images using semi-automatic thresholding contour software with an interactive digital analysis program (AMIRA V.3.1.1; Mercury Computer Systems Inc., Hillsboro, OR, USA). To compare the number, volume, and distribution of T2W-lesions be-tween the Japanese and Caucasian cohorts, we selected only patients with MRI scans that completely covered the regions from the medulla to the top of the parietal lobe. Scans from 93 Japanese and 72 Caucasian patients were available for evaluation of total T2W-lesion num-ber and volume. We also used this dataset to calculate the average T2W-lesion volume in individuals (dividing the total T2W-lesion volume by the number of T2W-lesions) in the Japanese and Caucasian cohorts. The distribution and location of T2W-lesions were de-termined as follows. Segmented hyper-intense T2W-le-sions in native space were linearly registered to the T1 images, which were then registered to the Montreal Neurological Institute (MNI) standard space template using a linear and nonlinear transformation method. The resulting transformation matrix was applied to the T2W-lesion mask previously registered to T1 images. We conducted a quality assessment of the procedure, and patients without successful registration to the stand-ard were excluded from the analysis. Once the T2W-lesions were translated to MNI space, we automat-ically assessed the presence or absence of lesions in each brain lobe according to the Talairach atlas (i.e., frontal lobe, occipital lobe, parietal lobe, temporal lobe, limbic area, sub-lobar area, cerebellum, and brainstem), as well as the number and volume of lesions in the whole brain.
We used the entire cohort to measure total normalized brain volume (NBV), normalized cortical (NCGMV) and deep gray matter volume (NDGMV), and normalized white matter volume (NWMV) using the Structural Image Evaluation Using Normalization of Atrophy X (SIENAX) program [17]. This software uses a fully automated algo-rithm to estimate cross-sectional brain volume using a single time-point scan [18], performs segmentation of the brain from non-brain tissue in the head, and estimates the outer skull surface. The brain and skull images are then registered to a standard space brain and skull image de-rived from the MNI152 standard image. This step enables estimation of the volumetric scaling factor used for normalization of head size. To increase the reproducibility among patients, NBV, NWMV, NCGMV, and NDGMV were assessed in the 70-mm central area of the brain (z-block; MNI152 z-coordinates −10-mm bottom to + 60-mm top). Finally, we separately assessed the normal-ized thalamic volume from the NDGMV using the FMRIB’s Integrated Registration and Segmentation Tool algorithm [19]. We performed a quality assessment to en-sure the correct segmentation of each compartment.
T2W-lesions of 68 Japanese and 57 Caucasian patients were successfully registered to the MNI space and in-cluded in the final analysis. When comparing clinical features between the Japanese and Caucasian subgroups for evaluation of T2W-lesion distribution, we found similar trends in the demographic features to those in the total study population (data not shown). Based on white matter, cortical, and deep gray matter segmenta-tion, scans from 83 Japanese and 233 Caucasian patients were available for NBV comparison, from 45 Japanese and 148 Caucasian patients for evaluation of NWMV, from 52 Japanese and 165 Caucasian patients for evalu-ation of NCGMV, and from 73 Japanese and 207 Cauca-sian patients for evaluation of NDGMV and normalized thalamic volume. When comparing clinical features in the Japanese and Caucasian subgroups of brain volume measurement, we found similar trends to the demo-graphic features (data not shown).
Statistical analyses
All analyses were performed using statistical software (JMP 13.0.0; SAS Institute Inc., Cary, NC, USA) or R. The Fisher’s exact probability test was used to compare categorical variables, while the Mann–Whitney U test was used to compare continuous variables, including age, age at onset, disease duration from the first symp-tom, EDSS score, MSSS, and MRI parameters, between Japanese and Caucasian patients. Race-based differences in MRI parameters, number and volumes of
T2W-le-sions, individual T2W-lesion size, NBV, NWMV,
NCGMV, NDGMV, and normalized thalamic volume were assessed by multivariate linear regression analyses adjusting for age, sex, disease duration from the initial symptom, and MS treatment exposure. To meet the nor-mality assumption for the regression model, the cube root transformation was applied to the number or vol-ume of the total T2W-lesions, or individual T2W-lesion size prior to data analysis. Correlations of EDSS scores with brain volumes were examined using Spearman’s correlation. Linear regression analysis was used to exam-ine the association of disease duration with brain vol-ume. We also performed a test of homogeneity of slope to examine differences in the rate of brain volume re-duction with disease duration, and a test of homogeneity of intercept to examine differences in brain volume at the early course of the disease, between the two racial groups. Statistical significance was set atp< 0.05. A stat-istical trend was assumed ifp< 0.1.
Results
Clinical characteristics
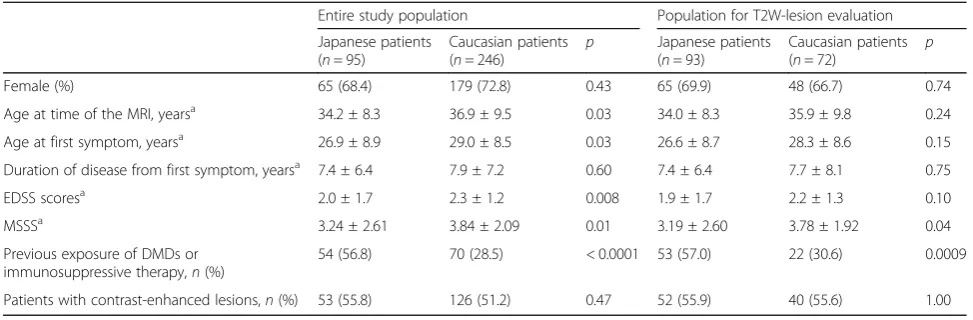
The demographics and clinical characteristics of the Japanese and Caucasian groups are shown in Table 1
women and duration of disease from the first symptom were similar between the Japanese and Caucasian groups. In the total study population, Japanese patients were younger at the time of MRI scans (mean 34.2 vs. 36.9 years, respectively;p= 0.03) and at the onset of the first symptom (mean 26.9 vs. 29.0 years, respectively; p= 0.03), and had lower EDSS scores (mean 2.0 vs. 2.3, respectively; p= 0.008) and MSSS (mean 3.24 vs. 3.84, respectively; p= 0.01), compared with Caucasian patients. The proportion of patients with previous MS treatment exposure, including DMDs or immunosuppres-sive therapy, was significantly higher in Japanese patients compared with Caucasian patients (56.8% vs. 28.5%, re-spectively; p< 0.0001). The demographics of the subset used for the T2W-lesion evaluation are summarized in Table 1 (see “Population for T2W-lesion evaluation”). Japanese patients in this subset also had significantly lower MSSS (mean 3.19 vs. 3.78, respectively; p= 0.04) and a higher frequency of previous MS treatment exposure (57.0% vs. 30.6%, respectively; p= 0.0009) compared with Caucasian patients.
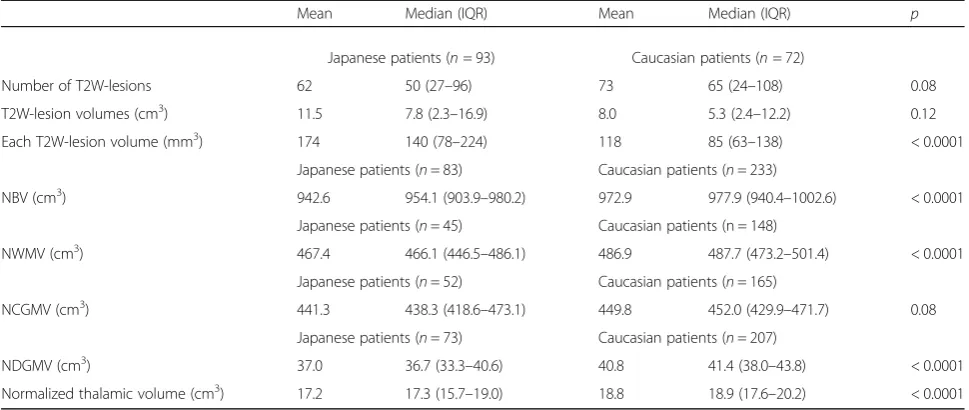
Comparison of MRI findings between Japanese and Caucasian patients with MS
After adjusting for age, sex, duration of disease from the first symptom, and previous MS treatment exposure, Japanese patients showed a trend towards fewer T2W-lesions than Caucasian patients (median 50 vs. 65, re-spectively; p= 0.08; Table 2). However, there were no significant differences in the volume of T2W-lesions between the two groups (median 7.8 cm3 vs. 5.3 cm3, respectively; p= 0.12). Japanese patients had a signifi-cantly larger mean volume per lesion compared with Caucasian patients (median 140 mm3 vs. 85 mm3, re-spectively; p< 0.0001). The proportion of patients with cerebellar lesions was significantly lower in Japanese
patients compared with Caucasian patients (45.6% vs. 66.7%, respectively; p= 0.02; Fig. 1), which was also ob-served for patients with lesions in the parietal lobe (89.7% vs. 100%, respectively; p= 0.02). There were no differences in any other brain regions between the two groups.
After adjusting for confounding factors, Japanese pa-tients had significantly smaller NBV, NWMV, and NDGMV compared with Caucasian patients (NBV me-dian 954.1 cm3 vs. 977.9 cm3, respectively; p < 0.0001; NWMV median 466.1 cm3 vs. 487.7 cm3, respectively, p< 0.0001; NDGMV median 36.7 cm3 vs. 41.4 cm3, re-spectively; p < 0.0001; Table 2). Among NDGMV, nor-malized thalamic volume of Japanese patients was also significantly smaller than that of Caucasian patients (median 17.3 cm3vs. 18.9 cm3, respectively;p< 0.0001). Japanese patients also showed a trend towards a smaller NCGMV compared with Caucasian patients (median 438.3 cm3vs. 452.0 cm3, respectively;p= 0.08).
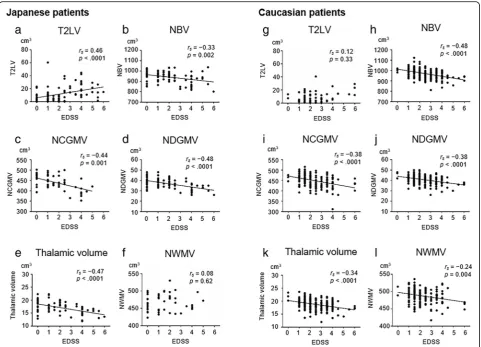
Correlation of brain MRI metrics with EDSS scores in Japanese and Caucasian MS patients
EDSS scores were correlated with T2W-lesion volumes in Japanese patients (rs= 0.46, p< 0.0001; Fig. 2a), but
not Caucasian patients (rs= 0.12,p= 0.33; Fig.2g). NBV,
NCGMV, and NDGMV were significantly correlated with EDSS scores in both Japanese patients (NBV rs
=−0.33, p= 0.002; NCGMV rs=−0.44, p= 0.001;
NDGMV rs=−0.48, p< 0.0001; Fig.2b–d) and Caucasian
patients (NBV rs=−0.48, p< 0.0001; NCGMV rs=−0.38, p< 0.0001; NDGMV rs=−0.38, p< 0.0001; Fig. 2h–j). In
both populations, EDSS scores were also negatively correlated with normalized thalamic volume (Japanese rs=−0.47, p< 0.0001; Caucasian rs=−0.34, p< 0.0001;
Fig. 2e and k). There was a weak correlation of
Table 1Comparison of baseline characteristics between Japanese and Caucasian patients with MS
Entire study population Population for T2W-lesion evaluation Japanese patients
(n= 95)
Caucasian patients (n= 246) p
Japanese patients (n= 93)
Caucasian patients (n= 72) p
Female (%) 65 (68.4) 179 (72.8) 0.43 65 (69.9) 48 (66.7) 0.74
Age at time of the MRI, yearsa 34.2 ± 8.3 36.9 ± 9.5 0.03 34.0 ± 8.3 35.9 ± 9.8 0.24 Age at first symptom, yearsa 26.9 ± 8.9 29.0 ± 8.5 0.03 26.6 ± 8.7 28.3 ± 8.6 0.15 Duration of disease from first symptom, yearsa 7.4 ± 6.4 7.9 ± 7.2 0.60 7.4 ± 6.4 7.7 ± 8.1 0.75
EDSS scoresa 2.0 ± 1.7 2.3 ± 1.2 0.008 1.9 ± 1.7 2.2 ± 1.3 0.10
MSSSa 3.24 ± 2.61 3.84 ± 2.09 0.01 3.19 ± 2.60 3.78 ± 1.92 0.04
Previous exposure of DMDs or immunosuppressive therapy,n(%)
54 (56.8) 70 (28.5) < 0.0001 53 (57.0) 22 (30.6) 0.0009
Patients with contrast-enhanced lesions,n(%) 53 (55.8) 126 (51.2) 0.47 52 (55.9) 40 (55.6) 1.00
a
Values are expressed as mean ± standard deviation
NWMV with EDSS scores in Caucasian patients (rs=
−0.24, p= 0.004; Fig. 2l), but not in Japanese patients (rs= 0.08,p= 0.62; Fig. 2f).
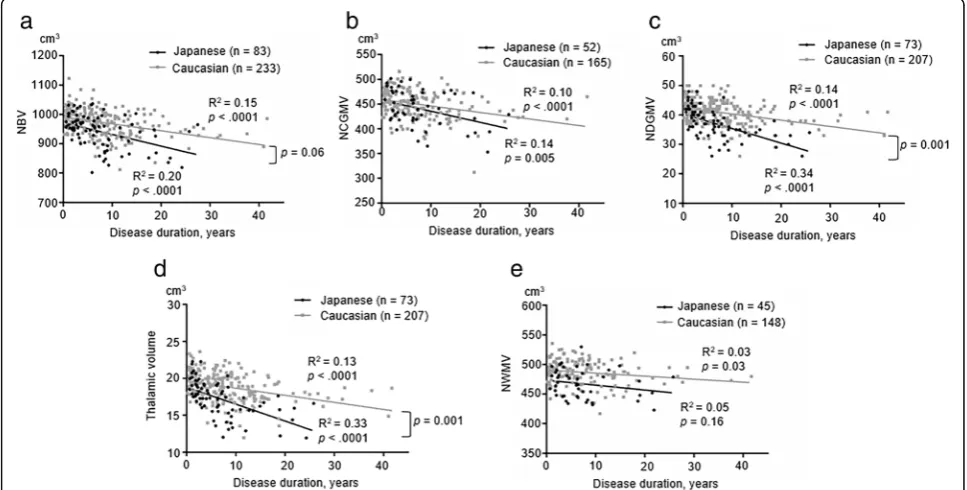
Association of brain volume with disease duration in MS patients
To assess the trajectory of brain volume reduction with respect to disease duration from the first symptom, we analyzed the association of disease duration with brain volume. NBV (Japanese R2= 0.20, p< 0.0001; Cauca-sian R2= 0.15, p< 0.0001), NCGMV (Japanese R2= 0.14, p= 0.005; Caucasian R2= 0.10, p< 0.0001), and NDGMV (Japanese R2= 0.34,p< 0.0001; Caucasian R2 = 0.14, p< 0.0001) were negatively associated with
disease duration in both cohorts (Fig. 3a–c). Normal-ized thalamic volume was also negatively associated with disease duration in both cohorts (Japanese R2= 0.33, p< 0.0001; Caucasian R2= 0.13, p< 0.0001; Fig. 3d). By contrast, NWMV was weakly and nega-tively correlated with disease duration in Caucasian patients (R2= 0.03, p= 0.03; Fig. 3e), but not Japanese patients (R2= 0.05,p= 0.16).
Finally, we used a test for homogeneity of slope to compare trends in the association of brain volume with disease duration among the Japanese and Caucasian pa-tients. Japanese patients had a significantly faster reduc-tion in NDGMV including normalized thalamic volume and normalized thalamic volume alone with disease dur-ation when compared with Caucasian patients (p= 0.001 for both). Japanese patients also had a marginally faster reduction in NBV with disease duration compared with Caucasian patients (p= 0.06). These findings suggest the potential for faster deep gray matter atrophy in Japanese MS patients. NBV, NDGMV, NWMV, and normalized thalamic volume were consistently smaller in Japanese patients compared with Caucasian patients throughout the entire examined disease duration (p= 0.046,p= 0.01, p= 0.005, and p= 0.04, respectively), suggesting an inherently smaller volume of deep gray matter, white matter, and the whole brain in Japanese MS patients. NCGMV was similar between the two racial groups in the early course of the disease, and did not differ significantly in terms of the reduction slope (p= 0.87 and p= 0.22, respectively).
To exclude the impact of outliers who had a disease duration of ≥10 years, we also evaluated the association
Table 2Comparison of baseline brain MRI features between Japanese and Caucasian patients with MS
Mean Median (IQR) Mean Median (IQR) p
Japanese patients (n= 93) Caucasian patients (n= 72)
Number of T2W-lesions 62 50 (27–96) 73 65 (24–108) 0.08
T2W-lesion volumes (cm3) 11.5 7.8 (2.3–16.9) 8.0 5.3 (2.4–12.2) 0.12
Each T2W-lesion volume (mm3) 174 140 (78–224) 118 85 (63–138) < 0.0001
Japanese patients (n= 83) Caucasian patients (n= 233)
NBV (cm3) 942.6 954.1 (903.9–980.2) 972.9 977.9 (940.4–1002.6) < 0.0001
Japanese patients (n= 45) Caucasian patients (n = 148)
NWMV (cm3) 467.4 466.1 (446.5–486.1) 486.9 487.7 (473.2–501.4) < 0.0001
Japanese patients (n= 52) Caucasian patients (n= 165)
NCGMV (cm3) 441.3 438.3 (418.6–473.1) 449.8 452.0 (429.9–471.7) 0.08
Japanese patients (n= 73) Caucasian patients (n= 207)
NDGMV (cm3) 37.0 36.7 (33.3–40.6) 40.8 41.4 (38.0–43.8) < 0.0001
Normalized thalamic volume (cm3) 17.2 17.3 (15.7–19.0) 18.8 18.9 (17.6–20.2) < 0.0001 Statistical comparisons were performed using linear regression with adjustments for age, sex, duration of disease from the first symptom, and exposure to previous MS treatment. We calculated the average T2W-lesion volume by dividing overall T2W-lesion volume by the number of T2W-lesions in individual patients IQRinterquartile range,MRIMagnetic resonance imaging,MSmultiple sclerosis,NBVnormalized brain volume,NCGMVnormalized cortical gray matter volume, NDGMVnormalized deep gray matter volume,NWMVnormalized white matter volume
of disease duration with brain volumes in MS patients with a disease duration of < 10 years. Even after excluding patients with a disease duration of≥10 years, NBV (JapaneseR2= 0.26,p< 0.0001; CaucasianR2= 0.13, p< 0.0001), NCGMV (JapaneseR2= 0.13,p= 0.02; Cauca-sian R2= 0.11, p= 0.0003), NDGMV (Japanese R2= 0.36, p< 0.0001; CaucasianR2= 0.04,p= 0.02), and normalized thalamic volume (Japanese R2= 0.41, p< 0.0001; Caucasian R2= 0.05, p= 0.01) were negatively associated with disease duration in both cohorts (Fig.4a–d). By con-trast, NWMV was not associated with disease duration in either cohort (Fig. 4e). A test of homogeneity of slopes showed significant differences in NBV (p= 0.02), NDGMV (p= 0.0002), and normalized thalamic volume (p< 0.0001) between the two groups. Thus, the exclusion of outli-ners with a disease duration of ≥10 years showed a stronger trend towards Japanese patients having a fas-ter reduction in NBV, NDGMV, and normalized thal-amic volume with disease duration than Caucasian patients.
Discussion
volume were significantly and consistently smaller in the Japanese cohort compared with Caucasian patients, while there were no differences in NCGMV. (5) The re-duction in NDGMV, including normalized thalamic vol-ume and normalized thalamic volvol-ume alone with disease duration, was faster in Japanese versus Caucasian pa-tients. (6) NWMV was significantly and negatively corre-lated with EDSS and disease duration in Caucasian patients, but not in Japanese patients.
The Japanese and Caucasian MS patients in our study cohort consisted mainly of patients in the relatively early stage of RRMS, as those with progressive MS and severe disability were excluded. Although the disease duration was similar, both EDSS scores and MSSS were signifi-cantly lower in Japanese versus Caucasian patients, con-sistent with a previous report [4]. The average age at onset and MRI examination was slightly lower in Japa-nese versus Caucasian patients, although the effects of onset age on disability progression speed remain contro-versial [20, 21]. Indeed, it is unlikely that such a subtle difference in age had a significant impact on differences in disability between the two racial groups. Prior use of DMDs and immunosuppressants was significantly higher in Japanese versus Caucasian patients in our study (56.8% vs. 28.5%, respectively) and in the aforementioned study
(83.2% vs. 17.0%, respectively) [4]. Given that DMDs and immunosuppressants have suppressive effects on relapse and new lesion formation, especially in early RRMS pa-tients, more frequent use of these drugs may explain the lower level of disability observed in Japanese patients. Given this consideration, we carefully interpreted our MRI findings in relation to disability.
In MS, T2W-lesions are attributable to a variety of pathological reactions, including inflammatory demye-lination, gliosis, edema, and axonal swelling and loss [22,
Japanese patients. In particular, early cerebellar involve-ment is a predictor for disability progression in MS, given the abundant connections between the cerebellum and many cerebral cortical areas [28]. Additionally, the parietal lobe was reported to be associated with both physical disability and cognitive decline in MS [29,30].
Genetic background may also influence the number of brain lesions in MS patients. We previously reported that MS patients with HLA-DRB1*04:05, one of the strongest and most common susceptibility alleles for MS in Japanese individuals, but which is rare in general European populations, showed decreased Barkhof cri-teria fulfillment and fewer intracortical lesions compared with those without DRB1*04:05 [10, 31, 32]. Thus, the relatively high proportion of DRB1*04:05 carriers in Jap-anese MS patients (approximately 30–40% in our previ-ous report [31]) may explain the lower number of brain MRI lesions and lower degree of disability in this popu-lation. However, as described, the wide use of DMDs during the early course of disease in Japanese MS pa-tients may also influence disability and lesion formation.
Surprisingly, Japanese patients had larger individual le-sion sizes compared with Caucasian patients. In Asian MS patients, tumefactive MS may be more frequent, with an occurrence of 6.3% versus 0.1–1.4% in Western MS patients [33–35]. The development of tumefactive demyelinating lesions is attributed to the failure of focal
immune-regulation against inflammatory insults that underlie MS lesion formation [36]. Although the mo-lecular mechanisms that produce larger demyelinating lesions are unclear, demyelinating lesions may tend to expand in Japanese patients once developed. Indeed, the significant positive correlation of T2W-lesion volumes with EDSS scores in Japanese patients suggests that acute inflammation leading to T2W-lesion formation may contribute to disability in this population, and that early introduction of DMDs may be of particular benefit. Interestingly, T2W-lesion volumes, but not NWMV, correlated with EDSS scores in Japanese patients. Con-versely, NWMV, but not T2W-lesion volumes, correlated with disability in Caucasian patients. This discrepancy may be based on the idea that white matter atrophy re-flects a degenerative process, but is partly independent of the genesis of T2W-lesions produced by acute inflamma-tion [24,37]. Acute inflammation leading to T2W-lesion formation is important in Japanese patients, while white matter degeneration may contribute to disability in Cauca-sian patients.
In patients from Western countries, brain atrophy is significantly correlated with overall disability as evalu-ated by EDSS and the Multiple Sclerosis Functional Composite scores [38,39]. In particular, gray matter at-rophy was the most significant MRI variable influencing disability in Western MS patients [40]. In agreement Fig. 4Relationship between disease duration and brain volumes in MS with a disease duration of < 10 years. Scatter plots show the relationship between disease duration and brain volumes (NBV, NCGMV, NDGMV, normalized thalamic volume, or NWMV;a–e) in Japanese (black dots) and Caucasian patients (gray dots). The solid lines represent the linear regression of the data. A test of homogeneity of slopes showed significant differences in NBV (p= 0.02), NDGMV (p= 0.0002), and normalized thalamic volume (p< 0.0001) between the two groups.R2= coefficient
with these observations, our study demonstrated that NBV was significantly correlated with EDSS scores, and that the correlations of NCGMV with EDSS scores, and of NDGMV with EDSS scores, were more significant than that of NWMV with EDSS scores. Additionally, normal-ized thalamic volume was significantly correlated with EDSS scores in both cohorts. Azevedo et al. reported that thalamic atrophy is an excellent marker for neurodegener-ation in MS [27]. Therefore, gray matter atrophy including thalamic atrophy appears to be critical for determining disability between racial groups, and NCGMV, NDGMV, and normalized thalamic volume may be excellent bio-markers for disease severity across race.
Unexpectedly, we found that Japanese patients had a lower NBV, NWMV, NDGMV, and normalized thalamic volume than Caucasian patients throughout the entire disease duration, despite milder disability. To our know-ledge, there are no studies that directly compare brain volume, including deep gray matter volume, between Caucasians and Japanese. However, Japanese MS patients may have an inherently smaller brain size, including the deep gray matter and white matter, after applying the normalization procedures. As white matter volume ac-counts for the largest proportion of whole brain volume, the initial or inherent difference in NWMV may largely explain the difference in NBV between the two groups. By contrast, the faster reduction in NDGMV and the normalized thalamic volume observed in Japanese versus Caucasian patients suggests that deep gray matter, espe-cially the thalamus, may be lost earlier in the disease process in Japanese patients. In a comparative study of African American and Caucasian patients with MS, thal-amic volume was significantly smaller in Caucasian pa-tients, although they had lower EDSS scores than African American patients [41]. Thus, while the speed of deep gray matter loss, especially thalamic volume loss, may vary between the racial groups, its influence on physical disability may be limited, at least in the early course of the disease. However, the influence of deep gray matter degradation on cognitive function should be carefully evaluated in long-term follow-up studies.
Our study has several limitations. First, as we com-pared T2W-lesions between racial subgroups extracted from the entire study population, the sample sizes be-came relatively small. However, as the clinical character-istics between the subgroups were essentially the same as those in the entire study population, we consider the selection bias to be minimal. Although 72 of the 167 Japanese participants in the phase II fingolimod clinical trial were excluded because of lack of informed consent and data unavailability, the clinical characteristics of 95 patients enrolled in the present study were similar to that reported for the whole cohort [15]. Thus, we con-sider that this selection bias did not severely distort our
data. Second, we could not compare the imaging mea-sures with age-matched healthy controls in each popula-tion, as the phase II fingolimod clinical trials did not include healthy controls. Given that brain atrophy is re-lated to normal aging processes [42] and the influence of genetic background on brain structure [43], a compari-son with healthy controls is necessary to adjust for racial background in future studies. Third, we applied the MNI152 standard template, based on data from 152 in-dividuals from Western countries, to normalize the mea-sures for head size in both racial groups. Although this template is the most widely used in research studies and clinical trials, bias and error may occur when applying it to Japanese populations. Finally, spinal cord data were not available in this study, as the phase II fingolimod clinical trials were not designed to include spinal cord MRI. As physical disability in MS also relates to spinal cord atrophy [44], we are now prospectively measuring spinal cord cross-sectional areas and whole brain paren-chymal volume in our cohort. This study will provide more information on the relationship of disability pro-gression with neuroimaging findings.
Conclusions
In conclusion, the cerebellum and parietal lobe are less frequently involved in Japanese MS patients compared with Caucasian patients, which may relate to milder levels of disability. Larger individual lesion sizes and a positive correlation of T2W-lesion volumes with EDSS scores in Japanese MS patients may relate to the greater role of inflammation in determining disability in Japanese than in Caucasian patients. However, brain vol-umes, especially gray matter volvol-umes, are negatively as-sociated with disease duration and disability in both Japanese and Caucasian patients, suggesting that gray matter atrophy is a common denominator for disability, and that it may be useful for evaluating disease progres-sion. Finally, the possibility that Japanese MS patients have faster deep gray matter volume loss over time com-pared with Caucasian MS patients warrants future longi-tudinal studies.
Abbreviations
DMDs:Disease-modifying drugs; EDSS: Expanded Disability Status Scale; MNI: Montreal Neurological Institute; MRI: Magnetic resonance imaging; MS: Multiple sclerosis; MSSS: Multiple Sclerosis Severity Score; NBV: Normalized brain volume; NCGMV: Normalized cortical gray matter volume; NDGMV: Normalized deep gray matter volume; NMO: Neuromyelitis optica; NWMV: Normalized white matter volume; RRMS: Relapsing-remitting MS; T1W: T1-weighted; T2W: T2-weighted
Acknowledgements
Funding
This study was supported in part by a Health and Labour Sciences Research Grant on Intractable Diseases (H29-Nanchitou (Nan)-Ippan-043) from the Ministry of Health, Labour, and Welfare, Japan, by the“Practical Research Project for Rare/Intractable Diseases”from the Japan Agency for Medical Research and Development, AMED, Japan, by a research grant from the Japanese Multiple Sclerosis Society, by a research grant from the Japan Intractable Disease Research Foundation, by‘Glial Assembly’Grants-in-Aid for Scientific Research on Innovative Areas (MEXT KAKENHI Grant Number 25117012) from the Ministry of Education, Culture, Sports, Science and Technology of Japan, by a Grant-in-Aid for Scientific Research (A) (JSPS KAKENHI Grant Number 16H02657), by a Grant-in-Aid for Scientific Research (C) (JSPS KAKENHI Grant Numbers 16 K09694), by a Grant-in-Aid for Scientific Research (C) (JSPS KAKENHI Grant Number 15 K09341), and by a Grant-in-Aid for Young Scientists (B) (JSPS KAKENHI Grant Number 17 K16125) from the Japan Society for the Promotion of Science, Japan. None of the funding bodies played any role in the study design, data collection and analysis, data interpretation, or writing of the manuscript.
Availability of data and materials
The datasets generated and/or analyzed during the present study are not publicly available because of the clinical trial contract, but are available from the corresponding author on reasonable request.
Authors’contributions
YN contributed to study concept and design, drafting the manuscript and figures, analysis and interpretation of data. LG contributed to study concept and design and analysis and interpretation of data. AA, LB, MA, KS, NI, and RY contributed to analysis and interpretation of data. JW, TSp, EWR, TSa, and LK contributed to study concept and design and interpretation of data. TM contributed to analysis and interpretation of data and drafting the manuscript. JK contributed to study concept and design, drafting the manuscript, analysis and interpretation of data, and study supervision. All authors read and approved the final manuscript.
Ethics approval and consent to participate
The study received ethical approval from the Kyushu University Hospital Ethics Committee (approval number 29–173), and written informed consent was obtained from all participants.
Consent for publication
Not applicable.
Competing interests
YN, AA, LB, and MA declare that they have no competing interests. LG reports personal fees from Novartis AG. TM received a grant and payment from Bayer Schering Pharma and Takeda Pharmaceutical Company for manuscript preparation and for development of educational presentations, and also received speaker honoraria payments from Mitsubishi Tanabe Pharma, Bayer Schering Pharma, and Biogen Idec Japan. Till S received previous and/or current payments for consulting, speaking activities (Actelion, Biogen Idec, Electrocore, Sanofi Genzyme, Mitsubishi Pharma, Teva, Novartis), and grants (EFIC-Grünenthal, Novartis Pharmaceuticals Switzerland, Swiss MS Society, Swiss National Research Foundation). EWR received speaker honoraria and travel compensation from Bayer Schering, Biogen, Fondazione Italiana Sclerosi Multipla, Genzyme, Novartis, Merck Serono, MorphoSys, and Synthon; consulted for Bayer Schering, Biogen Idec, Fondazione Italiana Sclerosi Multipla, Genzyme, Novartis, Merck Serono, Synthon, and MorphoSys; and received institutional research support from Novartis, Biogen Idec, Actelion, Basilea, SAKK, and Synarc. JW is CEO of MIAC AG. He served on scientific advisory board for Actelion, Genzyme, Novartis, Teva, and Roche; he received travel support and/or speaker honoraria from Bayer, Biogen, and Novartis; he received research support from the EU (Horizon2020), the German Ministry of Education and Research and the German Ministry of Economy. KS has received grants from the Japan Intractable Disease Research Foundation, Japanese Multiple Sclerosis Society, and the Japan Society for the Promotion of Science; and received personal fees from Takeda Pharmaceutical Company and Biogen Japan. NI has received grants and personal fees from Tanabe Mitsubishi Pharma, Bayer Yakuhin, Ltd., and Japan Blood Products Organization. RY has received grants from the Japan Society for the Promotion of Science, Bayer Schering Pharma,
Biogen Idec Japan, Novartis Pharma, and Mitsubishi Tanabe Pharma; and received research support from the Ministry of Education, Culture, Sports, Science and Technology of Japan and the Ministry of Health, Labour, and Welfare, Japan. Takahiko S has received funding from, held board membership of, spoken at scientific meetings for, prepared manuscripts for, and had consulting agreements with Astellas Pharma, Bayer Schering, Biogen Japan, Daiichi Sankyo, Eisai, Kaketsuken, Merck Serono, Mitsubishi Tanabe Pharma, Nihon Pharmaceutical, Novartis Pharma, Ono Pharmaceutical, Sanofi, TDS Japan, and Teijin. LK’s Institution (University Hospital Basel) received exclusive research support at the Department of Neurology, including steering committee, advisory board, and consultancy fees from Actelion, Alkermes, Almirall, Bayer, Biogen, df-mp, Excemed, GeNeuro SA, Genzyme, Merck, Mitsubishi Pharma, Novartis, Receptos, Roche, Sanofi-Aventis, Santhera, Teva, and Vianex, and royalties from Neurostatus products. For educational activities of the Department, the institution received honoraria from Allergan, Almirall, Bayer, Biogen, Excemed, Genzyme, Merck, Novartis, Pfizer, Sanofi-Aventis, Teva, and UCB. LK has served as principal investigator for the following drug studies: BOLD EXT, EXPAND (BAF312, Novartis), DECIDE, DECIDE EXT (Daclizumab HYP, Biogen), ENDORSE (BG00012, Biogen), FINGORETT, FTYUMBRELLA, INFORMS, INFORMS EXT LONGTERM (Fingolimod, Novartis), MOMENTUM (Amiselimod, Mitsubishi) OCRELIZUMAB PHASE II EXT, OPERA, ORATORIO (Ocrelizumab, Roche), REFLEXION (IFNβ-1a, Merck), STRATA EXT (Natalizumab, Biogen Idec), and TERIFLUNOMIDE EXT (Teriflunomide, Sanofi-Aventis). Research at the MS center in Basel was supported by grants from Bayer, Biogen, Novartis, the Swiss MS Society, the Swiss National Research Foundation, the European Union, and Roche Research Foundations. The institution has also received grants for patient services from Bayer, Merck, and Teva. JK has received grants from the Ministry of Health, Labour, and Welfare, Japan, the Ministry of Education, Culture, Sports, Science and Technology of Japan, the Japan Society for the Promotion of Science, the Japan Agency for Medical Research and Development, AMED, Japan; and received grants and personal fees from Biogen Idec Japan, Bayer Healthcare, Novartis Pharma, and Mitsubishi Tanabe Pharma, Eisai, Sanofi, Nobelpharma, Otsuka Pharmaceutical, Chugai Pharmaceutical Company, and Teijin Pharma. This independent academic research was supported by Novartis Pharma A.G., Novartis Pharma K.K., and Mitsubishi Tanabe Pharma Corporation, who provided baseline demographic data for the patients analyzed. Novartis and Mitsubishi Tanabe Pharma Corporation played no role in the design, methods, data management, or analysis of the study, or in the decision to publish.
Publisher’s Note
Springer Nature remains neutral with regard to jurisdictional claims in published maps and institutional affiliations.
Author details
1Department of Neurology, Neurological Institute, Graduate School of
Medical Sciences, Kyushu University, 3-1-1 Maidashi, Higashi-ku, Fukuoka 812-8582, Japan.2Medical Image Analysis Center (MIAC AG), Marktgasse 8,
4051 Basel, Switzerland.3Neurology and Department of Biomedicine,
University Hospital Basel, Spitalstrasse 21, 4031 Basel, Switzerland.
4
Department of Biomedical Engineering, University of Basel, Marktgasse 8, 4051 Basel, Switzerland.5DKD Helios Klinik Wiesbaden, Aukammallee 33,
65191 Wiesbaden, Germany.6Biomedical Research and Education GmbH,
Mittlere Strasse 91, 4031 Basel, Switzerland.7Klinikum rechts der Isar,
Department of Neurology, Technical University of Munich, Ismaninger Str. 22, 81675 Munich, Germany.8Division of Diagnostic and Interventional
Neuroradiology, Department of Radiology, University Hospital Basel, Spitalstrasse 21, 4031 Basel, Switzerland.9Department of Neurological
Therapeutics, Neurological Institute, Graduate School of Medical Sciences, Kyushu University, 3-1-1 Maidashi, Higashi-ku, Fukuoka 812-8582, Japan.
10Institute of Neurotherapeutics, 16-1 Nishinokyoukasugachou, Nakagyo-ku,
Kyoto 604-8453, Japan.11Department of Neurology, Kyoto Min-Iren-Central
Hospital, 16-1 Nishinokyoukasugachou, Nakagyo-ku, Kyoto 604-8453, Japan.
Received: 30 March 2018 Accepted: 28 August 2018
References
2. Cree BAC, Khan O, Bourdette D, Goodin DS, Cohen JA, Marrie RA, et al. Clinical characteristics of African Americans vs Caucasian Americans with multiple sclerosis. Neurology. 2004;63:2039–45.
3. Kister I, Chamot E, Bacon JH, Niewczyk PM, De Guzman RA, Apatoff B, et al. Rapid disease course in African Americans with multiple sclerosis. Neurology. 2010;75:217–23.
4. Piccolo L, Kumar G, Nakashima I, Misu T, Kong Y, Wakerley B, et al. Multiple sclerosis in Japan appears to be a milder disease compared to the UK. J Neurol. 2015;262:831–6.
5. Barkhof F, Filippi M, Miller DH, Scheltens P, Campi A, Polman CH, et al. Comparison of MRI criteria at first presentation to predict conversion to clinically definite multiple sclerosis. Brain. 1997;120:2059–69.
6. Ishizu T, Kira J, Osoegawa M, Fukazawa T, Kikuchi S, Fujihara K, et al. Heterogeneity and continuum of multiple sclerosis phenotypes in Japanese according to the results of the fourth nationwide survey. J Neurol Sci. 2009; 280:22–8.
7. Gieß RM, Pfuhl C, Behrens JR, Rasche L, Freitag E, Khalighy N, et al. Epstein-Barr virus antibodies in serum and DNA load in saliva are not associated with radiological or clinical disease activity in patients with early multiple sclerosis. PLoS One. 2017;12:e0175279.
8. Barkhof F, Rocca M, Francis G, Van Waesberghe J-HTM, Uitdehaag BMJ, Hommes OR, et al. Validation of diagnostic magnetic resonance imaging criteria for multiple sclerosis and response to interferon beta1a. Ann Neurol. 2003;53:718–24.
9. Nakashima I, Fujihara K, Okita N, Takase S, Itoyama Y. Clinical and MRI study of brain stem and cerebellar involvement in Japanese patients with multiple sclerosis. J Neurol Neurosurg Psychiatry. 1999;67:153–7.
10. Shinoda K, Matsushita T, Nakamura Y, Masaki K, Yamasaki R, Yamaguchi H, et al. HLA-DRB1*04:05 allele is associated with intracortical lesions on three-dimensional double inversion recovery images in Japanese patients with multiple sclerosis. Mult Scler. 2018;24:710–20.
11. Polman CH, Reingold SC, Banwell B, Clanet M, Cohen JA, Filippi M, et al. Diagnostic criteria for multiple sclerosis: 2010 revisions to the McDonald criteria. Ann Neurol. 2011;69:292–302.https://doi.org/10.1002/ana.22366. 12. Swanton JK, Fernando K, Dalton CM, Miszkiel KA, Thompson AJ, Plant GT, et
al. Modification of MRI criteria for multiple sclerosis in patients with clinically isolated syndromes. J Neurol Neurosurg Psychiatry. 2006;77: 830–3.
13. Lo CC, Kao HH, Chen SS, Hsueh CC, Lin WW, Hsu WW, et al. Prediction of conversion from clinically isolated syndrome to clinically definite multiple sclerosis according to baseline MRI findings: comparison of revised McDonald criteria and Swanton modified criteria. J Neurol Neurosurg Psychiatry. 2009;80:1107–9.
14. Kappos L, Antel J, Comi G, Montalban X, O’Connor P, Polman CH, et al. Oral fingolimod (FTY720) for relapsing multiple sclerosis. N Engl J Med. 2006; 355:1124–40.
15. Saida T, Kikuchi S, Itoyama Y, Hao Q, Kurosawa T, Nagato K, et al. A randomized, controlled trial of fingolimod (FTY720) in Japanese patients with multiple sclerosis. Mult Scler. 2012;18:1269–77.
16. Kurtzke JF. Rating neurologic impairment in multiple sclerosis: an expanded disability status scale (EDSS). Neurology. 1983;33:1444–52.
17. Smith SM. Fast robust automated brain extraction. Hum Brain Mapp. 2002; 17:143–55.
18. Smith SM, Zhang Y, Jenkinson M, Chen J, Matthews PM, Federico A, et al. Accurate, robust, and automated longitudinal and cross-sectional brain change analysis. NeuroImage. 2002;17:479–89.
19. Patenaude B, Smith SM, Kennedy DN, Jenkinson M. A Bayesian model of shape and appearance for subcortical brain segmentation. NeuroImage. 2011;56:907–22.
20. Confavreux C, Vukusic S. Age at disability milestones in multiple sclerosis. Brain. 2006;129:595–605.
21. Scalfari A, Neuhaus A, Daumer M, Ebers GC, Muraro PA. Age and disability accumulation in multiple sclerosis. Neurology. 2011;77:1246–52. 22. Moore GRW, Leung E, MacKay AL, Vavasour IM, Whittall KP, Cover KS, et al.
A pathology-MRI study of the short-T2 component in formalin-fixed multiple sclerosis brain. Neurology. 2000;55:1506–10.
23. Fisher E, Chang A, Fox RJ, Tkach JA, Svarovsky T, Nakamura K, et al. Imaging correlates of axonal swelling in chronic multiple sclerosis brains. Ann Neurol. 2007;62:219–28.
24. Bermel RA, Bakshi R. The measurement and clinical relevance of brain atrophy in multiple sclerosis. Lancet Neurol. 2006;5:158–70.
25. Li DK, Held U, Petkau J, Daumer M, Barkhof F, Fazekas F, et al. MRI T2 lesion burden in multiple sclerosis: a plateauing relationship with clinical disability. Neurology. 2006;66:1384–9.
26. Fisniku LK, Brex PAP, Altmann DRDR, Miszkiel KA, Benton CEC, Lanyon R, et al. Disability and T2 MRI lesions: a 20-year follow-up of patients with relapse onset of multiple sclerosis. Brain. 2008;131:808–17.
27. Azevedo CJ, Cen SY, Khadka S, Liu S, Kornak J, Shi Y, et al. Thalamic atrophy in multiple sclerosis: a magnetic resonance imaging marker of
neurodegeneration throughout disease. Ann Neurol. 2018;83:223–34. 28. Bergamaschi R. Prognosis of multiple sclerosis: clinical factors predicting the
late evolution for an early treatment decision. Expert Rev Neurother. 2006;6:357–64.
29. Hackmack K, Weygandt M, Wuerfel J, Pfueller CF, Bellmann-Strobl J, Paul F, et al. Can we overcome the“clinico-radiological paradox”in multiple sclerosis? J Neurol. 2012;259:2151–60.
30. van Munster CE, Jonkman LE, Weinstein HC, Uitdehaag BM, Geurts JJ. Gray matter damage in multiple sclerosis: impact on clinical symptoms. Neuroscience. 2015;303:446–61.
31. Nakamura Y, Matsushita T, Sato S, Niino M, Fukazawa T, Yoshimura S, et al. Latitude and HLA-DRB1*04:05 independently influence disease severity in Japanese multiple sclerosis: a cross-sectional study. J Neuroinflammation. 2016;13:239.
32. Yoshimura S, Isobe N, Yonekawa T, Matsushita T, Masaki K, Sato S, et al. Genetic and infectious profiles of Japanese multiple sclerosis patients. PLoS One. 2012;7:e48592.
33. Kuan Y-C, Wang K-C, Yuan W-H, Tsai C-P. Tumefactive multiple sclerosis in Taiwan. PLoS One. 2013;8:e69919.
34. Poser S, Lüer W, Bruhn H, Frahm J, Brück Y, Felgenhauer K. Acute demyelinating disease. Classification and non-invasive diagnosis Acta Neurol. Scandinavica 1992;86:579–585.
35. Sánchez P, Meca-Lallana V, Barbosa A, Manzanares R, Palmí I, Vivancos J. Tumefactive demyelinating lesions of 15 patients: clinico-radiological features, management and review of the literature. J Neurol Sci. 2017;381:32–8. 36. Hardy TA, Tobin WO, Lucchinetti CF. Exploring the overlap between
multiple sclerosis, tumefactive demyelination and Baló’s concentric sclerosis. Mult Scler J. 2016;22:986–92.
37. Grassiot B, Desgranges B, Eustache F, Defer G. Quantification and clinical relevance of brain atrophy in multiple sclerosis: a review. J Neurol. 2009;256:1397–412.
38. Fisher E, Rudick RA, Simon JH, Cutter G, Baier M, Lee J-C, et al. Eight-year follow-up study of brain atrophy in patients with MS. Neurology. 2002; 59:1412–20.
39. Maghzi AH, Revirajan N, Julian LJ, Spain R, Mowry EM, Liu S, et al. Magnetic resonance imaging correlates of clinical outcomes in early multiple sclerosis. Mult Scler Relat Disord. 2014;3:720–7.
40. Tedeschi G, Lavorgna L, Russo P, Prinster A, Dinacci D, Savettieri G, et al. Brain atrophy and lesion load in a large population of patients with multiple sclerosis. Neurology. 2005;65:280–5.
41. Al-Kawaz M, Monohan E, Morris E, Perumal JS, Nealon N, Vartanian T, et al. Differential impact of multiple sclerosis on cortical and deep gray matter structures in African Americans and Caucasian Americans. J Neuroimaging. 2017;27:333–8.
42. Giorgio A, Santelli L, Tomassini V, Bosnell R, Smith S, De Stefano N, et al. Age-related changes in grey and white matter structure throughout adulthood. NeuroImage. 2010;51:943–51.
43. Eyler LT, Prom-Wormley E, Panizzon MS, Kaup AR, Fennema-Notestine C, Neale MC, et al. Genetic and environmental contributions to regional cortical surface area in humans: a magnetic resonance imaging twin study. Cereb Cortex. 2011;21:2313–21.