RESEARCH
Transcriptome and key genes expression
related to carbon fixation pathways in
Chlorella
PY-ZU1 cells and their growth under high
concentrations of CO
2
Yun Huang
1,2, Jun Cheng
1*, Hongxiang Lu
1, Yong He
1, Junhu Zhou
1and Kefa Cen
1Abstract
Background: The biomass yield of Chlorella PY-ZU1 drastically increased when cultivated under high CO2 condition compared with that cultivated under air condition. However, less attention has been given to the microalgae photo-synthetic mechanisms response to different CO2 concentrations. The genetic reasons for the higher growth rate, CO2 fixation rate, and photosynthetic efficiency of microalgal cells under higher CO2 concentration have not been clearly defined yet.
Results: In this study, the Illumina sequencing and de novo transcriptome assembly of Chlorella PY-ZU1 cells cultivated under 15% CO2 were performed and compared with those of cells grown under air. It was found that
carbonic anhydrase (CAs, enzyme for interconversion of bicarbonate to CO2) dramatically decreased to near 0 in 15%
CO2-grown cells, which indicated that CO2 molecules directly permeated into cells under high CO2 stress without
CO2-concentrating mechanism. Extrapolating from the growth conditions and quantitative Real-Time PCR of
CCM-related genes, the Km (CO2) (the minimum intracellular CO2 concentration that rubisco required) of Chlorella PY-ZU1
might be in the range of 80–192 μM. More adenosine triphosphates was saved for carbon fixation-related pathways. The transcript abundance of rubisco (the most important enzyme of CO2 fixation reaction) was 16.3 times higher in
15% CO2-grown cells than that under air. Besides, the transcript abundances of most key genes involved in carbon
fixation pathways were also enhanced in 15% CO2-grown cells.
Conclusions: Carbon fixation and nitrogen metabolism are the two most important metabolisms in the photo-synthetic cells. These genes related to the two most metabolisms with significantly differential expressions were beneficial for microalgal growth (2.85 g L−1) under 15% CO
2 concentration. Considering the micro and macro growth
phenomena of Chlorella PY-ZU1 under different concentrations of CO2 (0.04–60%), CO2 transport pathways responses to different CO2 (0.04–60%) concentrations was reconstructed.
Keywords: CO2 fixation pathway, Genes transcript sequences, 15% CO2 concentration, Carbonic anhydrase, Rubisco
© The Author(s) 2017. This article is distributed under the terms of the Creative Commons Attribution 4.0 International License (http://creativecommons.org/licenses/by/4.0/), which permits unrestricted use, distribution, and reproduction in any medium, provided you give appropriate credit to the original author(s) and the source, provide a link to the Creative Commons license, and indicate if changes were made. The Creative Commons Public Domain Dedication waiver (http://creativecommons.org/ publicdomain/zero/1.0/) applies to the data made available in this article, unless otherwise stated.
Background
Global warming necessitates the reduction of accumu-lated CO2 in the atmosphere. Utilizing biological
conver-sions by microalgae is a promising approach to reduce CO2 emissions [1, 2]. However, the current atmospheric
CO2 concentration of ~0.04% is not enough for
micro-algae photosynthesis [3]. Moreover, the photosynthetic mechanism ribulose-1,5-bisphosphate carboxylase/oxyge-nase (rubisco), the first and stromal enzyme that catalyzes the entry of CO2 into the Calvin–Benson cycle, is adapted
to the considerably higher CO2 concentrations
encoun-tered by C3 plants [4]. The Km for CO2 of microalgal
rubisco, often exceed 25 μM [5]. However, the dissolved CO2 in freshwater is only ~15 μM when in equilibrium
Open Access
*Correspondence: [email protected]
1 State Key Laboratory of Clean Energy Utilization, Zhejiang University,
Hangzhou 310027, China
with air. However, rubisco has a poor apparent affinity with CO2 when the dissolved CO2 concentration is less
than the Km (CO2) of rubisco, led to decrease in
photo-synthetic efficiency [6, 7]. To overcome this challenge, a number of prokaryotic and eukaryotic microalgae have developed a CO2-concentrating mechanism (CCM) to
maximize photosynthesis under limited CO2 conditions
[8]. Given that CO2 is the only form of dissolved inorganic
carbon that rubisco can fix, the most likely evolutionary goal of the CCM process is to increase dissolved CO2
con-centrations at rubisco locations for fixation [9].
A number of studies have been conducted on the mechanisms underlying the acclimation of microalgal cells to limited CO2 concentrations [7, 8, 10]. Carbonic
anhydrase (CAs) and CCM play an important role in the efficient utilization of dissolved inorganic carbon under CO2-limited conditions. However, CCM requires more
energy flow in PSI and leaves less energy available for the Calvin–Benson cycle, thus reducing microalgal growth and CO2 fixation efficiency [11]. Therefore, several
stud-ies have focused on CO2 fixation by microalgae from high
concentrations of CO2 gas, such as flue gas, to increase
CO2 fixation efficiency [12]. In our previous study, the
biomass yield (2.78 g L−1) of Chlorella PY-ZU1
culti-vated under 15% CO2 increased by 1.19-fold compared
with that of microalgae cultivated under air (1.30 g L−1)
[13]. However, less attention has been given to the pho-tosynthetic mechanisms of microalgal response to differ-ent CO2 concentrations. And, the genetic reasons for the
higher growth rate, CO2 fixation rate, and photosynthetic
efficiency of domesticated microalgae cells under higher CO2 concentration remain unclear.
Nevertheless, CCM models have clearly shown that CCM will work when microalgae cells are exposed to lim-ited CO2 conditions [14]. There is still a lack of research
on the exact conditions, including CO2 conditions and Km
(CO2), and under which condition CCM would switch on.
Moreover, the relationship between the diversity and evo-lutionary pathways of key carbon fixation-related genes and photosynthetic performance is still unknown because of their dependency on microalgae species [15]. There-fore, in the present study, we analyzed the transcriptome and gene expression of Chlorella PY-ZU1 cells cultivated under different CO2 concentrations and reconstructed the
CO2 transport pathways into Chlorella PY-ZU1 responses
to different CO2 concentrations. The growth conditions of Chlorella PY-ZU1 and DIC in the medium were also meas-ured to extrapolate the value of Km (CO2).
Methods
Strains and media
This strain used in the present study was Chlorella
PY-ZU1, a highly CO2-tolerant and fast-growing
microalgal species that obtained from Chlorella pyre-noidosa after γ irradiation and high CO2 domestication
[6]. The cells were maintained and cultivated in Brostol’s solution (also known as soil extract, SE) [1, 6].
Analysis of differentially expressed Chlorella PY‑ZU1 genes under continuous aeration with 15% CO2 and air
Chlorella PY-ZU1 strains were cultivated in SE medium under 15% CO2 or air. Cells in the logarithmic phase
(after cultivated 36 h) were collected by centrifugation for DNA extraction. The gene for full-length 18s rDNA was amplified to obtain the algal genome according to the protocol performed in Cheng’s study [16]. The fol-lowing primers were utilized to amplify 18s rDNA: 18s-F, AACCTGGTTGATCCTGCCAGT and 18s-R, TGATC-CTTCTGCAGGTTCACCT. The gene was inserted into the cloning vector, pMD19-T. Positive results were selected for sequencing. Total RNA was extracted by TRIzol reagent (Invitrogen) for cDNA library construc-tion and Illumina sequencing. mRNA was separated by magnetic sand method, cleaved to synthesize double-stranded cDNA, and filled to plane. Poly (A) was added at the 3ʹ terminal end, and index connection was linked using TruSeq™ RNA Sample Preparation Kit. The tar-get strip was enriched using polymerase chain reaction (PCR; 15 cycles) and recycled by 2% agarose gel. Quan-titative determination was performed by TBS380 (Pico-green). Bridge amplification was conducted to generate cBot clusters. The 2*100 bp sequencing test was per-formed by HiSeq 2000 sequencing platform. Sequence assembly and annotation were similar to those performed in Cheng’s study [16].
Gene expression statistics and differential expression analysis
Total RNA extracted from algae grown in normal medium (under Air) and high-CO2 medium [15% (v/v)
CO2] was used to prepare gene expression libraries using
the Illumina Gene Expression Sample Prep Kit and then subjected to Illumina sequencing. The RNA-Seq reads were mapped to our transcriptome reference database, and transcript abundances were quantified by RSEM (http://deweylab.biostat.wisc.edu/rsem/). Genes with differential expression between these two samples were identified using the numbers of mapped reads as EdgeR inputs (http://www.bioconductor.org/packages/release/ bioc/html/edgeR.html). Genes were defined as differ-entially expressed if they exhibited a 2-fold or greater change between the air and high-CO2 samples and a
false discovery rate (FDR) of 5% or less. Differentially expressed genes were regarded as up-regulated if their expression levels in high-CO2 samples were significantly
showed lower expression levels in the high-CO2 samples
were regarded as down-regulated. Gene set enrichment analyses were performed using goatools (https://github. com/tanghaibao/goatools) and KOBAS (http://kobas.cbi. pku.edu.cn/home.do).
Quantitative real‑time PCR (qRT‑PCR) validation
To investigate the developmental expression patterns of rubisco, CAs, and nitrate reductase, samples of micro-algae cells cultivated for different durations under 15% CO2 or air were collected. Real-time reverse transcript
polymerase chain reaction (real-time PCR, RT-PCR) was conducted with gene-specific primers pairs designed by PRIMER PREMIER5 software. The sequences of the specific primer sets are listed in Table 1. Total RNAwas extracted. qRT-PCR was performed with 20-μL reac-tion volumes containing 2 μL of 10-fold diluted cDNAs, 1 μM of each primer, and 10 μL SYBR Green Premix Ex Taq by the Bio-Rad Real-time PCR system (Bio-Rad, Her-cules, CA, USA). The housekeeping gene for 18S ribo-some DNA was used as a control. The 18 rDNA gene primers were as follows: algae sense 5′ -ACGGCTACCA-CATCCAAG-3′ and antisense 5′ -CCACCCGAAATC-CAACTA-3′. The optimized qPCR program consisted of an initial denaturation step at 95 °C for 30 s, followed by 40 cycles at 95 °C for 5 s, and 60 °C for 30 s. qPCR was repeated thrice per gene. Each replication was performed with an independently prepared RNA sample and con-sisted of three technical replicates . A relative quantita-tive method (ΔΔCt) was used to evaluate the quantitaquantita-tive variation [17].
Cultivation of microalgae under continuous aeration with different concentrations of CO2
All Chlorella PY-ZU1 cultivation experiments were performed in an artificial greenhouse at 27 °C. Initial biomass concentration was maintained at 0.2 g L−1.
Microalgae were cultivated in the cylindrical photoreac-tors (BR) (160 × Ф56 mm; 300-mL working volume) with the optimized SE medium (SE* medium). SE* medium contained 1 g of NaNO3, 0.15 g of K2HPO4·3H2O, 0.15 g
of MgSO4·7H2O, 0.025 g of CaCl2·2H2O, 0.025 g of NaCl,
40 mL of soil extract, 0.005 g of FeCl3·6H2O, 1 mL of
Fe-EDTA, and 1 mL of A5 solution in 958 mL of deion-ized water [1]. Enriched CO2 gas [from 384 ppm to
60% (v/v)] was bubbled into the BR via a pipe at a rate of 30 mL min−1. Initial pH was adjusted to 6.5 by using
0.1 M HCl and 0.1 M NaOH. During incubation, light intensity of 6000 Lux was applied on the surface of the BR with four cool white lights and two plant lights (TLD 36 W; Philips) fixed above the BR.
To obtain the dry biomass during cultivation, 10-mL samples were dewatered by centrifugation (Beckman Avanti J26-XP, USA) at 8500 rpm for 10 min and dried at 70 °C for 24 h. Biomass yield (g L−1) was calculated
from the microalgae dry weight produced per liter. Chlorophyll was extracted by macerating microalgae in DMSO/80% acetone (1/2, V/V) and then measured [18]. NO3− concentrations were analyzed by ion
chromatog-raphy (MagIC, Metrohm, Switzerland). All experiments were performed in duplicate, and all data showed were reported as mean values and standard deviations (in fig-ures) or standard errors (in tables) in this study.
Calculation of dissolved CO2 concentration
Dissolved inorganic carbon (DIC) and CO2 in the culture
were calculated according to the CO2 dissolved process
[17] as follows:
During cultivation, the culture pH was 5.5–7.0, thus,
The influent and effluent CO2 concentrations
were monitored online by a CO2 analyzer
(Ser-vomex4100, UK). At a constant temperature of 27 °C,
KH = 3.2 × 10⁻² M atm−1 and Ka1 = 4.3 × 10⁻⁷ M [19].
[H+] = 10−pH, PCO
2 =mean
PCO
2input,PCO2output
.
Reconstruction of inorganic carbon transport pathways
The microstructure of Chlorella PY-ZU1 was also meas-ured by TEM in our previous study [20]. An apparent protein body (pyrenoid) was found inside the chloroplast
CO2(g)+H2O↔H2CO3(g) KH= [H2
CO3]
PCO2
H2CO3(g)↔H++HCO−3(g) Ka1=
[H+][HCO−3]
[H2CO3]
.
[DIC] = [H2CO3] + [HCO−3] =KH×PCO2×
1+Ka1
H+
(1) [CO2] =KH×PCO2.
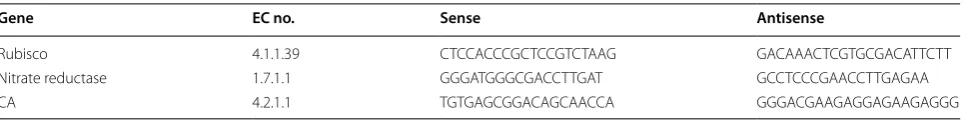
Table 1 Sequences of specific primers used for real-time PCR
Gene EC no. Sense Antisense
Rubisco 4.1.1.39 CTCCACCCGCTCCGTCTAAG GACAAACTCGTGCGACATTCTT
Nitrate reductase 1.7.1.1 GGGATGGGCGACCTTGAT GCCTCCCGAACCTTGAGAA
in Chlorella PY-ZU1 from the image. The microstructure of Chlorella PY-ZU1 used in this work were compared with that of the green microalgae Chlorophyta, one spe-cies with the same genus of Chlorella PY-ZU1. In the Chlorophyta a pyrenoid is localized inside the chloro-plast, starch often is accumulated around the pyrenoid and the presence of concentric thylakoid systems is vis-ible around this starch sheath [21]. CCM goes on the pyr-enoid model, and CA is in the pyrpyr-enoid that localized in chloroplast [22]. CCM goes on passive diffusion of CO2
through the plasmalemma and active bicarbonate trans-port into the chloroplast [8, 21]. Inorganic carbon trans-port pathways reconstructed based on de novo assembly and annotation of Chlorella PY-ZU1. The genes involved in these pathways in Chlorella PY-ZU1 were condensed and simplified according to their transcript abundances.
Results
Gene expression of carbonic anhydrase and rubisco under high CO2 stress
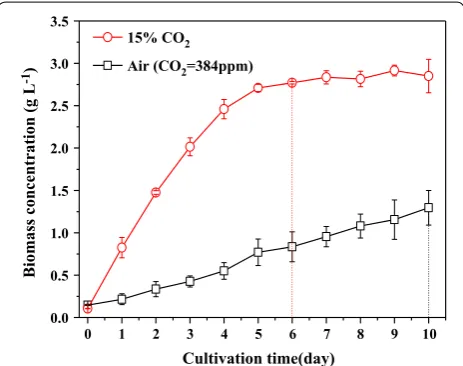
Chlorella PY-ZU1 had a higher biomass yield (2.85 g L−1)
and shorter growth cycle (7 days) when cultivated in SE medium under continuous aeration with 15% (v/v) CO2
gas. This CO2 concentration is equivalent to that of flue
gas from most coal-fired power plants. By contrast, the biomass concentration of Chlorella PY-ZU1 was only 1.30 g L−1 after 10 days of cultivation under air. It was
previously reported that high CO2 induced algae growth
[23]. Carbon fixation and nitrogen metabolism are the two most important aspects of primary cell metabolism. Therefore, we expected to observe significant differences in the expression of genes encoding enzymes of carbon fixation and nitrogen metabolism.
When aerated into the microalgal suspension, CO2
first dissolves in the medium, and then transfers from the extracellular culture medium through the cell mem-brane to the intracellular chloroplast. Then, CO2 is
con-verted by ribulose-1,5-bisphosphate (RuBP) upon the catalysis of RuBP carboxylase (rubisco) to 3-phospho-glycerate (PGA), the precursor of structural materi-als in microalgal cells [24]. Rubisco (rbcS, EC4.1.1.39), the first enzyme of the Calvin cycle, fixes CO2 into the
three carbon atoms of RuBP (CO2+C5Rubisco−→ 2C3).
The transcript abundance of RuBP increased slightly from 11,043.90 to 11,478.37 under high CO2 (15% CO2),
whereas it was highly expressed under both high (15% CO2) and low (air) CO2 (Fig. 2). A 2-fold increase in
transcript abundance was observed for PGK (EC2.7.2.3), which catalyzes the phosphorylation of 3-PGA to 1,3-bis-phosphoglycerate. Moreover, triose phosphate isomer-ase (tpiA, EC5.3.1.1), which reversibly converts GAP into dihydroxyacetone phosphate (DHAP), increased by approximately 10.4-fold. The transcript abundance of a
series of enzymes that converts GAP to sedoheptulose-7-phosphate (S7P), such as fructose-1,6-bisphosphatase aldolase (fbaB, EC4.1.2.13), increased more than 2-fold, whereas those of transketolase (tkt, EC2.2.1.1) and sedoheptulose-1,7-bisphosphatase (SBPase, EC3.1.3.37) improved slightly. Ribose-5-phosphate isomerase (rpiA, EC5.3.1.6), which converts R5P into ribulose-5-phos-phate (Ru5P), increased by 7.8-fold. Phosphoribuloki-nase (prkB, EC2.7.1.19), which phosphorylates Ru5P into RuBP, increased by 4.0-fold. Therefore, almost all of the enzymes involved in the Calvin cycle had increased tran-script abundances (Additional file 1) under high CO2.
The results indicated that the whole carbon fixation pro-cess was driven by 15% CO2 gas. Therefore, the growth
rate of Chlorella PY-ZU1 increased under 15% CO2
com-pared with under air (Fig. 1).
Moreover, rubisco was still highly expressed even Chlo-rella PY-ZU1 was cultivated under limited CO2, such as
air. The high expression of rubisco was caused by CCM in microalgae cells. Rubisco is only activated when CO2
concentration is greater than its Km (CO2), because that
CO2 is the only carbon source that rubisco can utilize.
However, when aerated with air, 99% of carbon in the culture is in the form of HCO3− [1]. CO2
concentra-tion in the medium hardly meets the requirements of rubisco because of the low solubility of CO2. Gene
tran-script abundance of CAs in Chlorella PY-ZU1 pyrenoids increased to 5190 from 39 under cultivation with 15% CO2. CAs expression increased to maintain high CO2
concentration in pyrenoids. Furthermore, CCM was simultaneously activated as most of the dissolved inor-ganic carbon, HCO3−, was transferred by pump through
the chloroplast membrane into the internal pyrenoid; HCO3 was then converted by CAs to CO2 as function (2)
0 1 2 3 4 5 6 7 8 9 10 0.0
0.5 1.0 1.5 2.0 2.5 3.0 3.5
15% CO2 Air (CO2=384ppm)
Biomass concentration (g
L
-1)
Cultivation time(day)
in the chloroplast to meet the needs of rubisco (Fig. 2) [25]. However, CCM occurred at the cost of ATP. Increased CCM expression consumed more energy for CO2 transfer, thus decreasing the energy available for
carbon fixation and other pathways of photosynthetic growth. Conversely, when cultivated under continu-ous aeration with 15% CO2, CAs was barely expressed
in Chlorella PY-ZU1 pyrenoids. CCM was inactive. The CO2 that diffused directly into pyrenoids by high CO2
osmotic pressure was sufficient for rubisco. Therefore CO2 transfer pathway was simplified. Hence, more ATP
was available for photosynthesis to promote growth.
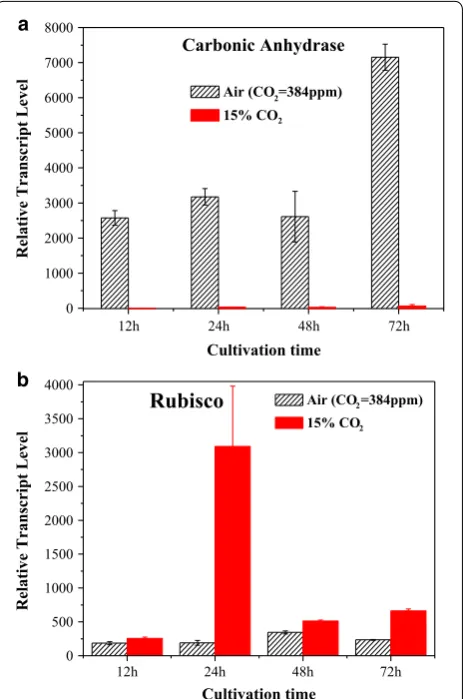
CAs and rubisco are the most important genes of car-bon fixation pathways. To confirm the transcriptome results, the expression levels of genes encoding CA and rubisco were measured by qRT-PCR under different cul-tivation times (Fig. 3a). Under high CO2, the CAs
tran-script level was significantly reduced to 0 (The original data showed in Additional file 2), which is consistent with the transcriptome results (Fig. 2). Moreover, the study conducted by Fan et al. reported a similar, remarkably decreased CAs expression when oleaginous Chlorella
cells were exposed to 5% CO2 [26]. This result is also
consistent with previous reports that CO2 concentration
significantly affects CAs activity in Chlorella pyrenoidosa
cells, and that elevating CO2 concentration decreases
CAs activity [27].
Rubisco expression levels increased under high CO2
(Fig. 3b). This result is consistent with the transcriptome results. Under 15% CO2, the enhanced rubisco
expres-sion of Chlorella PY-ZU1 cells might induce more CO2
to directly permeate intracellular pyrenoids for conver-sion into cellular energy storage molecules and to pro-mote ATP conversion to glucose, thereby improving
(2)
HCO−3 +H+Carbonic anhydrase−→ CO2+H2O
the photosynthetic efficiency of microalgae. Therefore, high CO2 concentrations reduced the ATP
consump-tion of CO2 transfer. On the other hand, high CO2
Fig. 2 Genes transcript abundance of reconstructed carbon fixation pathway in Chlorella PY-ZU1 cells cultivated with 15% CO2 gas versus air. Black dotted box indicated CO2 transfer process (CO2 concentrating mechanism), and red dotted box indicated Calvin cycle. Key enzymes of Calvin cycle are shown in boxes as enzyme commission (EC) numbers. Red box indicated an up-regulation, and black box indicated no significant changes
12h 24h 48h 72h
0 1000 2000 3000 4000 5000 6000 7000 8000
Cultivation time
Relative Transcript Leve
l
Air (CO =384ppm)2 15% CO2
a
Carbonic Anhydrase
12h 24h 48h 72h
0 500 1000 1500 2000 2500 3000 3500 4000
Rubisco
Cultivation time
Relative Transcript Leve
l
b
Air (CO =384ppm)2 15% CO2
concentrations improved CO2 conversion and
photo-synthetic efficiency, thus eventually reducing the growth cycle and increasing the biomass yield (2.85 g L−1) of Chlorella PY-ZU1.
In addition, the time when rubisco had highest tran-scriptional level (24 h of high CO2 and 48 h of air) and
the time CAs had lowest transcriptional level under air (48 h) were also the time when maximum microalgae growth rate was achieved (24 h of high CO2 and 48 h of
air) (Fig. 1). That fully illustrated that CAs and rubisco had the ability to regulate microalgae growth.
Response of nitrogen metabolism and chlorophyll synthesis to high CO2 stress
Similar to carbon fixation, the transcript abundance of important enzymes in nitrogen metabolism, including those of nitrate reductase, nitrite reductase and gluta-mate dehydrogenase (ghdA), also increased under high CO2 (Fig. 4a). Nitrogen is an essential element for
chlo-rophyll and protein synthesis. After nitrate reductase and nitrite reductase increased, nitrate ions absorbed by microalgae were immediately catalyzed to nitrite ions and then to ammonia through a series of reduction reactions to synthesize nitrogenous compounds, such as amino acids, which in turn increased the efficiency of nitrate ion uptake from the medium by microalgae cells. On the aspect of nitrogen source consumption (in this study, the nitrogen source was sodium nitrate), Chlorella PY-ZU1 consumed almost all of the 3 mM nitrate during the first 2 days, especially on the first day (Fig. 4b) when cultivated under continuous aeration with 15% CO2. By contrast, Chlorella PY-ZU1 only consumed 1.26 mM nitrate during the first 2 days, and nitrate was not completely consumed until the sixth day when cultivated under air. On the genetic level, the transcript abundance of nitrate reduc-tase, the first enzyme in nitrogen metabolism, increased by approximately 10-fold by the 24th h and 8-fold by the 48th h under high CO2 compared with that under
air (Fig. 4c). The higher transcript expression of nitrate reductase accelerated the transformation of nitrate to nitrite and O2 catalyzed by nitrate reductase (Function 3).
This higher gene expression might manifest by the rapid consumption of nitrate. Furthermore, by the catalysis of the up-regulated nitrite reductase, more nitrite was con-verted to amino acid synthesis precursors, such as ammo-nia (Function 4), thereby accelerating the synthesis of proteinaceous materials, such as chlorophyll (Fig. 4d).
Under 15% (v/v) CO2, 23.65 mg L−1 of chlorophyll
was produced during the first day of cultivation. Chlo-rophyll concentration remained stable in the range of 23–26 mg L−1. All of the 3 mM nitrate in the medium was
consumed during the following 3 days (Fig. 4d). Chloro-phyll was vital in photosynthesis and allowed Chlorella
PY-ZU1 cells to absorb energy from light. Moreover, light conversion efficiency is linearly correlated with chlorophyll content [1, 28]. Increased chlorophyll pro-vided more energy for photosynthetic reactions, thereby improving the photosynthetic growth rate of Chlorella
PY-ZU1. However, the high nitrogen consumption dur-ing the first 3 days resulted in nitrogen deficiency in the following days under 15% CO2. Microalgae consumed its
chlorophyll to maintain cell growth under nitrogen defi-ciency from the 4th day, and the chlorophyll content of
Chlorella PY-ZU1 decreased. By contrast, chlorophyll content of Chlorella PY-ZU1 still increased when cul-tivated under air. Given that chlorophyll synthesis is almost directly proportional to nitrate concentration in the culture medium, the chlorophyll contents of Chlo-rella PY-ZU1 were almost the same under different CO2
conditions by the end of the cultivation period [1, 29]. However, during cultivation, the chlorophyll content of
Chlorella PY-ZU1 cultivated under 15% CO2 was always
higher than that of under air, which resulted in higher microalgae growth rate (Fig. 1).
Analysis of different concentrations of CO2 transport and fixation mechanisms
Figure 5 shows the biomass productivity of Chlorella
PY-ZU1 cultivated in optimized SE medium under dif-ferent CO2 concentrations. Excessively low (<1%) and
high (>30%) CO2 concentration could restrain
micro-algae growth and resulted in lower biomass yield (<2 g L−1). However, when cultivated under 1% CO
2,
the biomass yield drastically increased by 130.2% to 3.73 g L−1 compared with the 1.62 g L−1 obtained by
cultivation under 0.5% CO2. The drastically increased
biomass yield in response to higher CO2
concentra-tions indicated some changes in the pathway of CO2 (3) 2NO−3 Nitrate reductase−→ 2NO−2 +O2
(4)
NO−2 +6NADPHNitrite reductase−→ NH+4 +2OH−+6NADP
(See figure on next page.)
Fig. 4 Genes transcript abundance of nitrogen metabolism pathway in cells (a), nitrate consumption (b), qRT-PCR of nitrate reductase (c) and chlo-rophyll synthesis (d) of Chlorella PY-ZU1 cultivated under 15% CO2 versus air. Key enzymes of Calvin cycle were shown in boxes as enzyme
0 1 2 3 4 5 6 7 0.0
0.5 1.0 1.5 2.0 2.5 3.0
NO
3
- (mM
)
Cultivation time (day)
Air (CO2=384ppm)
15% CO2
b
12h 24h 48h 72h
0 500 1000 1500 2000 2500
3000
Nitrate reductase
Relative Transcript Leve
l
Air (CO =384ppm)2
15% CO2
Cultivation time
C
0 1 2 3 4 5 6 7
0 5 10 15 20 25 30
Air (CO =384ppm)2 15% CO2
Cultivation time (day)
Chlorophyll (mg
L
-1)
transfer and utilization by microalgae. CCM will work when microalgae is cultivated under limited CO2
condi-tions, such as air. However, it will not work if the CO2
that directly diffused to pyrenoids by extra- and intra-cellular CO2 osmotic pressure is sufficient for rubisco,
more energy was concentrated for cell growth. Thus, biomass productivity was dramatically enhanced [11]. An external concentration of 0.5% CO2 was too low for Chlorella PY-ZU1 because it could not supply enough CO2 through osmosis to rubisco. However, 1% external
CO2 could overcome diffusion resistance to enable CO2
flux from the external medium to the cytoplasm. More-over, enough CO2 diffusion by high CO2 stress to the
cytoplasm resulted in non-operational CCM. Therefore, >1% external CO2 concentration maintained enough
CO2 in pyrenoids for rubisco only through direct
dif-fusion, which is dependent on extra- and intra-cellular CO2 osmotic pressure. When cultivated under 3–30%
CO2, Chlorella PY-ZU1 had stable, higher biomass
yields of 4.60–4.78 g L−1. Therefore, 3–15% was ideal
CO2 concentration for Chlorella PY-ZU1 growth.
How-ever, when CO2 concentration exceeded 30%, excess
CO2 inhibited microalgal growth and sharply decreased
biomass yield (1.89 g L−1). Therefore, >30% external
CO2 is too high for Chlorella PY-ZU1 given the overly
acidic culture after aeration with higher CO2
concentra-tions [26, 27].
Discussion
The CCM process has a specific CAs to catalyze the con-version of HCO3 to CO2 at the expense of ATP [26]. For
optimal efficiency, the carboxysomal CAs activity needs to match, as closely as possible, the maximal rate of CO2
fixation [4, 30] under limited CO2 conditions. The
dis-solved CO2 concentration increased from 6.14 μM to
4.60 mM as the aerated CO2 concentration increased
from 384 ppm (air) to 15% (Table 2). Km (CO2) of rubisco
is the critical point in the activation of rubisco [15] and allows cells to initiate the CCM process [31]. Therefore, microalgal growth rate and biomass yield will increase significantly when the dissolved CO2 concentration in
the culture is higher than Km (CO2) of rubisco. The
bio-mass yield of Chlorella PY-ZU1 cultivated under 1% CO2
increased sharply by 130.2% to 3.73 g L−1 compared with
1.62 g L−1 obtained from cultivation with 0.5% CO 2. It
is known that CCM is energy consumption process and
Km is the critical point in the activation of rubisco. On
one hand, if the intracellular CO2 concentration around
rubisco is higher than Km, CCM would not work. More
energy would be saved for microalgae growth. This is to say we can estimate whether CCM works from the micro-algae growth condition. On the other hand, the mixed CO2 gas aerated into microalgae suspension as carbon
source. The intracellular CO2 should be balanced with the
dissolved CO2 in suspension without CCM after
equilib-rium of CO2 gas dissolving. The microalgae growth rate
has a significant increase when the dissolved CO2
con-centration in culture increased from 80 to 192 μM. It could be deduced CCM did not work under 192 μM of dissolved CO2 concentration but might still work under
80 μM. Therefore, the Km (CO2) value of rubisco in Chlo-rella PY-ZU1 might be in the range of 80–192 μM, which corresponds to 1% aerated CO2 concentration. These
val-ues are consistent with those of previous reports.
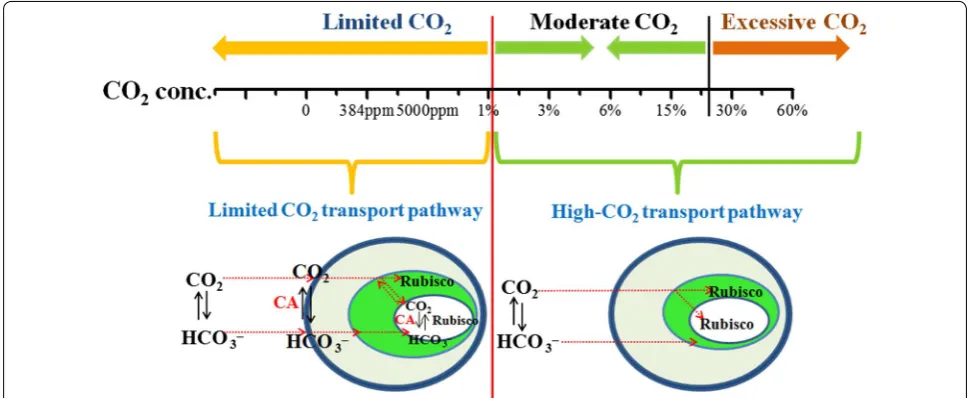
Furthermore, we utilized de novo assembly and anno-tation to reconstruct the possible pathways in Chlorella
PY-ZU1 cells for inorganic carbon transport to pyrenoids from the external medium in response to different aer-ated CO2 concentrations based on the pyrenoid model
[22]. When cultivated under limited CO2, such as under
air, the dissolved CO2 concentration of 6.14 μM in the
culture could not meet the CO2 demands of rubisco.
Therefore, Chlorella PY-ZU1 initiated CCM to local-ize CO2 in pyrenoids. However, >1% CO2 concentration 384ppm 5000ppm 1% 3% 6% 15% 30% 60%
1.0 1.5 2.0 2.5 3.0 3.5 4.0 4.5 5.0
CO concentration2
Biomass yield (g/L)
Fig. 5 Biomass yield of Chlorella PY-ZU1 cultivated with optimized SE medium under various concentrations of CO2
Table 2 pH and dissolved CO2 concentration of Chlorella PY-ZU1 culture aerated with various concentrations of CO2 gas
Aerated CO2 conc. % 0.0384 0.5 1 3 6 15 30 60
supplied enough dissolved CO2 (>192 μM). Thus, the
cell did not initiate CCM. The free CO2 molecules
per-meating to the pyrenoids were sufficient for direct use by rubisco. Increased CO2 accumulation increased the cell’s
photosynthetic efficiency, resulting in a higher biomass yield of 3.73 g L−1. In addition, with the further
increas-ing of CO2 concentration to 30%, the dissolved CO2
con-centration increased to 9.4 mM. Although, the dissolved CO2 also could meet the demands of rubisco. Excessive
CO2 could acidify the microalgae culture, resulting in
cell “anesthesia” [32] and decreasing enzymatic activity [33, 34], which eventually drastically decreases Chlorella
PY-ZU1 biomass yield. Therefore, <1% CO2 was too
lim-ited for Chlorella PY-ZU1. As a result, CCM was initiated to concentrate CO2. Therefore, 1–30% CO2 concentration
is very suitable for Chlorella PY-ZU1 growth, whereas >30% CO2 is excessive for microalgae growth (Fig. 6). Conclusions
The biomass yield of Chlorella PY-ZU1 cultivated under 0.5% CO2 was only 1.62 g L−1. However, when cultivated
under 1% CO2, the biomass yield drastically increased
by 130.2% to 3.73 g L−1. The drastically increased
bio-mass yield in response to higher CO2 concentration
indicated some changes happened in CO2 transfer and
utilization by microalgae. CAs in Chlorella PY-ZU1 cells cultivated under 15% CO2 barely expressed. That
indicated CO2 could directly permeate into intra-cell
for rubisco to fix without CCM working at the expense of ATP. While CCM in cells that cultivated under <1% CO2 conditions would work for CO2 transport. Carbon
fixation and nitrogen metabolisms are the two most
important aspects of primary cell metabolisms. Besides the improved expression of enzymes in carbon fixation pathways, the enzymes in nitrogen metabolism pathways, including nitrate reductase, nitrite reductase and gluta-mate dehydrogenase, also had an increased expression level under 15% CO2 condition. Further studies should be
taken to determine CO2 distribution and verify the exact Km (CO2) of rubisco in microalgae cells.
Abbreviations
CAs: carbonic anhydrase; CCM: CO2 concentrating mechanism; Km (CO2):
concentration of CO2 required for 50% of the maximum
photosynthe-sis rate; Rubisco: ribulose-1,5-bisphosphate carboxylase/oxygenase; RuBP: ribulose-1,5-bisphosphate; 3-PGA: 3-phosphoglyceride; DHAP: dihydroxyacetone phosphate; S7P: sedoheptulose-7-phosphate; fbaB: fructose-1,6-bisphosphatase aldolase; Ru5P: ribulose-5-phosphate; SBPase: sedoheptulose-1,7-bisphosphatase.
Authors’ contributions
YH and JC proposed the idea and hypothesis. YH carried out the experiment design and performed the Illumina sequencing and de novo transcriptome assembly and drafted the manuscript. HL and YH carried out the microalgae cultivation experiments. JC performed the statistical analysis. JZ and KC helped to draft and revise the manuscript. All authors read and approved the final manuscript.
Author details
1 State Key Laboratory of Clean Energy Utilization, Zhejiang University,
Hangzhou 310027, China. 2 Key Laboratory of Low-grade Energy Utilization
Technologies and Systems of Ministry of Education, Chongqing University, Chongqing 400044, China.
Additional files
Additional file 1. Genes differental expression of Chlorella PY-ZU1 under 15% CO2 compared with that under air.
Additional file 2. Original data of qRT-PCR.
Acknowledgements
This study is supported by National key research and development program-China (2016YFB0601001), National Natural Science Foundation—program-China (51476141).
Competing interests
The authors declare that they have no competing interests.
Availability of data and materials
The datasets supporting the conclusions of this article are included within the article.
Consent for publication
All authors have approved the manuscript for submission and confirm that the content of the manuscript has not been published, or submitted for publication elsewhere.
Publisher’s Note
Springer Nature remains neutral with regard to jurisdictional claims in pub-lished maps and institutional affiliations.
Received: 27 April 2017 Accepted: 5 July 2017
References
1. Huang J, Yang Z, Guan F, Cui D, Guan G, Jiang W, Li Y. Improved produc-tion of a recombinant Rhizomucor miehei lipase expressed in Pichia pastoris and its application for conversion of microalgae oil to biodiesel. Biotechnol Biofuels. 2014;7:111–21.
2. Chang H, Huang Y, Fu Q, Liao Q, Zhu X. Kinetic characteristics and modeling of microalgae Chlorella vulgaris growth and CO2 biofixation
considering the coupled effects of light intensity and dissolved inorganic carbon. Bioresour Technol. 2016;206:231–8.
3. Larkum A. Limitations and prospects of natural photosynthesis for bioen-ergy production. Curr Opin Biotech. 2010;21:271–6.
4. Kupriyanova E, Pronina N. Carbonic anhydrase: enzyme that has trans-formed the biosphere. Russ J Plant Physiol. 2011;58:197–209. 5. Bhatti S, Colman B. Evidence for the occurrence of photorespiration in
synurophyte algae. Photosynth Res. 2011;109:251–6.
6. Cheng J, Huang Y, Feng J, Sun J, Zhou J, Cen KF. Mutate Chlorella sp. by nuclear irradiation to fix high concentrations of CO2. Bioresour Technol.
2013;136:496–501.
7. Satoh A, Kurano N, Miyachi S. Inhibition of photosynthesis by intracellular carbonic anhydrase in microalgae under excess concentrations of CO2.
Photosynth Res. 2001;68:215–24.
8. Raven J, Giordano M, Beardall J, Maberly S. Algal evolution in relation to atmospheric CO2: carboxylases, carbon-concentrating mechanisms and
carbon oxidation cycles. Phil T R Soc B. 2012;367:493–507. 9. Aizawa K, Miyachi S. Carbonic anhydrase and CO2 concentrating
mechanisms in microalgae and cyanobacteria. FEMS Microbiol Lett. 1986;39:215–33.
10. Kupriyanova E, Samylina O. CO2-concentrating mechanism and its traits
in haloalkaliphilic cyanobacteria. Microbiology. 2015;84:112–24. 11. Satoh A, Kurano N, Senger H, Miyachi S. Regulation of energy balance in
photosystems in response to changes in CO2 concentrations and light
intensities during growth in extremely-high-CO2-tolerant green
microal-gae. Plant Cell Physiol. 2002;43:440–51.
12. Zhao B, Su Y, Zhang Y, Cui G. Carbon dioxide fixation and biomass production from combustion flue gas using energy microalgae. Energy. 2015;89:347–57.
13. Huang Y, Cheng J, Lu H, Huang R, Zhou J, Cen K. Simultaneous enhance-ment of microalgae biomass growth and lipid accumulation under continuous aeration with 15% CO2. RSC Adv. 2015;5:50851–8.
14. Thoms S, Pahlow M, Wolf-Gladrow D. Model of the carbon concen-trating mechanism in chloroplasts of eukaryotic algae. J Theor Biol. 2001;208:295–313.
15. Schwedock J, Harmer T, Scott K, Hektor H, Seitz A, Fontana M, Distel D, Cavanaugh C. Characterization and expression of genes from the RubisCO gene cluster of the chemoautotrophic symbiont of Solemya velum: cbbLSQO. Arch Microbiol. 2004;182:18–29.
16. Cheng R, Feng J, Zhang B, Huang Y, Cheng J, Zhang C. Transcriptome and gene expression analysis of an oleaginous diatom under different salinity conditions. BioEnergy Res. 2014;7:192–205.
17. Matsuda Y, Hara T, Colman B. Regulation of the induction of bicarbonate uptake by dissolved CO2 in the marine diatom, Phaeodactylum
tricornu-tum. Plant Cell Environ. 2001;24:611–20.
18. Lorenzen C. Determination of chlorophyll and pheo-pigments: spectro-photometric equations. Limnol Oceanogr. 1967;12:343–6.
19. Millero F, Graham T, Huang F, Bustos-Serrano H, Pierrot D. Dissociation constants of carbonic acid in seawater as a function of salinity and tem-perature. Mar Chem. 2006;100:80–94.
20. Cheng J, Sun J, Huang Y, Feng J, Zhou J, Cen K. Dynamic microstruc-tures and fractal characterization of cell wall disruption for microwave irradiation-assisted lipid extraction from wet microalgae. Bioresour Technol. 2013;150:67–72.
21. Fridlyand L. Models of CO2 concentrating mechanisms in
microal-gae taking into account cell and chloroplast structure. Biosystems. 1997;44:41–57.
22. Kuchitsu K, Tsuzuki M, Miyachi S. Polypeptide composition and enzyme activities of the pyrenoid and its regulation by CO2 concentration in
unicellular green algae. Can J Bot. 1991;69:1062–9.
23. Ho S, Chen C, Lee D, Chang J. Perspectives on microalgal CO2 emission
mitigation systems—a review. Biotech Adv. 2011;29:189–98. 24. Badger M, Andrews T, Whitney S, Ludwig M, Yellowlees D, Leggat W,
Price G. The diversity and coevolution of rubisco, plastids, pyrenoids, and chloroplast-based CO2-concentrating mechanisms in algae. Can J Bot.
1998;76:1052–71.
25. Price G. Inorganic carbon transporters of the cyanobacterial CO2
concen-trating mechanism. Photosynth Res. 2011;109:47–57.
26. Fan J, Xu H, Luo Y, Wan M, Huang J, Wang W, Li Y. Impacts of CO2
concen-tration on growth, lipid accumulation, and carbon-concentrating-mech-anism-related gene expression in oleaginous Chlorella. Appl Microbiol Biotechnol. 2015;99:2451–62.
27. Xia J, Gao K. Impacts of elevated CO2 concentration on biochemical
com-position, carbonic anhydrase, and nitrate reductase activity of freshwater green algae. J Integr Plant Biol. 2005;47:668–75.
28. Kim W, Park J, Gim G, Jeong S, Kang C, Kim D, Kim S. Optimization of cul-ture conditions and comparison of biomass productivity of three green algae. Bioproc Biosyst Eng. 2012;35:19–27.
29. Edwards V, Tett P, Jones K. Changes in the yield of chlorophyll a from dissolved available inorganic nitrogen after an enrichment event—appli-cations for predicting eutrophication in coastal waters. Cont Shelf Res. 2003;23:1771–85.
30. Moroney J, Somanchi A. How do algae concentrate CO2 to increase the
efficiency of photosynthetic carbon fixation. Plant Physiol. 1999;119:9–16. 31. Lan Y, Keith A. Determination of apparent Km values for
ribulose-1,5-bis-phosphate carboxylase/oxygenase (rubisco) activase using the spectro-photometric assay of rubisco activity. Plant Physiol. 1991;95:604–9. 32. Rabinowitch Eugenne I. Photosynthesis and related processes. Soil Sci.
1951;72:482.
33. Drake B, Gonzàlez-Meler M, Long S. More efficient plants: a consequence of rising atmospheric CO2. Physiol Mol Biol Plant. 1997;48:609–39.
34. Sage R. Acclimation of photosynthesis to increasing atmospheric CO2: