University of Trento
Enrico Cazzador (Ph.D. Student)
SEISMIC PERFORMANCE ANALYSIS OF
BRIDGES WITH ISOLATION DEVICES
ENHANCED BY HYBRID DYNAMIC
SUBSTRUCTURING
Prof. Oreste Salvatore Bursi (Tutor)
UNIVERSITY OF TRENTO
Doctorate in Engineering of Civil and Mechanical
Structural Systems
Cycle: XXVIII
Head of the Doctoral School: Prof. Paolo Scardi
Final Examination: 21 / 04 / 2016
Board of examiners:
Prof. Alexander Movchan (University of Liverpool
-Department of Mathematical Sciences, M&O Building)
Prof. Bozidar Stojadinovic (ETH Zurich - Department of
Civil, Environmental and Geomatic Engineering)
ABSTRACT
The Seismic Performance Analysis of Bridges (SPAB) constitutes one of the
biggest challenges for structural and civil engineers. In fact, the handling of these
design problems requires a deep knowledge of structural behavior and a huge
ex-pertise with numerical and analytical tools necessary to perform advanced Finite
Element (FE) simulations including dynamic and probabilistic aspects. Within the
scope of SPAB, this thesis proposes the analysis of complex bridges assisted
by the profitable well-known method of Dynamic Substructuring (DS), advanced
model updating strategies, fully probabilistic approaches and innovative time
inte-gration algorithms. SPAB includes the evaluation of several nonlinear behaviors
inside the structural components and the quantification of benefits generated by
safety systems such as isolation devices. As a result, in order to highlight the main
advantages of a well designed isolation system, most of the cases analyzed
in-clude the comparison between non isolated and isolated configurations. In greater
detail, four different bridges have been analyzed and will be presented in this
the-sis.
First, the Rio Torto highway viaduct, an existing Reinforced Concrete (RC) viaduct
on the A1 Italian highway between Florence and Bologna. The structure has been
investigated at the laboratory of the Joint Research Center in Ispra (VA) by means
of Hybrid Simulations (HSs). The set of 1 : 2.5 scaled substructures included two
RC frame piers and the isolation system. The critical issues of the structure due to
the complexity of the geometry and the awfulness was the presence of poor
seis-mic details characterized by plain steel rebars. Owing to lack in knowledge for this
type of rebars, tests were needed to analyze the seismic response in theas built
configuration and to evaluate the effectiveness of a seismic retrofitting designed
with a traditional Concave Sliding Bearings (CSBs) system.
Then, a typical RC bridge with an innovative prototype of Concave Sliding
Bear-ing (CSB) has been tested at the EUCENTRE Tress Laboratory in Pavia (PV)
through HSs. The set of Physical Substructures (PSs) included a 1 : 2 scaled
RC box section pier and a full-scale CSB. The prototype was characterized by an
asymptotic relation between friction coefficient and load rate. All the benefits of the
isolation system, even with the low speed of the test, the restoring force coming
from the CSB was numerically corrected at each time step.
Furthermore, a short-medium span Steel Concrete Composite Bridge made with
Hot rolled I-girders (SCCBH) has been investigated. The SCCBH is an example of
structural optimization; in fact, it combines both economic and functional benefits
deriving from the reduction of in siteworks, e.g. welding, and short construction
time. In particular, The novelties were threefold:i)the testing of a novel connection
between a steel I-girder and a Concrete Cross Beam (CCB); ii)the development
of a novel mechanical model for this connections; iii)the application of the
Per-formance Based Earthquake Engineering (PBEE) to SCCBH. The experimental
campaign has been performed on six 1 : 2 scaled substructures, representing a
deck sub-assembly, tested in both longitudinal and transverse loading directions.
Finally, a simulation-based reliability assessment of a complex cable-stayed
foot/-cyclic bridge located close to the sea and equipped with dynamic viscous dampers
was performed. The scope was to investigate the benefits of Circular Hollow
Sec-tion (CHS) structural members for this type of structure when erected in an
ag-gressive environment. A FE model of the structure has been validated, and then
used to perform a probabilistic time dependent analysis. Therefore, two corrosion
models, i.e. general and localized, capable of evaluating the reduced load bearing
section were implemented; and appropriate probability distribution functions were
assigned to input model parameters to evaluate the response of the facility during
its service life. As a result, the time dependent probabilities of failure have been
evaluated and compared with the codes prescriptions.
ACKNOLEDGEMENTS
I would like to express my deep gratitude to Professor Oreste Salvatore Bursi,
my research supervisor, for his patient guidance, enthusiastic encouragement and
useful critiques during my Ph.D.
This research activity would not have been possible without the interaction and
cooperation with all the people of the research group. A particular thanks to Dr.
Giuseppe Abbiati, Dr. Nicola Tondini, Mr. Manuel Fassin, Dr. Alessio Bonelli, Dr.
Fabrizio Paolacci, Mr. Andrea Morbioli.
Thanks to ArcelorMittal Europe for the opportunity to spend a fruitful period in its
Research and Development Department. Especially, thanks to Ms. Nicoleta Popa,
Dr. Oliver Hechler, Mr. Riccardo Zanon.
A thanks to the partners of each research project and to each structure that
al-lowed me for developing my research activity. In greater detail, The Laboratory of
the University of Trento, the ELSA Laboratory of Joint Research Centre of Ispra,
the EUCENTRE TREES Laboratory of Pavia.
A special thanks to all my closest friends that even though we are faraway, they are
always an important part of my life.
Finally, the most important thanks. To my family, my mother Stefania, my brother
Riccardo and Giulia that gave me and still give me support and motivation
PUBLICATIONS
As a result of the work conducted in this thesis, the following publications have
been produced:
Journal publications
• O.S. Bursi,E. Cazzador, A. Ussia, 2015. Probabilistic analysis of a twin deck
curved cable-stayed footbridge subjected to multiple inputs and corrosion.
Journal of Engineering Structures. Volume 105, 15 December 2015, Pages
87-98. doi: 10.1016/j.engstruct.2015.09.034.
• O.S. Bursi ,E. Cazzador, M. Fassin, F. Paolacci, S. Alessandri, 2016. A novel
componet-based model of steel I-girder-to-concrete cross beam connections
for the seismic response of composite short-medium span bridges. Journal
of Earthquake Engineering and Structural Dynamics. (In preparation to be
submitted).
• F. Paolacci, S. Alessandri, R. Giannini, O.S. Bursi ,E. Cazzador, 2016.
Prob-abilstic seismic response of steel concrete composite bridges made with hot
rolled I-girders and concrete cross beam. (In preparation to be submitted).
• O.S. Bursi, G. Abbiati, E. Cazzador, P. Pegon and F. J. Molina. Transient
analysis of non-linear heterogeneous structural systems enhanced with
dy-namic substructuring and a parallel FETI time integrator. 2016 International
journal of numerical methods in engineering. (In preparation to be
submit-ted)
SCOPUS indexed publications
• G. Abbiati, O.S. Bursi, E. Cazzador, Z. Mei, F. Paolacci, P. Pegon, 2013.
”Pseudo-dynamic testing with non-linear substructuring of a reinforced
con-crete bridge”. SERIES Concluding Workshop joint with NEES-US
Earth-quake Engineering Research Infrastructures JRC Ispra, May 28-30.
• G. Abbiati, O.S. Bursi,E. Cazzador, R. Ceravolo; Z. Mei; F. Paolacci; P.
Pe-gon, Pseudo-Dynamic Testing Based on Non-linear Dynamic Substructuring
of a Reinforced Concrete Bridge Experimental Research in Earthquake
Engineering, Institute for the Protection and Security of the Citizen: Springer,
2015.
Conference proceeding publications
• O.S. Bursi, G. Abbiati,E. Cazzador, Z. Mei, 2013. Numerical advances in the
pseudo-dynamic testing technique with non-linear substructuring applied to a
reinforced concrete bridge. Conference of the ASCE Engineering Mechanics
Institute. EMI2013, August 4-7, Northwestern University, Evanston, Illinois.
• G. Abbiati, O.S. Bursi,E. Cazzador, Z. Mei, 2013. Numerical tools for the
reduction of complex dynamic models. SERIES Concluding Workshop joint
with NEES-US Earthquake Engineering Research Infrastructures, JRC Ispra,
May 28-30.
• G. Abbiati, O.S. Bursi,E. Cazzador, R. Ceravolo, Z. Mei. Hybrid simulation
of an old reinforced concrete viaduct based on nonlinear substructuring
techniques Smart Monitoring Assessment and Rehabilitation of Civil Structures
-SMAR 2013, September 9-11, Istanbul, Turkey.
• O.S. Bursi, G. Abbiati, M.S. Reza,E. Cazzador, 2013. Advances in
Pseudo-Dynamic Testing of Complex Structures Based on Model Reduction
Tech-niques. 5th International Conference on Advances in Experimental Structural
Engineering, 5AESE, November 8-9, Taipei, Taiwan.
• G. Abbiati, O. S. Bursi, E. Cazzador, J. Molina, V. La Salandra, 2014. A
Model Updating Strategy for Hybrid Simulation of a Complex Bridge. 6th
edition of the World Conference of the International Association for Structural
Control and Monitoring (IACSM), Universitat Politcnica de Catalunya, July
15-17. Barcelona, Spain.
• O. S. Bursi, G. Abbiati,E. Cazzador, P. Pegon. An Improved Parallel
Par-titioned Time Integration Scheme based on the Generalized-a method for
Hybrid Simulation. 6th edition of the World Conference of the International
Association for Structural Control and Monitoring (IACSM), Universitat
• G. Abbiati, O. S. Bursi, E. Cazzador, F. Paolacci and P. Pegon, 2015.
Hy-brid Simulation of Complex Structural Systems Based on Partitioned Time
Integration Schemes. 6th edition of the International Conference on
Compu-tational Methods for Coupled Problems in Science and Engineering
(COU-PLED PROBLEMS 2015). May 18-20, Island of San Servolo, in Venice, Italy.
• G. Abbiati, E. Cazzador, I. Lanese, S. Eftekhar Azam, O.S. Bursi, and A.
Pavese, 2015. Recent advances on the hybrid simulation of bridges base on
partitioned time integration, dynamic identification and model updating. 6th
International Conference on Advances in Experimental Structural
Engineer-ing 11th International Workshop on Advanced Smart Materials and Smart
Structures Technology August 1-2, University of Illinois, Urbana-Champaign,
United States
• E. Cazzador, M. Fassin, O.S. Bursi, F. Paolacci, O. Hechler, 2015.
Per-formance Based Earthquake Engineering applied to composite bridges with
short and medium spans and concrete cross beams. Proceedings of the
ECCS - International Symposium on Steel Bridges, September14-16
Istan-bul, Turkey
• M. Fassin, E. Cazzador, O.S. Bursi, F. Paolacci, 2015. An Innovative
Me-chanical Model For Steel-Concrete Connections Of Bridges Subjected To
Earthquake Loadings XXV GIORNATE ITALIANE DELLA COSTRUZIONE
C
ONTENTS1 INTRODUCTION 1
1.1 Seismic performance analysis of bridges . . . 1
1.2 Original scientific contributions of the thesis . . . 2
1.3 Structure of the thesis . . . 5
2 ADVANCED PROCEDURE FOR SESMIC PERFORMANCE ANALYSIS OF BRIDGES - METHODOLOGY 9 2.1 Step I - Generation of predictive FE models and selection of seismic input . . . 9
2.2 Step II - Design and development of experimental tests . . . 10
2.2.1 Hybrid simulations based on pseudo dynamic test . . . 10
2.2.2 Quasi static cyclic tests . . . 11
2.3 Step III - Improvement of FE models by means of validation and calibration procedures . . . 13
2.4 Step IV - Development of advanced probabilistic analysis with im-proved FE models . . . 18
2.4.1 Performance Based Earthquake Engineering Framework . . 19
2.4.2 Reliability time dependent analysis based on Monte Carlo simulations and latin hypercube sampling . . . 21
3 SEISMIC RETROFITTING OF AN OLD REINFORCED CONCRETE VIADUCT BASED ON HYBRID SIMULATIONS - CASE STUDY I 27 3.1 Introduction. . . 27
3.2.1 Design of the isolation system based on concave sliding
bear-ings . . . 31
3.2.2 Seismic Input . . . 35
3.2.3 Predictive FE model of Case Study I . . . 36
3.3 Experimental Campaign . . . 40
3.3.1 Physical substructures . . . 44
3.3.2 Numerical substructures for piers . . . 47
3.3.3 Numerical substructures for concave sliding bearings . . . . 55
3.3.4 Friction coefficient and test velocity - Solution I . . . 60
3.3.5 Model Updating offline. . . 62
3.3.6 Outcomes of hybrid simulations . . . 65
3.4 Improvement of FE models based on springs-based modelling . . . 69
3.4.1 Validation and calibration of Model #1 and Model #2 . . . 73
3.4.2 Validation and calibration of Model #3 . . . 82
3.5 Conclusions . . . 91
4 SEISMIC ASSESSMENT OF A REINFORCED CONCRETE BRIDGE BASED ON HYBRID SIMULATIONS - CASE STUDY II 97 4.1 Introduction . . . 97
4.2 Description of Case Study II . . . 98
4.2.1 Seismic input . . . 99
4.2.2 Predictive FE model of Case Study II . . . 101
4.3 Experimental campaign . . . 105
4.3.1 Partitioned time integrator algorithm . . . 106
4.3.2 Physical substructure for pier . . . 109
4.3.3 Physical substructure for concave sliding bearings . . . 111
4.3.4 Numerical substructure for pier . . . 112
4.3.5 Numerical substructure for concave sliding bearings . . . 115
4.3.6 Friction coefficient and test velocity - Solution II . . . 115
4.3.7 Model updating online based on a Unscented Kalman Filter 116 4.3.8 Outcomes of hybrid simulations . . . 122
4.4 Improvement of FE models based on springs-based modelling . . . 126
4.5 Numerical simulations with the improved FE model . . . 131
4.6 Conclusions . . . 131
5 SEISMIC DESIGN AND ASSESSMENT OF A COMPOSITE STEEL-CONCRETE BRIDGE BASED ON CYCLIC TESTS - CASE STUDY III 135 5.1 Introduction . . . 135
5.2 Description of Case Study III . . . 136
5.2.1 Novel concrete cross beam joint solutions . . . 139
5.2.1.1 Variant C of DIN FB 104 . . . 140
5.2.1.2 DOMI-I . . . 140
5.2.1.3 DOMI-II . . . 142
5.2.2 Simplified FE model of Case Study III . . . 143
5.2.3 Predictive FE model of Case Study III . . . 145
5.3 Experimental Campaign . . . 150
5.3.1 Loading protocols and test results . . . 156
5.4 Improvement of FE models based on springs-based modelling . . . 159
5.4.1 Evaluation and implementation of setup flexibility . . . 160
5.4.2 A Component-Based Mechanical Model for bridge connections165 5.4.3 Validation and calibration of component-based mechanical model . . . 175
5.5 Probabilistic seismic demand evaluation of case study III . . . 181
5.5.1 Incorporation of the component-based mechanical model in the full-scale bridge model . . . 181
5.5.2 Input ground motions . . . 183
5.5.3 Results of probabilistic seismic demand analysis . . . 184
5.6 Conclusions . . . 187
6 RELIABILITY ANALYSIS OF A FOOT/ CYLCIC BRIDGE - CASE STUDY IV 191 6.1 Introduction . . . 191
6.2 Description of the case study IV . . . 192
6.2.2 The FE model of the actual open section-based foot/cyclic
bridge . . . 197
6.2.3 Re-design of the case study IV based on circular hollow sec-tion elements . . . 199
6.3 Probabilistic analysis of the bridge . . . 201
6.3.1 Definitions of random variables and distributions . . . 201
6.3.2 Yield strength of steel . . . 203
6.3.3 Pedestrian loading . . . 204
6.3.4 Wind loads . . . 205
6.3.5 Corrosion deterioration models . . . 210
6.3.5.1 Model #1 - Uniform corrosion . . . 210
6.3.5.2 Model #2 - Localized corrosion . . . 212
6.3.6 Numerical simulations setting . . . 215
6.3.7 Load cases and limit states . . . 216
6.3.8 Time variation of output parameters. . . 216
6.3.9 Estimation of out-of-service conditions . . . 219
6.4 Conclusions . . . 222
7 SUMMARY, CONCLUSIONS AND FUTURE PERSPECTIVES 225 7.1 Summary . . . 225
7.2 Conclusions . . . 227
7.3 Future Perspectives . . . 232
L
IST OFF
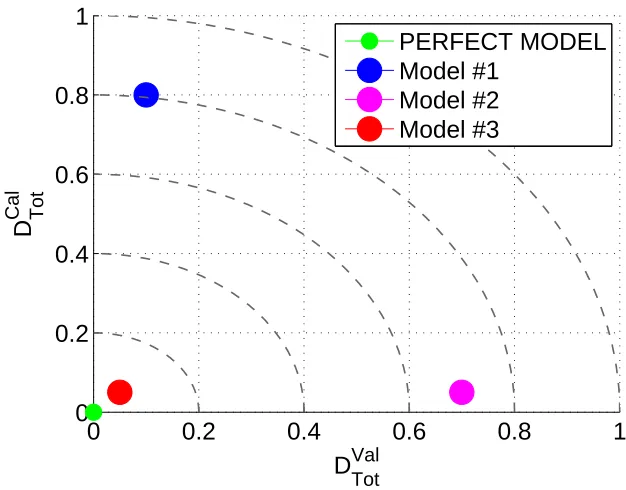
IGURES2.1 Domain of models errorErrTot . . . 17
2.2 Parts of the Performance Based Earthquake Engineering (PBEE)
method . . . 20
2.3 General case of probability of failure, after Holicky et al. (2005) . . . 22
3.1 A view of Case Study I connection of A1 highway between Florence
to Bologna. . . 28
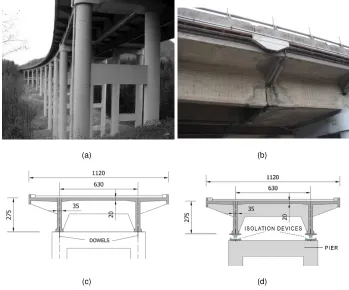
3.2 Structural details of Case Study I: a) View of the frame piers; b)
View of the Gerber Saddles; c) Cross section of theas built bridge;
d) Cross section of the isolated bridge. . . 29
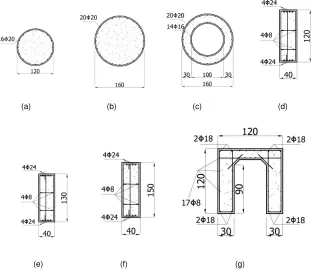
3.3 Distribution of circular and hollow sections. . . 30
3.4 Full-scale cross sections of piers elements: a) circular cross section
120 cm diameter; b) circular cross section 160 cm diameter; c)
hol-low circular section; d) transverse beam 120 cm high; e) transverse
beam 130 cm high; f) transverse beam 150 cm high; g) cap beam
section. . . 31
3.5 Details of Pier #9 and #11 reinforcements. . . 32
3.6 Details of the CSB adopted for the seismic retrofitting: a) CSB type
I (courtesy of ALGAS.p.A); b) Hysteretic behavior of the CSB
ob-tained during dynamic tests. . . 34
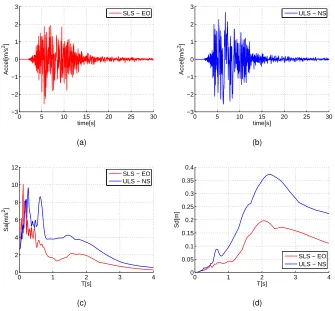
3.7 Seismic input for both SLS and ULS:a) accelerogram of the SLS
ground motion; b) accelerogram of the ULS ground motion; c)
ac-celeration response spectra; d) displacement response spectra. . . . 35
3.8 Details of the predictive model of Case Study I: a) rigid links of the
3.9 Constitutive law of Opensees materials: a)Concrete01; b)Steel02. . 38
3.10 Constitutive law ofHystereticOpensees material. . . 39
3.11 Scheme of the single friction pendulum bearing Opensees element . 40 3.12 Numerical response of the predictive model of Case Study I, Cap beam displacement vs. base reaction force: a) Pier #9 at SLS; b) Pier #11 at SLS; c) Pier #9 at ULS; d) Pier #11 at ULS. . . 41
3.13 Scheme of substructures: a) asbuilt configuration; b) isolated con-figuration. . . 42
3.14 PM Method scheme. . . 43
3.15 Views of the scaled Pier #9. . . 45
3.16 Views of the scaled Pier #11. . . 46
3.17 Views of the scaled CSB: a) Cross section; b) Plan view. . . 47
3.18 Details of experimental setup. . . 48
3.19 FE model equipped with reduced model of Piers forasbuitl configu-ration:a) ANSYSGM; b) NLGRM. . . 50
3.20 MAC matrix to validate the linear reduction of the piers. . . 51
3.21 Comparison between numerical refined PMCSI and reduced S-DoF of piers: a) Pier #9 at SLS; b) Pier#11 at SLS; c) Pier #9 at ULS; d) Pier #11 at ULS. . . 55
3.22 Validation of NLGRM of Case Study I: a) Pier #9 SLS; b) Pier #11 SLS; c) Pier #9 ULS; d) Pier #11 ULS. . . 57
3.23 Hysteretic S-DoF oscillator adopted for CSBs NSs: a) idealized model; b) hysteretic bilinear law. . . 57
3.24 FE NLGRM model in the isolated configuration. . . 58
3.25 Validation of NLGRM of isolated Case Study I: a) Pier #9 SLS; b) Pier #11 SLS; c) Pier #9 ULS; d) Pier #11 ULS. . . 60
3.26 Flowchart of NSs identification procedure. . . 61
3.27 Variation of friction coefficient: a) variation due to speed; b) variation due to vertical load. . . 63
3.28 Flowchart describing the offline model updating procedure. . . 64
3.29 Variation offpc during HSs resulted from offline model updating. . . 65
3.31 Force-Displacement of test k07: a) Pier #9; b) Pier #11. . . 67
3.32 Force-Displacement of test k09 and l02: a) Pier #9; b) Pier #11. . . . 68
3.33 Cracks opening at the top and bottom of Pier #11 after test k09. . . . 68
3.34 Force-Displacement of test k09 and k10: a) Pier #9; b) Pier #11. . . 69
3.35 Force-Displacement of test k10 and k12: a) Pier #9; b) Pier #11. . . 70
3.36 Damage in the Pier #11 after k12 test: a) transverse beam damage
on Pier #11; b) blow up of the transverse beam. . . 70
3.37 Damage after k12 test: a) cracks opening at the top of a column in
Pier #11; b) cracks pattern in the first transverse beam in Pier #9. . . 71
3.38 Cracks opening and buckling phenomena at the bottom section of
columns after test k12: a) Pier #11; b) Pier #11; c) Pier #9. . . 71
3.39 LVDTs lattice positioned on Pier #11 . . . 72
3.40 Rotations of critical joints during test k07:a)ROTBLJ; b)ROTBRJ;
c)ROTTLJ; d)ROTTRJ. . . 74
3.41 Envelopes of the moment-rotation laws at SLS: a) SPBLJ; b)
SP-BRJ; c) SPTLJ; d) SPTRJ. . . 75
3.42 Views of the stick FE models of Case Study I: a) Model #1; b) Model
#2. . . 76
3.43 Comparison of rotations after validation step: a) ROTBLJ; b)
ROT-BRJ; c) ROTTLJ; d) ROTTRJ; e) Force-displacement. . . 80
3.44 Modified constitutive laws to fit calibration benchmark: a) ROTBLJ;
b) ROTTLJ. . . 81
3.45 Force-displacements response of stick models after calibration phase. 81
3.46 Reinforcements of the scaled transverse beam of Pier #11. . . 82
3.47 Details of the reinforcements of scaled transverse beam of Pier #11
(Pos. 9 - Pos. 13). . . 83
3.48 Details of the reinforcements of Pier #11: a) Transverse beam
stir-rups; b) Column reinforcements. . . 84
3.49 Views of Model#3: a) concrete volume with C3D8R solid elements;
b) rebars and stirrups implemented as T3D2 truss elements. . . 85
3.50 Equivalent springs implemented in Model #3: a) column base; b)
3.51 Details of Model #3: a) undeformed column base truss system; b)
undeformed column top truss system; c) deformed column base
truss system; d) deformed column top truss system. . . 88
3.52 Force-displacements response of 3D model after validation and cal-ibration phase. . . 90
3.53 Results after calibration phase: a) force-displacements response; b) domain of errors for Case Study I. . . 90
3.54 Details about the positions investigated on the transverse beam: a) Model #3; b) experimetnal LVDTs lattice. . . 92
3.55 Stresses on the pier transverse beam at maximum displacement of calibrated model: a) concrete; b) rebars and stirrups. . . 92
3.56 Comparison of local displacements on calibrated Model #3: a) chan-nel 28; b) chanchan-nel 29; c) chanchan-nel 30; d) chanchan-nel 31. . . 93
3.57 Comparison of local displacements on calibrated Model #3: a) chan-nel 32; b) chanchan-nel 33; c) chanchan-nel 34; d) chanchan-nel 35. . . 94
3.58 Comparison of local displacements on calibrated Model #3: a) chan-nel 37; b) chanchan-nel 38; c) chanchan-nel 39; d) chanchan-nel 40. . . 95
3.59 Comparison of local displacements on calibrated Model #3: a) chan-nel 41; b) chanchan-nel 42; c) chanchan-nel 43; d) chanchan-nel 44. . . 96
4.1 Details of Case Study II: a) lateral view of the bridge; b) cross section of pier; c) cross section of deck. . . 99
4.2 View of Case Study II: a) drawing of the Pier with the deck; b) picture of the actual pier tested at the EUCENTRE TREES Laboratory. . . . 100
4.3 Spectra of the selected accelerograms: a) SLS; b) ULS. . . 101
4.4 Accelerograms selected: a) SLS; b) ULS. . . 101
4.5 Modelling of the deck-pier connection by means of rigid links. . . 103
4.6 Constitutive law ofConcrete02Opensees material. . . 103
4.7 Numerical results of PMCSII: a) PGA of 0.12g (SLS); b) PGA of 0.3g (ULS); c) PGA of 0.9g. . . 104
4.8 EUCENTRE TREES Lab hybrid simulation system scheme. . . 105
4.10 Task sequence of the Modified PH-MG-αmethod. . . 108
4.11 Global view of the scaled pier. . . 109
4.12 Scaled pier cross section. . . 110
4.13 View of the pier PS . . . 111
4.14 RC Pier#1 test setup . . . 111
4.15 CSB direct measurement load cell . . . 112
4.16 View of the CSB: a) CSB during positioning phase; b) CSB posi-tioned under the BTS. . . 113
4.17 View of the simplified model. . . 113
4.18 Characterization tests on CSBs: a) ciso29; b) ciso30; c) ciso31; d) asymptotic behavior of CSB prototype. . . 117
4.19 Details about UKF implementation. . . 118
4.20 Hysteretic loops of the physical pier restoring force measured at the top level during tests HE 49. . . 123
4.21 Hysteretic loops of the physical pier restoring force measured at the top level during tests: a) HE 51 and HE 54; b) HE 52 and HE 55. . . 124
4.22 Hysteretic loops of the physical pier restoring force measured at the top level during tests: a) HE 53 and HE 57; b) HE 65 and HE 58. . . 124
4.23 Hysteretic loops of the physical pier restoring force measured at the top level during tests HE 60 and HE 68. . . 125
4.24 Results of test HE 60: a) time history of the estimate of the parame-ter A of the Bouc-Wen spring obtained with the UKF; b) comparison of the hysteretic loops related to the transversal response of both the numerical and the physical piers. . . 125
4.25 Set of LVDTs installed on the pier. . . 127
4.26 View of the two FE stick models: a) Model #1; b) Model #2. . . 128
4.27 Constitutive law of the base spring . . . 128
4.28 Check of the goodness of the models: a) comparison of reaction forces; b) comparison of rotations during test HE 53; c) comparison of rotations during test HE 60. . . 132
4.30 Comparison between updated numerical models: a) SLS regime; b)
ULS regime. . . 134
5.1 CCBs proposed in DIN-FB 104 (2009). . . 137
5.2 Dolna Wilda bridge realized with CCB (Poznan (Poland)). . . 137
5.3 Longitudinal view of Case Study III in the non isolated configuration. 139
5.4 Structural Details of Case Study III. . . 140
5.5 Views of DIN FB 104 Variant C joint type: a) upside view; b) lateral
view. . . 142
5.6 Views of DOMI-I joint type: a) upside view; b) lateral view. . . 142
5.7 Views of DOMI-II joint type: a) upside view; b) lateral view. . . 143
5.8 Global view of SMCSIII. . . 144
5.9 Constitutve law of LRB-S 500/100-110. . . 144
5.10 Mode shapes of SMCSIII in the non isolated configuration: a) 1stMode;
b) 2ndMode; c) 3rdMode; d) 4thMode. . . 146
5.11 Global view of PMCSIII. . . 147
5.12 elastomericBearingPlasticityOpenSEES element: a) view of the ele-ment; b) constitutive law implemented in OpenSEES. . . 150
5.13 Mode shapes of PMCSIII in the non isolated configuration: a) 1stMode;
b) 2ndMode; c) 3rdMode; d) 4thMode. . . 151
5.14 Ground motion for the preliminary simulation at 0.3g of PGA. . . 151
5.15 Numerical results of the RMCSIII:a-b)0.3g PGA ground motion; c-d)
1.5g PGA ground motion. . . 152
5.16 Position of the selected substructure on the bridge deck. . . 152
5.17 Experimental setup of transversal loadings tests. . . 153
5.18 Experimental setup of vertical loading tests (Residual capacity). . . . 154
5.19 Experimental results in the scale of specimen: a) comparison
be-tween monotonic tests; b) results of the SQ2C test; c) view of the
SQ3M specimen at collapse; d) view of the SQ2C specimen at
col-lapse. . . 158
5.20 Loading protocol: a) envelope proposed by Bursi et al. (2002); b)
5.21 Experimental results relevant to SQ3V: a) force-displacement; b)
in-stability of the bottom flange after specimen collapse. . . 160
5.22 Force displacement results of SQ3 tests (DOMI-II type joint): a)
monotonic test; b) cyclic test. . . 161
5.23 View of the substructure with additional instruments: a) additional
degrees of freedom monitored during the test; b) idealization of the
setup with the ideal springs . . . 163
5.24 Effects of the setups’ deformability . . . 164
5.25 Experimental data relevant to the most important Dofs to evaluate
the setup deformability: a) K1b; b) K2b; c) K1c; d) K2c. . . 164
5.26 View of the substructure considered for the definition of
component-based mechanical model: a) view of the elements; b) 3D view. . . . 166
5.27 Views of the the component-based mechanical model: a) frontal
view; b) in plane view. . . 168
5.28 Constitutive laws of the main components: a) TC1t; b) TC2; c) TC6. 169
5.29 Outcomes of the validation: a)Moment- curvature of right interface;
b) Moment- curvature of left interface. . . 179
5.30 Outcomes of the validation: a) elongation of springs and Gefran of
right side; b) elongation of springs and Gefran of left side. . . 180
5.31 Global comparison in term of force-displacement. . . 181
5.32 Overall Bridge with component-based mechanical model. . . 182
5.33 Mode shapes of CMMCSIII in the non isolated configuration: a)
1stMode; b) 2ndMode; c) 3rdMode; d) 4thMode. . . 183
5.34 Inputs of the hazard and structural analyses: a) annual Hazard Curve
of Priolo Gargallo (Italy); b) UHS with return period of 475 years . . 184
5.35 Evaluation of uniform hazard spectrum. . . 185
5.36 IDA results and fragility curves: a-b) edp1; c-d) edp2; e-f) edp3. . . . 188
5.37 Comparison between fragility curves in the isolated and non isolated
cases. . . 189
6.2 The Case Study IV (after, Bursi et al. (2014)): a) static scheme of
foot-track deck ; b) static scheme of foot-track deck; c) effects of the
geometry on foot-track deck. . . 193
6.3 Details about the position and the type of passive control systems
(after, Bursi et al. (2014)): a) 2D view of system position; b) 3D view
of system position; c) damper Type B; d) damper Type C. . . 195
6.4 Structural health monitoring system (after, Bursi et al. (2014)). . . 196
6.5 Rotation relevant to a rigid motion of the footbridge deck. . . 197
6.6 3D view of the RMCSIVOS (after, Bursi et al. (2014)). . . 198
6.7 Modal analysis of the RMCSIVOS (after, Bursi et al. (2014)): a) first
mode shape; b) second mode shape. . . 199
6.8 Foot track deck with open section members and with CHS members. 199
6.9 Footbridge deck details: a) section with hulls; b) typical elements of
the deck. . . 200
6.10 Deck member sections: a) upper chord; b) lower chord; c) diagonals,
bracings, vertical braces and dividers. . . 201
6.11 Distributions for pedestrian loading parametrized as a function of
years: a) PDF; b) CDF. . . 205
6.12 CDF for wind load: a) sea side; b) ground side. . . 207
6.13 Location of aerodynamic nodes on RMCSIVCHS. . . 209
6.14 Foot track deck spatial distribution of gust factor for deflections
un-der: a) ground wind; b) sea wind. . . 209
6.15 Cycle track deck spatial distribution of gust factor for deflections
un-der: a) ground wind; b) sea wind. . . 210
6.16 Spatial distribution of gust factors for rotations relevant to sea wind
for: a) foot track deck; b) cycle track deck. . . 211
6.17 Corrosion models details: a) evolution of corrosion ratercorr; b) pit
configuration in a hollow cross section. . . 212
6.18 Evolution of maximum deck deflection of Case Study IV
correspond-ing to Case 5.2: a) foot track deck; b) cycle track deck. . . 218
6.19 Evolution of maximum deck deflection corresponding to Case 2.2:
6.20 Evolution of maximum deck deflection corresponding to Case 3.2:
a) foot track deck; b) cycle track deck. . . 220
6.21 Evolution of maximum deck rotation corresponding to Case 5.2: a)
foot track deck; b) cycle track deck. . . 221
6.22 Evolution of Safety Margin corresponding to Case 5.2. . . 221
6.23 Time variation of failure probability of footbridge relevant to deck
de-flection: a) comparison between Model #2 outcomes and Eurocode
0 limits; b) comparison between corrosion models. . . 222
6.24 Time variation of failure probability of footbridge relevant to deck
ro-tation: a) comparison between Model #2 outcomes and Eurocode 0
limits; b) comparison between corrosion models. . . 223
6.25 Time variation of failure probability of footbridge relevant to SM: a)
comparison between Model #2 outcomes and Eurocode 0 limits; b)
L
IST OFT
ABLES3.1 Heights of piers of Case Study I. . . 29
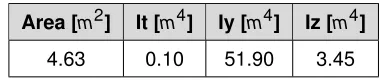
3.2 Geometrical Properties of Case Study I. . . 30
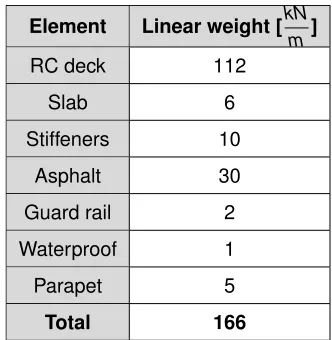
3.3 Dead loads acting on the deck . . . 33
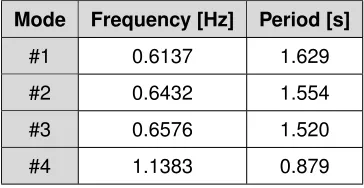
3.4 Frequencies and periods of vibrations of Case Study I . . . 39
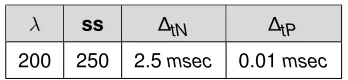
3.5 Parameters adopted during HSs . . . 44
3.6 Scale factors applied to each different quantity . . . 44
3.7 List of actuators and properties. . . 49
3.8 Parameters for the linear reduced model of the pier reduced by the
Guyan method. . . 51
3.9 Nonlinear parameters for the reduced models of the piers identified
by NRMSE. . . 53
3.10 NRMSE for standalone S-DoF piers and PMCSI. . . 54
3.11 NRMSE for NLGRM and PMCSI . . . 56
3.12 NRMSEs for NLGRM and PMCSI . . . 59
3.13 Testing program of hybrid tests . . . 66
3.14 Summary of LVDTs considered during FE improvement process . . 73
3.15 Initial parameters identified. . . 76
3.16 Geometrical Properties of Pier #11 implemented in the stick models. 77
3.17 Results of Model #1 during validation and calibration phases. . . 79
3.18 Results of Model #2 during validation and calibration phases- . . . . 79
3.19 Comparisons of Model #3 during validation and calibration phases. . 89
3.20 Comparisons of Model #3 during validation phase. . . 91
4.1 Geometrical properties of the cross sections . . . 101
4.3 Parameters for the linear reduced model of the pier by the Guyan
method . . . 114
4.4 Nonlinear parameters for the reduced models of the pier identified
by NRMSE . . . 114
4.5 Characterization tests on CSBs performed at the EUCENTRE TREES
Laboratory. . . 116
4.6 Testing program. . . 123
4.7 Values of the trilinear approximation of moment rotation law of SPB. 127
4.8 Results of improvement procedure relevant to Model#2. . . 130
4.9 Results of improvement procedure relevant to Model#2. . . 130
5.1 Materials properties of Case Study III. . . 139
5.2 Dead loads acting on the Case Study III. . . 141
5.3 Geometrical properties of the elastic sections implemented in
SMC-SIII. . . 144
5.4 LRB Properties. . . 144
5.5 Periods of vibration of the non isolated and isolated SMCSIII. . . 145
5.6 Scale factors applied to each quantity. . . 154
5.7 Testing program of the tests performed at the University of Trento. . 155
5.8 Mechanical properties of steel and concrete. . . 156
5.9 Forces and displacements in the scale of specimen of each test at
collapse. . . 159
5.10 Parameters identified to represent the flexibility of the setup. . . 162
5.11 Main components of the component-based mechanical model. . . . 167
5.12 Results of component-based mechanical model during validation
phase . . . 178
5.13 Forces and displacements of experimental tests at substructure failure.182
5.14 Selected edps for pier and concrete slab . . . 186
5.15 Estimated parameters and statistical tests of edps fragility curves. . 187
5.16 G(edp) in 50 years of reference life . . . 187
6.1 Characteristics of dampers. . . 194
6.3 Dimensions of the cycle track deck elements. . . 202
6.4 Dimensions of the foot track deck elements. . . 203
6.5 Correlation between the CHS members and the original OS members.204
6.6 Parameters of the two probability distributions. . . 206
6.7 Parameters of the Lognormal probability functions vs. time for wind
loading. . . 208
6.8 Average corrosion rates for base and weld metal of TS590LH and
S355LH. . . 212
6.9 Load cases for the probabilistic analysis. . . 216
6.10 Types of probability density functions selected for the maximum
like-lihood estimation. . . 217
6.11 Probability of failure and Cornell β index for SLS (after EN1990-2
C
HAPTER1
INTRODUCTION
1.1 Seismic performance analysis of bridges
A complete seismic performance analysis of bridges with isolation devices
re-quires a demanding procedure that involves several steps moving from
assump-tions to predicassump-tions passing through analysis and experimental verificaassump-tions. These
phases can be summarized in the four steps of the Advanced Procedure for the
Seismic Performance Analysis of Bridges (APSPAB) which are: i) generation of
predictive FE models and selection of seismic input; ii) design and development
of experimental tests; iii)improvement of FE models by means of validation and
calibration procedures; iv) development of advanced probabilistic analyses with
improved FE models. All the steps require the judgment of the engineer for both
prediction and validation tasks. In grater detail, step i is dedicated to the
numer-ical modelling for the prediction of structural behavior. This phase is important to
localize the structure in terms of static and dynamic behavior, in purpose to design
experimental tests and to propose the best seismic isolation typology. In fact, the
choice of the proper device is strictly related to structure properties such as
vibra-tion periods, modal shapes and allowable displacements. The analysis requires
input parameters that during stepi are not yet available, therefore the role of the
engineer becomes essential to make proper assumptions.
During stepii the predictive assumptions are checked by experimental tests. The
most important task of this phase is the choice of the experimental procedure. In
fact, in relation to what the analysis deserves the static or dynamic tests must be
behav-ior, the cyclic tests allow to draw conclusions about collapse mechanisms, damage
evolution and energy dissipation. Conversely if the focus is testing a structure
un-der a certain seismic/dynamic input Hybrid Simulation (HS) is the most suitable
test to be performed. Anyway, during every type of test the most important task,
common to cyclic and HS tests, is the positioning of an adequate number of
in-struments capable of quantifying the local and global unknown behavior of the
structural components.
The interpretation of these experimental data is performed during stepiii. Here in
fact, the predictive numerical models are locally refined with dedicated elements
able to reproduce the actual behavior recorded during the tests. This is probably
the most important step during the SPAB, because allows to perform refined
inves-tigations with reduced, almost erased, approximations on the FE models.
Finally, the extension of the knowledge, obtained through stepiv, can be performed
in different manners. Each one has the unique scope to prove the effectiveness of
the choices made during the previous steps, i.e. i−iii, such as the proposal of a
structural solution and/or a structural intervention. Decisions that if not analyzed
properly and deeply can generate catastrophic events. Furthermore, these
numeri-cal investigations have to include probabilistic aspects to consider the uncertainties
intrinsically present in every structural problem. Currently, the most advanced
tech-niques that allow to take into account all the cited aspects are the innovative PBEE
approach (Krawinkler et al. (2001)) and the consolidated reliability time dependent
analysis (Marsh and Frangopol (2008)).
1.2 Original scientific contributions of the thesis
APSPAB is a complete process adopted to deeply investigate the seismic
re-sponse of bridges, especially when they are really complex and can not be
ana-lyzed through traditional methods. The performed research activity was focused
on four main objectives: i)application of the APSPAB to different complex case
studies;ii)employment of advanced testing techniques to investigate the different
aspects of structural problems;iii)interpretation of experimental data through
re-fined spring based numerical models with the aim to reproduce the actual behavior
advanced probabilistic numerical analysis based on refined FE models able to take
into account the main uncertainties of the problem under investigation.
The need for assessing the seismic performance of an old reinforced concrete
viaduct characterized by portal frame piers and the retrofitting based on CSBs
iso-lators motivated the development of the RETRO Project (Paolacci (2014)).
Char-acterized by a total span of 400 m and plain steel rebars, the Rio Torto Bridge
was under designed if compared with the seismic prescriptions proposed by both
Italian and European codes. The seismic retrofitting was proposed on the base
of the installation of a pair of CSBs devices interposed between the deck and
the cap beam of each pier portal frame. In order to simulate the dynamic
re-sponse of one of the two independent roadways, a comprehensive set of HSs was
designed and performed for both the asbuilt and isolated configurations.
Predic-tive numerical simulations highlighted the hysteretic response of piers already at
Serviceability Limit State (SLS) (Paolacci and Giannini (2012)). For this reason,
nonlinear Numerical Substructures (NSs) were deemed necessary to be coupled
with the two PSs, i.e. two portal frame pier, and to conduct realistic HSs. As a
result, HSs of the Rio Torto Bridge were successfully implemented at the ELSA
Laboratory of the Joint Research Centre of Ispra (VA), Italy. The PM method
(Pe-gon and Ma(Pe-gonette (2002)), which embeds subcycling capabilities, allowed for the
implementation of the continuous Pseudo Dynamic Test (PDT) method. In order to
simulate the degradation of physical and numerical piers a recursive offline model
updating of PSs and NSs has been adopted. In addition, thanks to the copious
instruments positioned on Pier #11 the degradation due to plane steel rebars has
been quantified by means of two FE ABAQUS (SIMULIA (2011)) models enhanced
by discrete nonlinear springs.
The novelties in the field of structural dynamic analysis introduced by the RETRO
Project showed that complex systems can be tested by HS technique. In light of
this additional HSs tests were performed at EUCENTRE Tress Laboratory located
in Pavia (PV). The HSs based experimental campaign was dedicated to improve
some still open tasks. First of all, since the variation of friction is one of the most
important uncertainties in the design CSBs system the opportunity to have a
proto-type of CSB with asymptotic relation between friction coefficient and load rate was
tested. Then, in order to reduce the approximations due to unchanging NSs, an
innovative online model updating based on Unscented Kalman Filter (UKF) (Julier
et al. (1995)) was implemented to improve the initial offline method adopted for the
Rio Torto viaduct and to consider step by step the effects of piers degradation on
the rest of the bridge. The novel updating method has been implemented thanks
to a novel partitioned time integrator tailored for first order systems (Abbiati et al.
(2014)) and allowed for updating the NSs parameters during each test on the base
of the instantaneous response of the PSs.
Another still open task in bridge engineering is related to the optimization of costs
which can be solved by the introduction of novel solutions and/or the definition of
proper maintenance programs.
For the first solution, the case of functional bridges, which are systematically built
to overtake city planning or transport network problems is the best choice to prove
the effectiveness of a smart and low-cost structural solution. In greater detail, Steel
Concrete Composite Bridges made with Hot rolled I-girders (SCCBHs) with CCB
allow to save money due to several optimal constructional aspects. This solution
was widely used in the non seismic prone areas but there is a lack in knowledge
for the seismic response especially for high seismicity zones. As result, several
cyclic tests were performed at the laboratory of the University of Trento (TN) and
University of Rome TRE (Rome) to analyze the traversal and longitudinal
behav-ior of three novel connections between steel I-girder and CCB when subjected to
strong earthquakes. In addition, due to the innovative feature of the solutions, a
Component-Based Mechanical Model (CMM) has been developed in an Opensees
environment (Mazzoni et al. (2009)) to reproduce the behavior of these joints and
to investigate the effects of these solutions when designed for different types of
bridges. Finally, a part of the PBEE approach (Cornell and Krawinkler (2000)) was
applied to a SCCBH case study in the isolated and non isolated configurations.
This is an absolute novelty in the field of bridge engineering.
For the second solution, based on detailed maintenance programs, the case of
complex steel bridges erected in extreme environments represents an
pedes-trian loads act on the structure and vary during the service life becoming generally
more severe. These multi-inputs effects need to be considered to define a suitable
maintenance program. For these reasons, the ”Ponte del mare” foot/cycle bridge
equipped with viscous dampers was selected as the fourth case study. In greater
detail, it has been analyzed numerically by a reliability time dependent analysis
performed in a ANSYS (2007) environment, in which the numerical simulations
have been performed through Monte Carlo Simulations (MCSs) enhanced by Latin
Hypercube Sampling (LHS) (McKay et al. (1979)).
1.3 Structure of the thesis
This Ph.D. thesis summarizes research activities performed by the author which
were focused on the analysis of the seismic performance of bridges by means of
the development of advanced methodological approaches to take the maximum
advantage from experimental tests and to develop optimal numerical FE models.
The remainder of the thesis is divided in five chapters:
• Chapter 2: The APSPAB adopted for the analysis of different case
stud-ies was summarized and commented. The four steps of analysis were
de-scribed: the initial predictive modelling, the experimental campaign, the
im-provement procedure applied to FE models and the implementation of refined
post-test probabilistic analyses. In greater detail, an effective procedure to
improve, i.e. validate and calibrate, numerical FE models was formulated
and presented.
• Chapter 3: The seismic retrofitting of an old RC viaduct was analyzed within
the Case Study I (CSI). First, the case study was introduced and discussed
for bothasbuiltand isolated configurations. Second, the Opensees Predictive
Model of Case study I (PMCSI) with relevant numerical results was
intro-duced to support the implementation of HSs. Time history analyses
justi-fied the selection of substructuring schemes for both piers and CSBs. In
greater detail, two different reduction techniques were adopted for linear
and nonlinear springs. With regard to the piers the Single Degree of
model (Smyth et al. (1999)), for the CSB isolation devices instead suitable
S-DoF reduced models were tailored according to the state space bilinear
model of Mostaghel (1999). Then, the experimental campaign and the
rele-vant results were presented. In particular, adrele-vantages of DS to solve
exper-imental obstacles and an offline model updating technique were described.
Finally, on the base of experimental data the procedures of validation and
calibration of numerical FE models, considered to investigate the effects of
rebars slip, were presented. Conclusions based on the results were drawn.
• Chapter 4: The seismic assessment of a RC bridge was analyzed within the
Case Study II (CSII). First, the case study was introduced and discussed
for both isolated and non isolated configurations. Second, the Opensees
Predictive Model of Case study II (PMCSII) with relevant numerical results
was introduced to support the implementation of DS in the purpose of HSs.
Substructuring schemes for a RC pier and a prototype of CSB were
de-scribed. Then, the experimental campaign and relevant results were
pre-sented. In particular, advantages of DS to solve experimental obstacles and
an online model updating technique based on UKF were discussed. On
the base of experimental data the procedures of validation and calibration
of a refined Opensees numerical model (Optimized Model of Case study
II (IPMCSII)) were described with the relevant nonlinear time history
simu-lations and comparison with PMCSII. Finally, conclusions were drawn.
• Chapter 5: The seismic assessment of a SCCBH was analyzed within the
Case Study III (CSIII). First, the case study was introduced and discussed
for both isolated and non isolated configurations. Second, the Opensees
Simplified Model of Case Study III (SMCSIII) and Predictive Model of Case
Study III (PMCSIII) with relevant numerical results was introduced to support
the implementation of cyclic tests designed to analyze the seismic response
of novel CCB - steel I- girder connection. Then, the experimental campaign
and relevant results were discussed. In addition, on the base of experimental
data the procedures of validation and calibration of numerical models were
de-veloped to analyze the local behavior of the components acting on the CCB.
Finally, the CMM were used to develop an Opensees Model of CSIII
en-hanced by CMM (CMMCSIII) considered for the development of the hazard
and structural parts of the PBEE approach. Relevant results were presented
and conclusions were drawn.
• Chapter 6: The reliability analysis of a foot/cyclic bridge erected in extreme
environment was analyzed within the Case Study IV (CSIV). First, the case
study was introduced and discussed. Second, the Refined Model of Case
Study IV made with Open Section Members (RMCSIVOS) developed in
AN-SYS environment and optimized on the base of in site experimental
monitor-ing data was introduced and modified to obtain the equivalent Refined Model
of Case Study IV made with Circular Hollow Section Members (RMCSIVCHS)
suitable for the implementation of a reliability multi-input time-dependent
anal-ysis. The procedure adopted involved the analysis of the effects due to
dif-fused and local corrosion, wind and variation of loads during the service life of
the facility. The simulations were conducted by using ANSYS tools coupled
with MATLAB (2012) involving Maximum Likelihood Estimation (MLE) and
MCSs enhanced by LHS. Relevant results were presented and conclusions
were drawn.
• Chapter 7:Conclusions were summarized and outlooks on future
C
HAPTER2
ADVANCED PROCEDURE FOR SESMIC PERFORMANCE
ANALYSIS OF BRIDGES - METHODOLOGY
The scope of the advanced procedure for the seismic performance analysis of
bridges is to provide essential information to describe and predict the behavior of
bridges composed by complex (Chapter 3, 4, 6 ) or novel (Chapter 5) structural
details. The objective can not be reached without passing through the
experimen-tal data obtained frominsiteinvestigations or experimental tests. Furthermore, in
order to have the maximum gain from these important and costly information they
need to be analyzed and reproduced numerically by means of refined FE models.
In greater detail, to reach the required target of reproducibility and prediction the
SPAB procedure needs 4 steps: i) generation of predictive FE models and
se-lection of seismic input; ii)design and development of experimental tests;iii)
im-provement of FE models by means of validation and calibration procedures; iiii)
development of advanced probabilistic analyses with improved FE models. In the
thesis these four steps have been developed differently in each case study.
Here-inafter a general description about the methodology adopted, all the details about
the different implementations and improvements considered during the analysis of
each case study are described in the dedicated Chapters.
2.1 Step I - Generation of predictive FE models and selection of seismic
input
The numerical prediction is crucial to collocate the bridge in the domain of
Generally, during this phase, material properties and geometry are defined on the
base of design information and/or mechanical characterization tests. For these
reasons they are modified and improved during step III on the base of updated
information coming from investigations.
In greater detail, the predictive modeling is used at both global and local scale.
When dedicated to global scale, it allows to identify static and dynamic properties
such as deflections or fundamental periods of structures. In local scale instead, it
is important to quantify roughly local nonlinearties and collapse mechanism, which
are essential requirements to design the experimental campaign and to choose
the proper substructure to test. Furthermore, the prediction is important to check
the limits of experimental facilities and hence to choose the best scale factor to be
applied to the specimen. Finally, as shown in Chapters 3 and 4, when HSs tests
are performed, the predictive modelling becomes important also to set the NSs.
The selection of seismic input is an important task and it is strictly influenced by the
uncertainties related to earthquake features. Each different case requires different
considerations on the selection, in this thesis different approaches were used.
2.2 Step II - Design and development of experimental tests
The second step is dedicated to experimental tests. During the thesis, among
the well-known mechanical characterization tests, other two types of tests have
been used:i)HSs based on PDT;ii) Quasi-Static Cyclic Tests (QSCTs).
2.2.1 Hybrid simulations based on pseudo dynamic test
This typology allows to test the Physical Substructure (PS) taking into account
the effects of dynamic loads due to inertia and damping. It is important when a
particular structure has to be tested in a certain condition of input and
compo-nents configuration. In greater detail, Hybrid Simulation with Dynamic
Substructur-ing (HSDS) is an experimental techniques in which the overall dynamic response
of a structure is evaluated merging the experimental response of one or more PSs,
which are the most critical parts, with the numerical response of NSs. As written
in the name, hybrid means that there is a numerical part and a physical part
thanks to advantages produced by DS. When two or more substructures are
cou-pled two conditions need to be satisfied in the linked Degrees-of-Freedom (DoFs):
i)compatibility of kinematic quantities andii)equilibrium of forces. A numerical
en-vironment solves the NSs and the time integration of coupled equations of motion
advances whilst the condition of coupling are reproduced by the actuators. As a
result, dynamics of both NSs and PSs are accurately reproduced, as well as their
interactions. If the structural components response is rate independent, HSDS
can be conducted at extended time scales, typically 50−200times slower than the
actual seismic input. Accordingly, inertial and damping components of restoring
forces are numerically evaluated and simulated. Conversely, when rate dependent
effects are significant, i.e. when CSB are part of PSs, a Real-time Testing (RT)
strategy should be selected to obtain reliable simulations. If RT procedure are not
available DS allows to overcome rate dependent problems by means of numerical
compensation actions. As a result, costs and efforts required to conduct a shaking
table test on the entire system are significantly reduced. This type of test has been
used to analyze CSI and CSII with different features. In detail, relevant limitations
and advantages are described in Chapters 3 and 4.
2.2.2 Quasi static cyclic tests
The second testing procedure is more general and provides information about
all the response domain, i.e. from elastic to collapse, without direct relation with
a seismic input. Since this procedure is general and uncorrelated from specific
seismic input consequently there is an open discussion between researchers about
the best loading protocol to be adopted to reach the collapse. As summarized in
Hutchinson et al. (2011) several loading protocols have been proposed in the last
years:
• ECCS loading protocol: European Convention for Structural Steelwork ECCS
(1986) proposed a loading protocol calibrated for steel and steel concrete
structures, in which nonlinear effects are significative. It is based on the
def-inition of a yielding displacement based on a monotonic testey. The cycles
• ATC-24 loading protocol: Applied Technology Council 24 (Applied
Tech-nology Council (ATC) (1992)) introduced a loading protocol for low cycles
experimentation extended to allow the evaluation of damage developed
in-side the specimen. The aim is to take the maximum advantage from cycles
using, if available, the damage information achieved from other specimens.
• CUREE loading protocol: CUREE-Caltech wood frame project (Krawinkler
et al. (2001)) developed a loading protocol intended to model demands on
wood structures associated with ground motions typical of most far field sites.
The protocol is characterized by a symmetric pattern of ith interval cycles
followed by a number of (i+ 1)th interval cycles that are equal to 75 % of
the previous ith interval cycles. The decrease in cycles number per each
amplitude with increasing deformation demand is caused by the observation
that earthquakes impose few strong cycles then the period of the system
elongates due to nonlinear behavior.
• ISO loading protocol: developed by the International Organization for
Stan-dardization (ISO) (2003) provides a loading protocol with the application to
wood structures. Its intent is to produce data that sufficiently describes the
elastic and inelastic properties, and representative demands imposed by
earthquakes on structures. This general protocol is used for structural and
nonstructural components.
• FEMA 461 loading protocol: proposed by Federal Emergency Management
Agency (FEMA) (2006) is characterized by increasing amplitude, reversed
cyclic displacement controlled loading. Two cycles per amplitude are
uni-formly applied to the specimen to represent accumulation of damage. The
FEMA 461 loading protocol has been designed for application to drift
sensi-tive nonstructural components.
• AISC loading protocol: suggested by American Institute of Steel
Construc-tion (AISC) (2002), its features are similar to the ISO and FEMA 461 loading
protocols, with the addition of small amplitude initial cycles, and a reduction
• Hutchinson loading protocol: suggested by Hutchinson et al. (2011), the
protocol is based on cycle counting and forward ordering of interstory drift
time histories for representative mid and low rise building structures. The
proposed drift protocols involve:i)selection and scaling of the ground motion;
ii)selection of the representative structure and modelling; iii)calculation of
the nonlinear structural dynamic response; andiv) derivation of amplitude
and counting information.
It is evident as the loading protocol is important in the structural response, for
this reason each time a Quasi-Static Cyclic Test (QSCT) is performed it has to be
properly designed. This type of test has been adopted to analyze CSIII and the
implementation is described in Chapter 5.
2.3 Step III - Improvement of FE models by means of validation and
cali-bration procedures
The third step is the most important to replicate the experimental results and to
spread the achieved knowledge. Here, the initial predictive numerical FE models
are checked and improved by means of validation and calibration procedures. In
greater detail, Trucano et al. (2006) define validation and calibration as follow:
• Validation: procedure to quantify the confidence in the predictive capability
of a model through comparison of calculations with a set of benchmark data.
It imply correctness of physics and for this reason it is strictly related with
engineers, physicists and chemists knowledge and judgment;
• Calibration: procedure to adjust a set of input parameters associated with
some calculations so that the resulting agreement of the model outcomes
with a chosen and fixed set of benchmark data is maximized.
It is important to underline that calibration is a consequence of validation and they
can not be used independently and separately. The two steps need to coexist
and to interact, hence in the circumstances of poor validation, calibration should
be used cautiously and with a certain pessimism about its effectiveness. Both the
be compared. The benchmark concept is a crucial point because it decides for
the goodness of the model, in general it has to be chosen accurately and can not
be simply associated with some experimental data. In general it is a mix between
experimental data, knowledge of experts and analytical calculations. Often, for civil
engineers the benchmarks are experimental data but sometimes the engineering
judgment is more important.
As described in Trucano et al. (2006), it is possible to write a model as
M(¯i) :I→O (2.1)
where I is the space of the input variable ¯iwhich is usually a subset of m-dimensional
spaceRm, whilst O is the space of outputs. The vector of parameters can be
rewrit-ten as follow:
¯
i= (¯iprimary, ¯isecondary) (2.2)
where the ¯iprimary are the parameters adopted in validation phase that allow the
alignment between the model and the validation benchmarks such as geometry
or materials. This array has to be consistent with the actual input as materials
adopted and characterized by mechanical characterization tests. The secondary
part ¯isecondary is the set of parameters important for the model but useless for the
alignment, these can be modified for the calibration but should remain constant
during validation. In a typical civil engineering problem, the vector ¯i reads:
¯
iprimary = [Materials Constitutive laws,Boundary Conditions, ...] (2.3)
¯i
secondary =[Loading Protocol,Load Steps,
Integration Algorithm,Discretization of domain,
Discrete Springs, ...].
(2.4)
The benchmarks functions can be multiple and different for validation and
calibra-tion due to the specific interest of the engineer. When experimental data have
been chosen as benchmarks and several similar tests were performed, some
un-certainties should be taken into account. In greater detail, there are two types of
some parameters, this one can not be avoided. The second is related with the lack
of knowledge about the quantities or phenomena, this one can be ideally deleted
by the increasing of knowledge. These uncertainties, if quantifiable, should be
con-sidered in all the components of a comparison procedures, i.e. benchmarks and
calculation values.
The benchmarks function have to be consistent with the alignment parameters and
can be write as:
BjVal(¯iprimary) = [SigmaConcrete−εConcrete, ...] (2.5)
BjCal(¯iprimary) = [Force−Displacement response, ...] (2.6)
as can be appreciated, the index j represent the possibility to have more
bench-marks for validation and calibration. For example benchmark functions can be
a concrete constitutive law and the experimental force-displacement for
valida-tion and calibravalida-tion, respectively. In general, benchmarks funcvalida-tions for validavalida-tion
should include materials properties and local mechanisms such as rotations or
local displacements; conversely, calibration benchmarks should include global
be-haviors such as global force-displacement response, moment-curvature or periods
of vibrations. Only representative and sensible quantities should be considered,
e.g.quantities that influence and modify considerably the model output. As an
ex-ample, if the model dose not exhibit nonlinear behavior or steel component, the
yielding stress should not be considered as a benchmark. This choice would spoil
the validation and calibration error.
Once introduced these quantities the next step is the comparison, it is performed
by the definition of an error function to compare output and benchmarks, it reads:
DVal[M(¯iprimary, ¯isecondary),BVal(¯iprimary)] (2.7)
DCal[M(¯iprimary, ¯isecondary),BCal(¯iprimary)] (2.8)
respectively for validation and calibration. The formulation can be generalized for
multiple benchmarks functions and alignments parameters as follow:
DCal,k ≡D[M(¯iprimary,k, ¯isecondary,i),BCal,k(¯iprimary)],k = 1, ...,n (2.10) When multiple benchmarks and alignment parameters are used, the total error can
be written as a mean error distributed on all the set of D functions, as follows:
DTotVal=
Pn
k=1wkVal·DVal,k
n (2.11)
DTotCal=
Pn
k=1wkCal·DCal,k
n (2.12)
wherewkVal andwkCal represents the weights that can be applied to the different
errors for validation and calibration, respectively. The optimum point between these
quantities represents the best fitting and hence the optimal model. To be consistent
with the model, the parameters have to be varied in the range of uncertainties
giving the priority in decreasing the validation error. The total error vector used to
quantify the global difference between the model and the benchmark functions can
be write as follow:
ErrTot = [DTotVal;DTotCal] (2.13)
that define the distance between the model and the idealPerfect Model.
As an examples, in Figure 2.1 are shown two models in the domain of errors.
In detail, Model #1 represents a model with a good validation but a bad
calibra-tion, Model #2 the opposite and Model #3 instead represents a model that can be
considered an optimal model since it is portrayed by good validation and good
cal-ibration simultaneously.
Finally, once evaluated this quantity the last part consists in the check of the
model’s credibility, to do this Trucano et al. (2006) proposes to apply this
proce-dure based on Boolean check:
1. Chose a diffused quantity to be compared;
2. compute thel1[0, 1]norm of the difference between the model and the
bench-mark as follow:
D[M(¯i),B(¯i)] =||ρmodel−ρref ||
0
0.2
0.4
0.6
0.8
1
0
0.2
0.4
0.6
0.8
1
D
TotCal
D
Tot Val
PERFECT MODEL
Model #1
Model #2
Model #3
Figure 2.1: Domain of models errorErrTot
3. define a limitε;
4. the credibility of the model is verified if:
CModel ≡||ρmodel−ρref ||
l1 [0, 1]< ε (2.15)
otherwise the model is judged not credible.
In light of this, in the thesis was used a modelling procedure based on discrete
springs. The modelling called here Springs Based Modelling (SBM) is based on
the implementation of nonlinear discrete springs in crucial points of the structure
and tailor their constitutive laws on the experimental outcomes. The SBM approach
improves the effectiveness of the FE models and it allows to decrease the total
error thanks to the good reproduction of the alignment parameters ¯iprimary.
Finally, the procedure can be summarized:
• Phase 1Definition of alignment parameters ¯i, i.e. input of the Model;
• Phase 3Selection ofk−thValidation maximum errorDMaxVal,k; • Phase 4Selection of Calibration benchmarksBiCal;
• Phase 5Selection ofk−thCalibration maximum errorDCal,k Max ;
• Phase 6[Validation Phase] Modification of input parameters to decrease
validation error [DTotVal];
• Phase 7[Calibration Phase] Modification of input parameters to decrease
validation error [DTotCal];
• Phase 8 Definition of the maximum acceptable global error of the model
ETotMax;
• Phase 10Check the goodness of the final model by means of the
classifica-tion asbelievable modelorunbelievable model(that demand further
improve-ments).
In the thesis this procedure is applied in CSI, CSII and CSIII to improve the FE
models adopted to develop the step IV of APSPAB.
2.4 Step IV - Development of advanced probabilistic analysis with
im-proved FE models
The last step is dedicated to the numerical investigations performed with the
improved FE models based on the obtained outcomes. In greater detail, in the
thesis, among the general FE numerical simulations two types of advanced
prob-abilistic analyses have been implemented: i)PBEE framework; ii) reliability time
dependent analy