O R I G I N A L A R T I C L E
Open Access
Spatial correlations between MRI-derived
wall shear stress and vessel wall thickness
in the carotid bifurcation
Pim van Ooij
1*, Merih Cibis
2, Ethan M. Rowland
3, Meike W. Vernooij
4,5, Aad van der Lugt
4, Peter D. Weinberg
3,
Jolanda J. Wentzel
2and Aart J. Nederveen
1Abstract
Background:To explore the possibility of creating three-dimensional (3D) estimation models for patient-specific wall thickness (WT) maps using patient-specific and cohort-averaged WT, wall shear stress (WSS), and vessel diameter maps in asymptomatic atherosclerotic carotid bifurcations.
Methods:Twenty subjects (aged 75 ± 6 years [mean ± standard deviation], eight women) underwent a 1.5-T MRI examination. Non-gated 3D phase-contrast gradient-echo images and proton density-weighted echo-planar images were retrospectively assessed for WSS, diameter estimation, and WT measurements. Spearman’s ρ and scatter plots were used to determine correlations between individual WT, WSS, and diameter maps. A bootstrapping technique was used to determine correlations between 3D cohort-averaged WT, WSS, and diameter maps. Linear regression between the cohort-averaged WT, WSS, and diameter maps was used to predict individual 3D WT.
Results:Spearman’sρaveraged over the subjects was−0.24 ± 0.18 (p< 0.001) and 0.07 ± 0.28 (p= 0.413) for WT versus WSS and for WT versus diameter relations, respectively. Cohort-averagedρ, averaged over 1000 bootstraps, was−0.56 (95% confidence interval [−0.74,−0.38]) for WT versus WSS and 0.23 (95% confidence interval [−0.06, 0.52]) for WT versus diameter. Scatter plots did not reveal relationships between individual WT and WSS or between WT and diameter data. Linear relationships between these parameters became apparent after averaging over the cohort. Spearman’sρbetween the original and predicted WT maps was 0.21 ± 0.22 (p< 0.001).
Conclusions:With a combination of bootstrapping and cohort-averaging methods, 3D WT maps can be predicted from the individual 3D WSS and diameter maps. The methodology may help to elucidate pathological processes involving WSS in carotid atherosclerosis.
Keywords:Atherosclerosis, Carotid artery, Mechanical stress, Wall thickness
Key points
3D cohort-averaging elucidates spatial correlations between wall shear stress and wall thickness in the carotid bifurcation
Regression parameters based on cohort-averaged maps can predict individual wall thickness in 3D
Individual estimation models could help tailor early management of atherosclerosis
Background
Ischemic stroke occurs when an artery becomes occluded, leading to death of brain tissue [1]. Such an occlusion commonly occurs after rupture of an atherosclerotic lesion. Atherosclerotic plaques predominantly form at predilection sites with disturbed blood flow, such as arter-ial bifurcations [2]. The carotid bifurcation, particularly the lateral wall of the internal carotid artery (ICA), is a
* Correspondence:[email protected]
1Department of Radiology & Nuclear Medicine, Amsterdam UMC, University
of Amsterdam, Amsterdam, The Netherlands
Full list of author information is available at the end of the article
region prone to early atherosclerotic lesion formation, characterized by vessel wall thickening.
Wall shear stress (WSS) is the tangential friction force exerted by blood flow on the endothelial cells and is a known mediator of vessel calibre and endothelial func-tion [3]. It is implicated in the development of athero-sclerosis. For example, WSS is low at the lateral wall of the ICA [4], which may explain the predilection for dis-ease in this region. It is important to measure WSS for the investigation of atherosclerotic processes [5]. If the relationship between WSS and vessel wall thickening is clarified further, the wall thickness (WT) can potentially be predicted from WSS patterns. Such an estimation has the potential to be clinically relevant in the management of atherosclerotic disease. For example, patients with ab-normally low WSS can be monitored more closely to evaluate thickening of the wall and further disease pro-gression and eventually facilitate timely treatment.
Three-dimensional (3D) phase-contrast magnetic reson-ance imaging (MRI) with velocity encoding in the three principal directions permits the estimation of WSS in the carotid bifurcation in vivo [6]. Advances in algorithms to es-timate WSS from phase-contrast MRI data now allow the acquisition of full 3D WSS profiles along the entire bifur-cation [7–10]. Recently, a method was introduced to create 3D maps that represent the average WSS of a certain cohort [11]. This technique enables local statistical comparisons to elucidate pathological processes involving 3D WSS [12].
WT may be affected by factors other than atheroscler-osis; in particular, it is known that healthy arterial walls are dimensioned according to the law of Laplace [13], which states that tension in the wall increases with vessel diameter, resulting in increased WT [14]. Consequently, WT may correlate with WSS because both are independ-ently determined by vessel diameter. For this reason, vessel diameter was also characterized and investigated. The relationships between variables were investigated by statistical comparison of maps, taking spatial autocorrel-ation into account [15].
The aim of this study was to explore the possibility of creating 3D estimation models for patient-specific WT maps using cohort-averaged WT, WSS and vessel diam-eter maps in asymptomatic atherosclerotic carotid bifurca-tions. We hypothesize that the methodology can predict 3D WT maps that are similar to the original WT maps.
Methods
Subject enrolment
Twenty subjects aged 75 ± 6 years (mean ± standard devi-ation, range 55–82 years, eight women) having asymptom-atic plaques in the left carotid artery were retrospectively selected from the Rotterdam Study. The Rotterdam study is a population-based study of subjects aged≥45 years in-vestigating determinants of disease among the elderly
[16]. The local Medical Ethics Committee approved the study and all participants provided informed consent. The study was performed in accordance with the declaration of Helsinki. All subjects underwent a two-dimensional ultrasound examination of the left carotid artery during which it was determined that WT was ≥2.5 mm at least at one location in the carotid artery [17].
MRI protocol
The carotid MRI examination, performed with a 1.5-T scan-ner (Signa Excite II; GE Healthcare, Milwaukee, WI, USA), included non-gated, time-averaged 3D phase-contrast im-aging (field of view 180 × 180 mm2; 40 slices; spatial resolution 0.7 × 0.7 × 1 mm3, echo time 4.3 ms; repetition time 13 ms, velocity encoding 60 cm/s) and proton density-weighted echo planar imaging (field of view 130 × 70 mm2; 51 slices; spatial resolution 0.5 × 0.5 × 1.2 mm3; echo time 24.3 ms; repetition time 12,000 ms). The phase-contrast images were corrected for background phase offsets by subtraction of the velocity in static tissue (the sternocleidomastoid muscle).
MRI post-processing
The vessel lumen and wall were manually segmented in the proton density-weighted echo-planar images using ITK-snap (version 3.2, www.itksnap.org) [18]. The wall was converted to a mesh to enable 3D WT calculations. WT was quantified as the shortest distance between a mesh point and the outer wall (that included the adventi-tia). Rigid co-registration of the proton density-weighted echo-planar images and 3D flow images was performed in Elastix [19] to ensure that identical lumen segmentation was used for calculation of 3D WSS and 3D diameter.
WSS was quantified from the 3D flow images as previ-ously described [8]. To derive the velocity gradient at the wall, smoothing splines were fitted through the ro-tated x- and y-velocity values using three equidistant points along the inward normal. The length of the in-ward normal used for WSS estimation was the radius of the vessel. All maps consisted of the common carotid ar-tery (CCA), the bifurcation, the proximal ICA and the proximal external carotid artery.
To calculate the vessel diameter in 3D, the vascular modelling toolkit VMTK [20] was used to: 1) calculate the centreline of the lumen; 2) calculate the inward distance from the luminal surface to the centreline; and 3) multiply the distance to the centreline (i.e. the radius) by a factor of 2 to yield the diameter on each point of the vessel wall.
Cohort-averaged maps
WT and diameter on the shared geometry over the cohort [11].
Statistical analysis
Spearman’s rank correlation coefficientρwas determined for the correlations between subject-specific WSS and WT, WT and diameter as well as WSS and diameter, using all pixels. A Fisher z-transformation was applied to normalizeρ, enabling a Student’st-test to determine if the z-values averaged across subjects were significantly differ-ent from 0. p values lower than 0.05 were considered significant. Linear regression was performed as well and R2reported. A linearity check was additionally performed.
For the assessment of ρ between the cohort-averaged maps using all pixels, the bootstrapping method was used [15]: the 20 individual WT, WSS and diameter maps were randomly sampled (with replacement) followed by 3D averaging. Such a cohort-averaged map thus contained the map of the same subject multiple times. Random sampling and averaging was repeated 1000 times (i.e. a bootstrap-ping size of 1000 was used). ρ was determined for each combination of randomly sampled and averaged WT and WSS maps (ρWSS−WT), for each combination of WT and
diameter maps (ρWT−D) and for each combination of
WSS and diameter maps (ρWSS−D), using all pixels. For
these combinations,ρwas significant when the 95% confi-dence interval (CI) of theρvalues did not contain 0.
Linear regression for WT estimation based on individual maps
For each subject i, linear regression was performed for all pixels using Eq.1:
WTi¼β0iþβ1iWSSiþβ2iDiþβ3iWSSiDiþεi ð1Þ
where WTi is the 3D WT map, WSSi is the 3D WSS
map and Di is the 3D diameter map. β0i is the
inter-cept and β1i, β2i and β3i are the regression
coeffi-cients; εi is the residual.
The regression coefficients were used to compute the 3D WT map for each subject. The inclusion of
β2i∗Di follows from the law of Laplace. The inclusion
of β3i∗WSSi∗Di follows from the vessel calibre
regu-latory mechanisms of WSS [3, 4].
Linear regression for WT estimation based on cohort-averaged maps
Two linear regression analyses were performed for es-timation of patient-specific 3D WT maps. First, linear regression was performed for all 1000 bootstrapped cohort-averaged WT, WSS and diameter maps using the equation for all pixels:
WTb¼β0bþβ1bWSSbþβ2bDbþβ3b
WSSbDbþεb ð2Þ
where WTb is one bootstrap b of the cohort-averaged 3D WT map, WSSb is one bootstrap b of the cohort-averaged 3D WSS map and Db is one bootstrapb of the cohort-averaged 3D diameter map. β
0b is the intercept
and β
1b, β2b and β3b are the regression coefficients per
bootstrap. ε
b is the residual per bootstrap. Thus, 1000 β
0,β1,β2andβ3coefficients are obtained by solving this
regression equation. The mean and 95% CI of the 1000
β
0,β1,β2andβ3are reported.
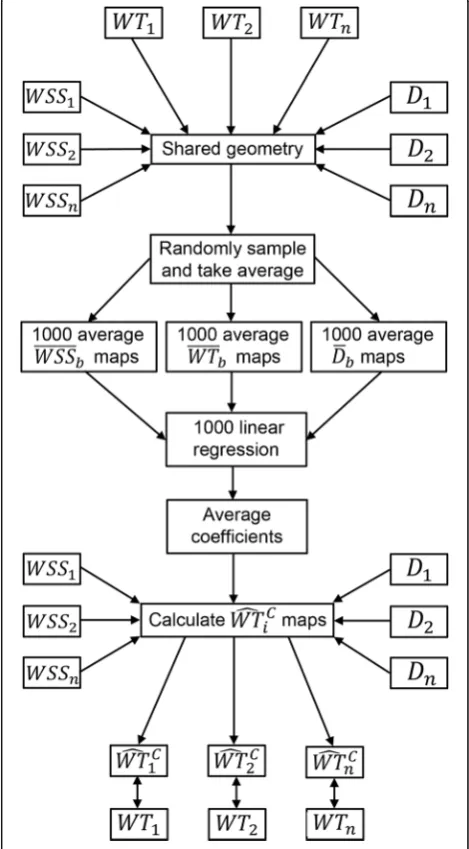
Fig. 1Schematic overview of the workflow for predicting wall thickness maps from cohort-averaged wall shear stress and diameter
Second, the average of the 1000βi(β0, β1 and β2) are
used to predict the individual 3D WT maps from the indi-vidual 3D WSS and diameter maps for all pixels.
An overview of the workflow for predicting WT maps from cohort-averaged WSS and diameter maps is given in Fig.1. To investigate the influence of WSS, diameter and the interaction factor WSS*D separately, the two-step linear regression process is repeated by including only WSS, diameter or the interaction term in Eqs.1to 4.
Comparison between estimated and measured WT maps For the individual and cohort-averaged estimation results, Spearman’sρwas determined using all pixels per subject to quantify the agreement between the estimated and the original WT map. Bland-Altman analysis was performed and the mean difference and limits of agreement averaged over the subjects reported. Furthermore, maximum WT, defined as the average of the top 5% of all values, was quantified for the original and predicted WT maps.
Results
Individual analysis
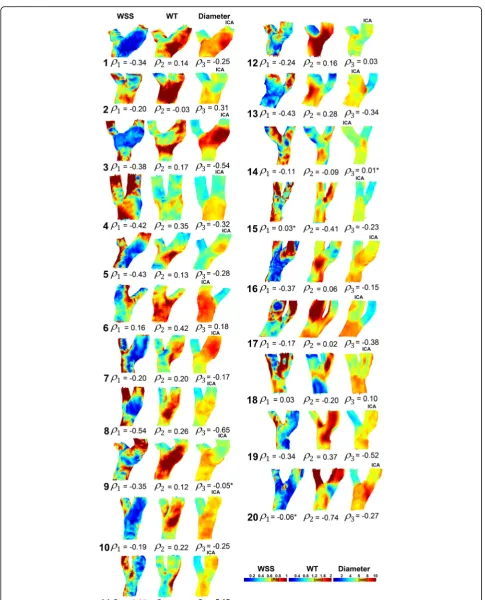
Figure 2 displays the 3D WSS, WT and diameter maps for all subjects. Spearman’sρfor the WSS and WT rela-tionship and for the WT and diameter relarela-tionship is also shown. ρWT−WSS averaged over all subjects was − 0.24 ± 0.18 (p< 0.001).ρWT−Daveraged over the subjects was 0.07 ± 0.28 (p= 0.413). ρWSS−D averaged over all
subjects was−0.20 ± 0.24 (p= 0.002).
Additional file1: Figure S1a and b display, respectively, the scatter plots and linear regression lines for every indi-vidual WT–WSS relationship. Mean R2 was 0.08 ± 0.07. Additional file1: Figure S1c and d display the scatter plots and linear regression lines for every individual WT– diam-eter relationship. Mean R2was 0.09 ± 0.15. Additional file1: Figure S1e, f display the scatter plots and linear regression lines for every individual WSS–diameter relationship. Mean R2 was 0.11 ± 0.12. For most subjects, a negative and positive relationship between WSS and WT and between diameter and WT, respectively, was found. For most subjects, a negative relationship was found between WSS and diameter. This is also displayed in Fig.2.
Cohort-averaged analysis
The means of 1000 bootstrapped cohort-averaged 3D WT, WSS and diameter maps are shown in Fig. 3. Regions of low WSS showed good co-localization with regions of high WT. The mean [95% CI] of ρ for the 1000 WT-WSS relationship was −0.56 [−0.74, −0.38]. Regions of large diameter also showed correspondence with regions of high WT; Spearman’sρwas 0.23 [−0.06, 0.52]; however, this 95% CI contained 0, thus implying lack of significance. Regions of low WSS showed good
co-localization with regions of large diameter as well (Spearman’sρ−0.32 [−0.51,−0.14]).
Scatter plots with the linear regression line are dis-played for the relationship between the mean of the 1000 bootstraps for WSS and WT, for diameter and WT and for WSS and diameter are shown in Additional file1: Figure S2a, b, and c, respectively. R2for these regression curves was 0.50, 0.06, and 0.12, respectively. The linear model was appropriate for all three regressions. Com-pared to Additional file1: Figure S1, the variance in the data is small for all relationships (the same axis ranges have been used to facilitate comparison.)
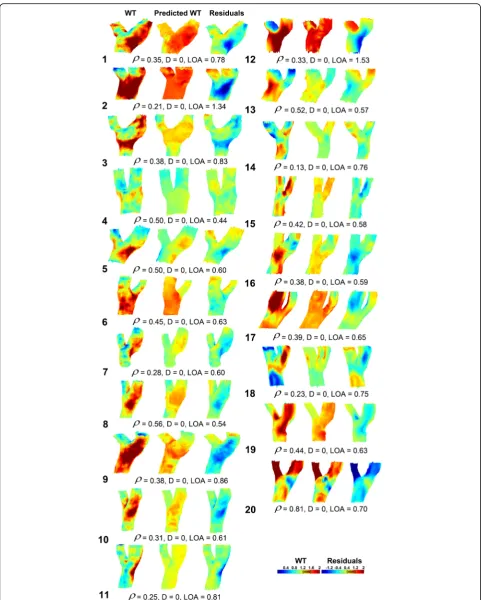
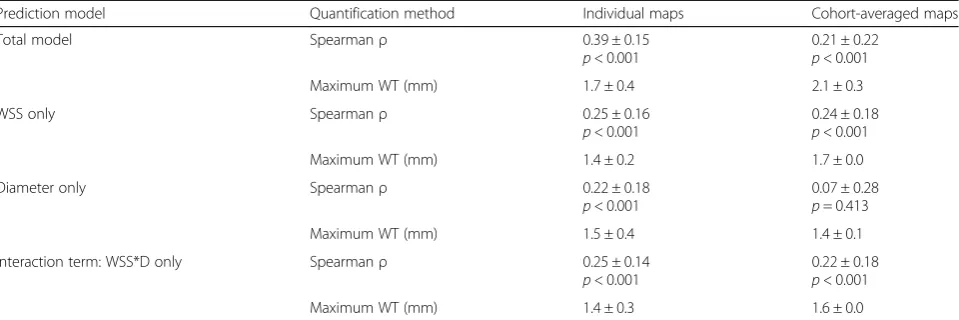
Predicted WT maps based on the individual maps Figure4displays the measured 3D WT maps and the pre-dicted 3D WT maps for all subjects, created with the indi-vidual regression coefficients. The mean difference and limits of agreement were 0.00 ± 0.00 and 0.74 ± 0.26 mm, respectively. In Table 1, ρ between the original and pre-dicted WT and the maximum WT is given for the total model, for WSS only, diameter only and the interaction term WSS*D. The total model predicted WT best.
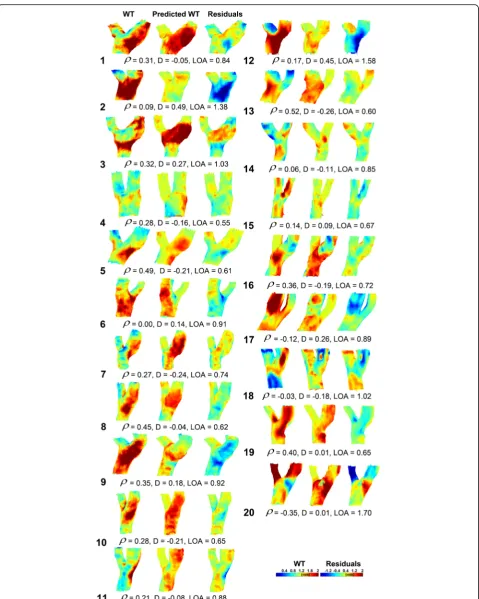
Predicted WT maps based on the cohort-averaged maps Figure 5 displays the measured 3D WT maps and the predicted WT maps for all subjects, created with the cohort-averaged regression coefficients averaged over all bootstraps. Three subjects had a negative ρ. For these subjects the estimation of WT was poor. The mean dif-ference and limits of agreement were−0.02 ± 0.23 and 0.89 ± 0.32 mm, respectively.
In Table 1, ρ between the original and predicted WT and the maximum WT is given for the total model, for WSS only, diameter only and the interaction term WSS*D. The WSS-only model predicted WT best in terms of ρ, whereas the total model predicted WT best based on maximum WT. Note that maximum WT for the total model based on the cohort-averaged maps was
higher than estimation based on the individual maps. This is also apparent from Figs.4and5.
Discussion
This study provides a novel framework for investigating the relationship in a 3D manner between WSS, WT and vessel diameter. The work was based on advanced cohort averaging and statistical methods of data from the carotid bifurcation of patients with asymptomatic atherosclerosis, and it took account of spatial autocorrelation [21].
The main findings of this study were fourfold: 1) creat-ing cohort-average maps of WSS, WT and diameter is feasible in the carotid bifurcation; 2) the relationship between WT and WSS was significant on an individual level and for the averaged maps; 3) WT did not correlate with diameter; 4) cohort-averaged WT and WSS maps can partially predict individual WT maps based on individual WSS and diameter maps.
Previous studies have also found correlations between WSS and WT in the CCA [22,23]. Carallo et al. [14] com-pared WT with WSS derived from ultrasound measurements and with wall tension (blood pressure * diameter). A multiple regression analysis including WSS and wall tension as independent variables and WT as the dependent variable showed that WSS was the only inde-pendent variable and strongly associated with WT, whereas wall tension correlated only weakly with WT. In our study, blood pressure values were not available. Nonetheless, this finding supports our result that diameter had a smaller ef-fect than WSS on WT. Indeed, our data support the notion of Carallo et al. that the relationship between wall tension and early atherosclerotic lesions is mediated by low WSS.
Steinman et al. [24] recognized that 3D maps of WSS, in-cluding the bifurcation, are helpful to investigate the aeti-ology and progression of carotid atherosclerosis. They performed MRI-based computational fluid dynamics
calculation and found a qualitative agreement between low WSS and increased WT. They showed a scatter plot of WSS against WT in an individual with early, asymptomatic carotid artery disease. This graph looked very similar to our scatter plots. They concluded that no obvious relationship is apparent from such scatter plots. We demonstrated that such a relationship will become more evident when a scat-ter plot is created from cohort-averaged WSS and WT data. Thus, the correlation coefficients between cohort-averaged WT and WSS are suitable for estimating individual WT maps. Note that the proposed methodology is perfectly suitable for use on computational fluid dynamics data as well.
Augst et al. [25] used ultrasound for WT measure-ments and they performed computational fluid dynamics calculation to derive WSS in the CCA and in the carotid bifurcation. They found a significant negative correlation between WSS and WT in the CCA, but, contrary to our findings, not at the level of the carotid bifurcation. A possible explanation is the inclusion of 14 healthy con-trols, with low intima-media thickness (0.4–0.8 mm), whereas we included subjects with plaque and a WT range of 0.5–3 mm.
A limitation of our study is the absence of the temporal dimension in the phase-contrast MRI measurements. The consensus hemodynamic theory for explaining the localization of atherosclerosis combines low WSS and a high oscillatory shear index (OSI) [26]. There is evidence in mice that low WSS produces vulnerable plaques, whereas high OSI induces stable lesions [27]. Markl et al. [6] mea-sured OSI in two-dimensional slices placed perpendicular to the carotid using four-dimensional phase-contrast MRI and showed that a fraction of the carotid bulb was exposed to high OSI. Thus, with inclusion of cardiac gating in the phase-contrast MRI exam and in combination with novel techniques to produce motion-resolved segmentation [28],
Table 1Spearman’sρand maximum WT for the agreement between the predicted WT maps and the original WT maps based the individual maps on the cohort-averaged maps
Prediction model Quantification method Individual maps Cohort-averaged maps
Total model Spearmanρ 0.39 ± 0.15
p< 0.001
0.21 ± 0.22
p< 0.001
Maximum WT (mm) 1.7 ± 0.4 2.1 ± 0.3
WSS only Spearmanρ 0.25 ± 0.16
p< 0.001
0.24 ± 0.18
p< 0.001
Maximum WT (mm) 1.4 ± 0.2 1.7 ± 0.0
Diameter only Spearmanρ 0.22 ± 0.18
p< 0.001
0.07 ± 0.28
p= 0.413
Maximum WT (mm) 1.5 ± 0.4 1.4 ± 0.1
Interaction term: WSS*D only Spearmanρ 0.25 ± 0.14
p< 0.001
0.22 ± 0.18
p< 0.001
Maximum WT (mm) 1.4 ± 0.3 1.6 ± 0.0
both four-dimensional WSS and 3D OSI maps can be derived in the future.
Another limitation is that we did not have a sufficient number of subjects to create a “train” and“test”cohort. Here we aimed to demonstrate the feasibility of the technique for creating predictive models. In future studies we will test the methodology more rigorously.
In this initial study, no follow-up data were available. Lon-gitudinal monitoring of combined carotid WSS and OSI may provide more insight into the initiation, growth, and rupture of carotid plaques. We plan to create a framework that is able to predict carotid WT based on WSS estima-tions and other risk factors in daily clinical practice, with the aims of detecting carotid atherosclerosis early and providing disease management tailored to the individual patient.
If consensus is reached in the community about wall thickening occurring in regions of low WSS, we may be able to detect atherosclerosis at a very early stage, even before wall thickening occurs. Early detection will facili-tate patient management and could reduce healthcare costs. For example, with the combined assessment of WSS and other risk factors such as age, smoking and cholesterol status, the patient’s 3D WT map could be predicted and compared to other WT maps created using similar subjects, with known clinical outcome. Thus, a risk profile for the patient could be created with the techniques described in this paper. A risk profile would allow for early initiation of medical therapies, dietary advice or exercise strategies. With more patient characteristics available, the prediction model can be advanced into more complex statistical models [29].
In conclusion, 3D statistical methods, incorporating cor-rections for spatial autocorrelation, were applied to predict 3D individual WT maps using cohort-averaged 3D WSS and diameter maps. With the inclusion and careful categorization of more subjects, the predictive value of WSS for wall thickening is likely to improve, enabling early detection of atherosclerosis with the purpose of bet-ter patient management. The methodology presented may help to elucidate the pathological process between hemodynamic forces and wall thickening in carotid ath-erosclerosis and ultimately prove useful for the diagnosis of plaque initiation and monitoring of disease progression.
Additional file
Additional file 1:Figure S1. aScatter andblinear regression plots for all subjects for the relationship between 3D WSS and 3D WT.cScatter and dlinear regression plots for all subjects for the relationship between 3D diameter and 3D WT.eScatter andflinear regression plots for all subjects for the relationship between 3D WSS and 3D diameter.Figure S2. aScatter plot with the linear regression line for the bootstrap-averaged 3D WSS and 3D WT map.bScatter plot with the linear regression line for the bootstrap-averaged 3D WT and 3D diameter map.cScatter plot with the linear
regression line for the bootstrap-averaged 3D WSS and 3D diameter map. The colours indicate the density of the data points. (DOCX 808 kb)
Abbreviations
3D:Three-dimensional; CCA: Common carotid artery; CI: Confidence interval; D: Diameter (in formulas); ICA: Internal carotid artery; OSI: Oscillatory shear index; WSS: Wall shear stress; WT: Wall thickness
Availability of data and materials
The datasets used and/or analysed during the current study are available from the corresponding author on reasonable request.
Funding Not applicable
Acknowledgements Not applicable
Authors’contributions
PvO: conception and design of study, methods development, data analysis and interpretation of data, drafting of manuscript and revision. MC: methods development, data analysis, manuscript revision. ER: design of study, methods development, interpretation of data, manuscript revision. MV: coordination of data collection, interpretation of data, manuscript revision. AvdL: coordination of data collection, manuscript revision. PW: design of study, interpretation of data, manuscript revision. JW: conception and design of study, coordination of data collection, methods development,
interpretation of data, manuscript revision. AN: conception and design of study, methods development, interpretation of data, manuscript revision. All authors read and approved the final manuscript.
Ethics approval and consent to participate
Institutional Review Board approval was obtained. Written informed consent was obtained from all subjects (patients) in this study.
Consent for publication Not applicable.
Competing interests
The authors declare that they have no competing interests.
Publisher’s Note
Springer Nature remains neutral with regard to jurisdictional claims in published maps and institutional affiliations.
Author details
1Department of Radiology & Nuclear Medicine, Amsterdam UMC, University
of Amsterdam, Amsterdam, The Netherlands.2Department of Biomedical
Engineering, Erasmus MC, Rotterdam, the Netherlands.3Departments of
Bioengineering, Imperial College London, London, UK.4Department of
Radiology and Nuclear Medicine, Erasmus MC, Rotterdam, the Netherlands.
5Department of Epidemiology, Erasmus MC, Rotterdam, the Netherlands.
Received: 9 March 2018 Accepted: 29 June 2018
References
1. Prabhakaran S, Ruff I, Bernstein RA (2015) Acute stroke intervention. JAMA 313:1451
2. Weber C, Noels H (2011) Atherosclerosis: current pathogenesis and therapeutic options. Nat Med 17:1410–1422
3. Dolan JM, Kolega J, Meng H (2013) High wall shear stress and spatial gradients in vascular pathology: a review. Ann Biomed Eng 41:1411–1427 4. Malek AM, Alper SL, Izumo S (1999) Hemodynamic shear stress and its role
in atherosclerosis. J Am Med Assoc 282:2035–2042
5. Tarbell JM (2010) Shear stress and the endothelial transport barrier. Cardiovasc Res 87:320–330
7. Papathanasopoulou P, Zhao S, Kohler U et al (2003) MRI measurement of time-resolved wall shear stress vectors in a carotid bifurcation model, and comparison with CFD predictions. J Magn Reson Imaging 17:153–162 8. Potters WV, van Ooij P, Marquering HA et al (2015) Volumetric arterial wall
shear stress calculation based on cine phase contrast MRI. J Magn Reson Imaging 41:505–516
9. Cibis M, Potters WV, Gijsen FJ et al (2014) Wall shear stress calculations based on 3D cine phase contrast MRI and computational fluid dynamics: a comparison study in healthy carotid arteries. NMR Biomed 27:826–834 10. Cibis M, Potters WV, Selwaness M et al (2016) Relation between wall shear
stress and carotid artery wall thickening MRI versus CFD. J Biomech 49:735–741 11. van Ooij P, Potters WV, Nederveen AJ et al (2015) A methodology to detect
abnormal Relative Wall shear stress on the full surface of the thoracic aorta using 4D flow MRI. Magn Res Med Mar 73:1216–1227
12. van Ooij P, Markl M, Collins JD et al (2017) Aortic valve stenosis alters expression of regional aortic wall shear stress: new insights from a 4-dimensional flow magnetic resonance imaging study of 571 subjects. J Am Heart Assoc 6:1–14 13. Lighthill J (1979) The mechanics of the circulation. Oxford University Press,
1978. 527 pp. J Fluid Mech 90:794
14. Carallo C, Irace C, Pujia A et al (1999) Evaluations of common carotid hemodynamic forces. Hypertension 34:217–221
15. Rowland EM, Mohamied Y, Yean Chooi K et al (2015) Comparison of statistical methods for assessing spatial correlations between maps of different arterial properties. J Biomech Eng 137:101003
16. Hofman A, Breteler MMB, van Duijn CM et al (2009) The Rotterdam study: 2010 objectives and design update. Eur J Epidemiol 24:553–572 17. Van Den Bouwhuijsen QJA, Vernooij MW, Hofman A et al (2012)
Determinants of magnetic resonance imaging detected carotid plaque components: the Rotterdam study. Eur Heart J 33:221–229
18. Yushkevich PA, Piven J, Hazlett HC et al (2006) User-guided 3D active contour segmentation of anatomical structures: significantly improved efficiency and reliability. Neuroimage 31:1116–1128
19. Klein S, Staring M, Murphy K et al (2010) Elastix: a toolbox for intensity-based medical image registration. IEEE Trans Med Imaging 29:196–205 20. Antiga L, Piccinelli M, Botti L et al (2008) An image-based modeling
framework for patient-specific computational hemodynamics. Med Biol Eng Comput 46:1097–1112
21. Peiffer V, Sherwin SJ, Weinberg PD (2013) Does low and oscillatory wall shear stress correlate spatially with early atherosclerosis? A systematic review. Cardiovasc Res 99:242–250
22. Gnasso A, Carallo C, Irace C et al (1996) Association between intima-media thickness and wall shear stress in common carotid arteries in healthy male subjects. Circulation 94:3257–3262
23. Duivenvoorden R, Vanbavel E, de Groot E et al (2010) Endothelial shear stress: a critical determinant of arterial remodeling and arterial stiffness in humans--a carotid 3.0-T MRI study. Circ Cardiovasc Imaging 3:578–585 24. Steinman DA, Thomas JB, Ladak HM et al (2002) Reconstruction of carotid
bifurcation hemodynamics and wall thickness using computational fluid dynamics and MRI. Magn Reson Med 47:149–159
25. Augst AD, Ariff B, McG Thom SAG et al (2007) Analysis of complex flow and the relationship between blood pressure, wall shear stress, and intima-media thickness in the human carotid artery. Am J Physiol Heart Circ Physiol 293:H1031–H1037
26. Ku DN, Giddens DP, Zarins CK, Glagov S (1985) Pulsatile flow and
atherosclerosis in the human carotid bifurcation. Positive correlation between plaque location and low oscillating shear stress. Arteriosclerosis 5:293–302 27. Cheng C, Tempel D, van Haperen R et al (2006) Atherosclerotic lesion size
and vulnerability are determined by patterns of fluid shear stress. Circulation 113:2744–2753
28. Bustamante M, Petersson S, Eriksson J et al (2015) Atlas-based analysis of 4D flow CMR: automated vessel segmentation and flow quantification. J Cardiovasc Magn Reson 17:87