O R I G I N A L A R T I C L E
Open Access
Validation of two accelerated 4D flow MRI
sequences at 3 T: a phantom study
Sebastian Ebel
1*, Lisa Hübner
1, Benjamin Köhler
2, Siegfried Kropf
3, Bernhard Preim
2, Bernd Jung
4,
Matthias Grothoff
1†and Matthias Gutberlet
1†Abstract
Background:Four-dimensional (4D) flow magnetic resonance imaging (MRI) sequences with advanced parallel imaging have the potential to reduce scan time with equivalent image quality and accuracy compared with standard two-dimensional (2D) flow MRI. We compared 4D flow to standard 2D flow sequences using a constant and pulsatile flow phantom at 3 T.
Methods:Two accelerated 4D flow sequences (GRAPPA2 andk-t-GRAPPA5) were evaluated regarding the concordance of flow volumes, flow velocities, and reproducibility as well as dependency on measuring plane and velocity encoding (Venc). The calculated flow volumes and peak velocities of the phantom were used as reference standard. Flow analysis was performed using the custom-made software“Bloodline”.
Results:No significant differences in flow volume were found between the 2D, both 4D flow MRI sequences, and the pump reference (p= 0.994) or flow velocities (p= 0.998) in continuous and pulsatile flow. An excellent
correlation (R= 0.99–1.0) with a reference standard and excellent reproducibility of measurements (R= 0.99) was achieved for all sequences. AVencoverestimated by up to two times had no impact on flow measurements. However, misaligned measuring planes led to an increasing underestimation of flow volume and mean velocity in 2D flow accuracy, while both 4D flow measurements were not affected. Scan time was significantly shorter for k-t-GRAPPA5 (1:54 ± 0:01 min, mean ± standard deviation) compared to GRAPPA2 (3:56 ± 0:02 min) (p= 0.002). Conclusions:Both 4D flow sequences demonstrated equal agreement with 2D flow measurements, without impact ofVencoverestimation and plane misalignment. The highly acceleratedk-t-GRAPPA5 sequence yielded results similar to those of GRAPPA2.
Keywords:Four-dimensional (4D) flow, Magnetic resonance imaging, Reproducibility of results, Phantoms (imaging), Pulsatile flow
Key points
Both accelerated 4D flow sequences provided results
not significantly different in comparison with the 2D flow sequence and the pump reference.
Overestimation of velocity encoding did not impact
on 4D flow accuracy
Misaligned acquisition planes did not impact on 4D
flow accuracy
The highly acceleratedk-t-GRAPPA5 sequence
yielded results similar to those of GRAPPA2 in half the time.
Background
Time-resolved three-dimensional (3D) phase-contrast magnetic resonance imaging (MRI) sequences, named four-dimensional (4D) flow sequences, represent an emer-ging technique for noninvasive evaluation of the cardio-vascular system with full coverage of complete vessel
systems such as the thoracic aorta [1, 2]. This technique
gives new insights into physiological and pathophysio-logical flow patterns not currently observable with
con-ventional two-dimensional (2D) flow sequences [3].
* Correspondence:[email protected]
Matthias Grothoff and Matthias Gutberlet contributed equally to this manuscript.
1Department of Diagnostic and Interventional Radiology, University of
Leipzig–Heart Centre, Leipzig Strümpellstrasse 39, 04289 Leipzig, Germany
Full list of author information is available at the end of the article
Similar to conventional 2D flow sequences, 4D flow sequences enables absolute quantification of flow param-eters such as forward and backward flow volumes, flow
velocities, and shunt volumes [4–6]. With 2D flow
se-quences, it is mandatory to perform measurements per-pendicular to the longitudinal axis of any vessel of interest at the time of measurement. Misaligned
mea-surements may lead to inaccurate results [7]. In contrast,
in 4D flow isotropic data in all spatial directions can be obtained, making possible to create 3D reconstructions of every vessel within a given field of view. With these reconstructions, measurements should be independent of angulations. A further technical key setting in MRI flow measurements is a suitable choice of the velocity
encoding (Venc). Overestimation of the velocities within
the vessel can lead to inaccurate results, and
underesti-mation of theVenccan lead to phase wraps (aliasing) [6].
Most 4D flow data acquisitions with common naviga-tor-gated sequences are time-consuming, requiring up
to 25 min [8]. Therefore, recent developments aimed to
shorten the acquisition time by using parallel imaging, advanced respiratory gating, and various strategies of
undersampling [9–12].
At present, there are multiple vendors and research groups working on different strategies to reduce scan time and developing 4D flow sequences. With such a di-versity of sequences, it seems to be difficult to create re-producible and valid datasets for clinical or research purposes and ultimately clinical applications, which un-derlines the importance of validation, evaluation, and
standardisation of these novel sequences [8].
Thus, we planned a study using an MRI-compatible flow phantom in order to (1) compare two accelerated 4D flow sequences—a generalised autocalibrating partially parallel acquisition (GRAPPA) with acceleration factor 2
(GRAPPA2) and a recently introduced k-t-GRAPPA with
acceleration factor 5 (k-t-GRAPPA5)—to a standard 2D
flow sequence and the phantom setting for the accuracy of flow volume and velocity measurements and (2)
eluci-date the impact of differentVencand misalignments of the
measurement plane on 4D flow measurements.
Methods
MRI flow phantom
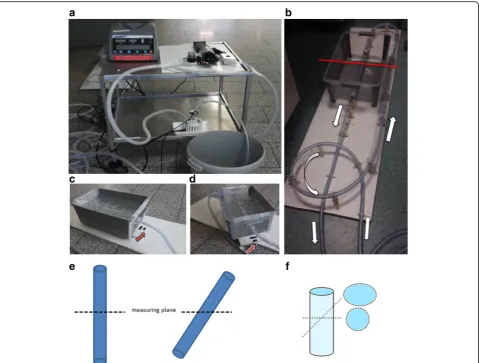
A custom-made flow phantom with a tube diameter of 0.5 in. was used. The straight fabric tube for the flow measurements was placed in a plastic tub filled with
carbopol gel (Fig. 1), as previously described [13]. The
fabric tube was arranged in the form of an open circuit, in which an additional plastic tub was embedded as a
reservoir (see Fig. 1). The reservoir allowed bubble-free
filling of the fabric tube with tap water and bubble-free operation of the open circuit flow phantom. A centrifu-gal blood pump CentriMag® (Thoratec, Pleasanton, CA,
USA) was used to create constant flow. The pump allowed for setting rotational frequencies from 0 to 5,500 rotations per min (rpm). Measurements were per-formed with a rotational frequency between 1,500 and 5,500 rpm, with 500 rpm steps.
The blood pump was not MRI-conditional. Therefore, it had to be placed outside the magnetic field of the scanner. Since the centrifugal blood pump was gauged to blood and used in this experimental setting with tap water only, it was not possible to simply rely on the flow rates given by the user manual on specific rpms. There-fore, we had to perform volumetric measurements of the amount of water pumped through the circuit over a time period of 1 min for each used rpm. This given flow vol-ume was used as the reference standard and to calculate
the mean flow velocities within the tube (termed “pump
reference”) with the following formula:
v¼Q=A
where v = flow velocity [cm/s], Q = flow volume [L/
min];A= cross-sectional area [cm2]
A roller pump of a heart-lung machine (Stöckert S3, Sorin Group, Munich, Germany) was used for pulsatile flow measurements. In the pulsatile flow experiments, 2D flow MRI (the current standard technique) was used as the reference standard. The plastic tub filled with car-bopol containing the fabric tube was placed inside the MRI scanner in the isocentre of the magnetic field.
The carbopol-filled plastic tub could be rotated and therefore allowed misalignment measurements between
0 and 45° in 15° steps (see Figs.1and2).
MR image acquisition
All studies were performed using a 3 T whole-body MRI system (Magnetom Verio Dot, Siemens Healthcare GmbH, Erlangen, Germany). A 16-channel anterior surface coil in combination with a 12-channel spine coil (Siemens Health-care GmbH, Erlangen, Germany) was used.
All flow data were obtained with different Venc (140,
160, 190, 220, 250, 280, and 350 cm/s in all directions,
i.e. 4D) and the through-plane direction (2D). The first
standardised 2D flow MRI acquisitions were performed in the middle of the fabric tube within the carbopol gel. The other sequence parameters were as follows: typical imaging parameters were spatial resolution 2.5 × 2.5 ×
2.5mm3, TR/TE = 2.3 ms/1.8 ms, flip angle = 15°.
The 4D flow data were acquired in a 3D volume cov-ering the whole fabric tube within the carbopol-filled plastic tub. First, data were acquired using standard par-allel imaging (GRAPPA) with undersampling along the
phase encoding (ky) direction with an acceleration factor
2 (GRAPPA2) [14]. Variable imaging parameters, such as
for both 4D flow sequences. Next, k-t-accelerated 4D
flow data (undersampling alongky,kz, andtdimensions)
with an acceleration factor 5 (k-t-GRAPPA5) were
ob-tained as reported by Jung et al. [2,15].
Flow measurements need a time trigger for quantifica-tion purposes. In animals or humans, this triggering is achieved by electrocardiography or pulse triggering. The pulse wave could be used for triggering in our phantom study evaluating the pulsatile flow. Since such a trigger did not exist, in our constant flow phantom measure-ment, we had to use an electrocardiography simulator
[16] (EKG Phantom 320, Müller & Sebastiani Elektronik
GmbH, Munich, Germany), set to a constant high heart rate of 120 beats/min to accelerate the acquisition time.
The first series of measurements was performed with
the flow phantom positioned along thez-direction of the
scanner (0°). Afterwards, we changed the angle to 15°, 30°, and 45°. For the series of measurements with the
angle greater than 0°, two 2D flow acquisitions had to be performed. The first acquisition was performed exactly perpendicular to the longitudinal axis of the fabric tube,
i.e. an optimal “through-plane” flow measurement, with
the second one being in an axial plane with its intersec-tion through the phantom centre of rotaintersec-tion. 4D flow acquisition parameters were kept constant. All
acquisi-tions were carried out twice (see Fig.1for details).
Data analysis
Vessel segmentation, flow visualisation, and preprocessing
All processing and measurement steps were carried out
using the custom-made software toolBloodline [17–19].
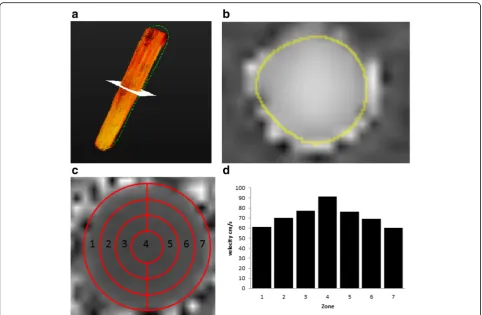
The 3D reconstruction of the phantom was derived from temporal maximum intensity projections (TMIP). A centreline was drawn through the whole phantom semi-automatically beginning at the proximal end of the fabric tube. Flow within the phantom was visualised
using temporal-resolved pathlines (Fig. 2a). We cor-rected for phase wraps, eddy currents, and background noise as reported previously. Eddy current corrections were performed using a technique with background
subtraction [19,20].
Measurements and flow quantifications
Measurements were carried out by two readers (> 4 years of experience in clinical 2D flow measurements). For quantification of the net flow (L/min) and peak velocity (cm/s), all 4D measuring planes were orientated perpen-dicular to the centreline of the phantom.
Statistical analysis
All analyses were performed using MedCalc Statistical Software V15.11.4 (MedCalc Software, Ostend, Belgium). To compare the two 4D flow sequences with the reference standard, a two-way analysis of variance (ANOVA) with the sequences as the first factor and the respective varying model parameters as the second factor was used. If signifi-cant differences were found between groups for net flow,
peak velocity, or image quality, the Dunnett test was performed to address the pairwise differences of the
other measurements to the reference standard. A p
value lower than 0.05 was considered to be significant. Correlation analyses were performed using scatter and linear regression analyses, as well as Bland-Altman plots. Bland-Altman analyses providing the mean differ-ences between the measurements (bias), the standard deviation of the mean (SD), and the limits of agreement (LOA) were used for the different approaches to the flow analysis.
Results
Flow visualisation
For both constant and pulsatile flow, a parabolic flow profile within the phantom vessel with slower flow velocities in the peripheral layers and faster velocities in
the centre of the vessel was demonstrated (Fig. 2c, d).
However, the peak velocities were higher in pulsatile flow, as expected.
Acquisition time
Mean acquisition time was 3:56 ± 0:02 min (mean ± SD) for the GRAPPA2 sequence and 1:54 ± 0:01 min for the
k-t-GRAPPA5 (p= 0.002).
Flow volumes quantification with constant flow
The first set of measurements was carried out with the centrifugal blood pump set to a constant rotational fre-quency of 1,500 rpm resulting in a flow volume of 1.7 L/ min (pump reference).
Measurements in 2D flow and 4D flow showed very good agreements with mean flow volumes resulting to 1.7 ± 0.0 (mean ± SD) L/min for 2D flow sequences and 1.75 ± 0.1 L/min for both 4D flow GRAPPA2 and 4D
k-t-GRAPPA5 sequences. The calculated mean flow
vol-umes of 4D flow measurements slightly overestimated the volume flow compared to the standard reference and 2D flow measurements. However, there were no
signifi-cant differences among the three measurements (p=
0.994), even though a large range of flow volumes was included, which was increased in 500 rpm steps from 1.7
to 7.7 L/min (Table 1). All 2D and 4D flow
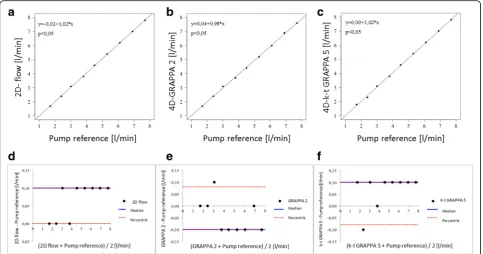
measure-ments demonstrated an excellent correlation with the
standard reference with a correlation coefficient of R=
0.99 for all sequences. LOA were from 0.0 to 0.10 L/min for 2D flow, from -0.10 to 0.08 L/min for GRAPPA2,
and from -0.08 to 0.1 L/min for k-t-GRAPPA5. Scatter
plots and Bland-Altman analyses are shown in Fig.3.
Flow velocities quantification with constant flow
Mean flow velocity
The centrifugal blood pump set to a rotational frequency of 1,500 rpm resulted in a mean velocity of 22 cm/s (pump reference). Measurements in 2D flow and 4D flow demonstrated very good agreements, with mean flow velocities of 22.5 ± 0.7 (mean ± SD) cm/s for the 2D flow sequence, 23 ± 0.0 cm/s for the 4D flow GRAPPA2
sequence, and 22.5 ± 0.7 cm/s for the 4D flow
k-t-GRAPPA5 sequence. Mean flow velocities of 2D flow and 4D flow measurements demonstrated slightly higher values compared to the pump reference. However, no significant differences between the three measurements
were observed (p= 0.998) (Table2).
All 2D flow and 4D flow velocity measurements dem-onstrated an excellent correlation with the pump
refer-ence with a correlation coefficient of R= 0.99 for all
sequences. LOA were from 0.0 to 2.0 cm/s for the 2D flow sequence, from -1.8 to 1.8 cm/s for the 4D flow GRAPPA2 sequence, and from 0.0 to 2.0 cm/s for the
4D flowk-t-GRAPPA5 sequence.
Peak velocity
The calculated peak velocities were identical for peak and mean velocity for all rpms. Measurements at 1,500 rpm
(22 cm/s) resulted in a mean peak flow velocities of 35.0 ± 1.4 (mean ± SD) cm/s for the 2D flow sequence, 32.5 ± 0.7 cm/s for the 4D flow GRAPPA2 sequence, and 31.0 ± 0.0
cm/s for the 4D flow k-t-GRAPPA5 sequence. The
mea-sured mean peak flow velocities for 2D flow and 4D flow measurements demonstrated considerably higher values compared to the reference. The differences between all 2D flow or 4D flow measurements to the reference standard increased with higher rpms. However, no significant differences among the three measurements were observed
(p= 0.999).
Despite the higher values, all 2D flow and 4D flow peak
velocity measurements with GRAPPA2 and k-t-GRAPPA5
sequences demonstrated an excellent correlation with the
reference standard with a correlation coefficient ofR= 0.99
for all sequences. LOA were from -7.6 to -33.6 cm/s for the 2D flow sequence, from - 6.5 to -27.7 cm/s for the 4D flow GRAPPA2 sequence, and from -6.6 to -34.3 cm/s for the
4D flowk-t-GRAPPA5 sequence.
Reproducibility
We repeated all measurements 4 weeks after the first set of measurements to evaluate the reproducibility of our
results and found no significant deviations (Tables 2, 3,
and 4). The flow volume LOA between the first and the
second set of measurements were from 0.00 to 0.1 L/ min for the 2D flow sequence, from 0.00 to 0.17 L/min for the 4D flow GRAPPA2 sequence, and from -0.06 to
0.1 L/min for the 4D k-t-GRAPPA5 sequence. The flow
velocity LOA between the first and the second set of measurements were from -0.8 to 1.0 cm/s for the 2D flow sequence, from 0.00 to 1.8 cm/s for the 4D flow GRAPPA2 sequence, and from -0.8 to -1.0 cm/s 4D flow
k-t-GRAPPA5 sequence.
Impact of the velocity encoding on measurements We repeated all acquisitions with the blood pump set to a constant rotational frequency of 5,500 rpm (resulting in a mean velocity of 101 cm/s) with
differ-ent Venc values of 140, 160, 190, 220, 250, 280, and
350 cm/s to evaluate the impact of the Venc on our
measurements. Data were analysed regarding the flow volume and mean and peak velocity, and we found no significant differences between the measurements taken with the optimal setting of 140 cm/s and all
other settings (Table3).
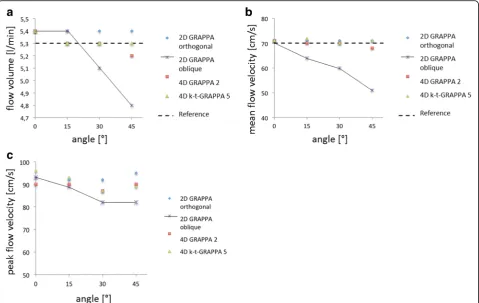
Evaluation of different angles between the vessel and measuring plane
To analyse the impact of different angles between the lon-gitudinal axis of the phantom and the measuring plane, we used the following angles: 0°, 15°, 30°, and 45°. With increasing angles, the cross-sectional region of interest in
circular shape to an oval one (Fig. 1 e, f ). As expected, we found an increasing underestimation of the flow volume and mean velocity in 2D flow with increasing deviation of the angle between the vessel and measur-ing plane, while we found no impact of angle changes
on the measurements in both 4D flow sequences. We found significantly decreasing results regarding the peak
velocity measured with 2D flow sequences (p= 0.006) and
no impact on measurements with 4D flow sequences (p=
0.999 for both) (Table4and Fig.4).
Fig. 3Scatter plots of the correlation between flow volumes [L/min] measured with (a) the 2D flow sequence, (b) the 4D flow GRAPPA2 sequence, and (c) thek-t-GRAPPA5 sequence versus the pump reference. The correlation coefficientRwas 0.99 for each of the graphs. Bland-Altman analysis of flow volumes [L/min] measured with (d) the 2D flow sequence, (e) the 4D flow GRAPPA2 sequence, and (f) thek-t-GRAPPA5 sequence versus the pump reference the limits of agreement (LOA) between the flow volumes [L/min] in (d) 2D PCMRI, (e) GRAPPA2, and (f)k-t -GRAPPA5 and the pump reference. The limits of agreement were from 0.0 to 0.1, from−0.1 to 0.08, and from−0.08 to 0.1 L/min, respectively. 2D, two-dimensional; 4D, four-dimensional; GRAPPA, generalised autocalibrating partially parallel acquisition; L/min, litres per minute
Table 2Distribution of two measurements of the mean velocity for 2D flow and two 4D flow phase-contrast sequences (GRAPPA2 andk-t-GRAPPA5) with different rotational frequencies of the blood pump
Rotational pump output, rpm
Venc,
cm/s
Pump reference mean velocity 2D flow PC mean velocity 4D flow PC GRAPPA2 mean
velocity
4D flow PCk-t-GRAPPA5
mean velocity
cm/s cm/s (difference
from the pump reference)
cm/s cm/s (difference
from the pump reference)
cm/s cm/s (difference
from the pump reference)
cm/s
Exam 1 Exam 2 Mean ± SD Exam 1 Exam 2 Mean ± SD Exam 1 Exam 2 Mean ± SD Exam 1 Exam 2 Mean ± SD
1,500 40 22 22 22 ± 0.0 22 (+ 0) 23 (+ 0) 22.5 ± 0.7 23 (+ 1) 23 (+ 1) 23 ± 0.0 23 (+ 1) 22 (+ 0) 22.5 (± 0.7)
2,000 50 31 30 31 ± 0.7 32 (+ 1) 32 (+ 2) 32 ± 0.0 32 (+ 1) 32 (+ 2) 32 ± 0.0 31 (+ 0) 31 (+ 1) 31 (± 0.0)
2,500 60 39 39 39 ± 0.0 41 (+ 2) 41 (+ 2) 41 ± 0.0 41 (+ 2) 41 (+ 2) 41 ± 0.0 41 (+ 2) 42 (+ 3) 41.5 (± 0.7)
3,000 70 50 50 50 ± 0.0 50 (+ 0) 50 (+ 0) 50 ± 0.0 49 (-1) 50 (+ 0) 49.5 ± 0.7 50 (+ 0) 52 (+ 2) 51 (± 1.4)
3,500 85 59 59 59 ± 0.0 60 (+ 1) 60 (+ 1) 60 ± 0.0 58 (-1) 59 (+ 0) 58.5 ± 0.7 60 (+ 1) 62 (+ 3) 61 (± 1.4)
4,000 100 70 70 70 ± 0.0 71 (+ 1) 70 (+ 0) 70.5 ± 0.7 68 (-2) 70 (+ 0) 69 ± 1.4 71 (+ 1) 72 (+ 2) 71.5 (± 0.7)
4,500 110 80 80 80 ± 0.0 81 (+ 1) 82 (+ 2) 81.5 ± 0.7 79 (-1) 80 (+ 0) 79.5 ± 0.7 81 (+ 1) 83 (+ 3) 82 (± 1.4)
5,000 125 91 91 91 ± 0.0 92 (+ 1) 93 (+ 2) 92.5 ± 0.7 91 (+ 0) 91 (+ 0) 91 ± 0.0 92 (+ 1) 94 (+ 3) 93 (± 1.4)
5,500 140 101 101 101 ± 0.0 103 (+ 2) 103 (+ 2) 103 ± 0.0 100 (-1) 101 (+ 0) 100.5 ± 0.7 103 (+ 2) 104 (+ 3) 103.5 (± 0.7)
No significant differences between measurements and pump reference were observed (p= 0.998)
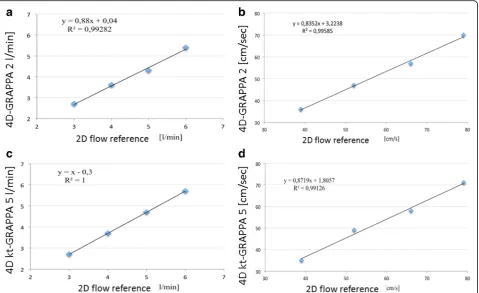
Analysis of pulsatile flow
We used 2D flow sequences as a reference standard for measurements with pulsatile flow, as explained in the “Methods”section. First, we found that in both constant and pulsatile flow, there was a parabolic-shaped flow
pro-file (Fig. 2c, d). We performed multiple measurements
with different settings of the blood pump resulting in a flow volume of from 3 to 6 L/min and a mean flow vel-ocity from 40 to 80 cm/s. We found excellent correlations
between 2D flow and 4D flow sequences (R= 0.99–1.0).
The flow volume LOA between the 2D flow and the 4D flow GRAPPA2 sequences were from -0.18 to -0.38 and
those between the 2D flow and the 4D flowk-t-GRAPPA5
were from -0.38 to 0.18 L/min. The mean velocity LOA between the 2D flow and the 4D flow GRAPPA2 se-quences were from -1.63 to 2.13 cm/s and those between
the 2D flow and the 4D flow k-t-GRAPPA5 were from
-1.23 to 0.73 cm/s (Table5and Fig.5).
Discussion
We achieved a significant scan time reduction by using
thek-t-GRAPPA-accelerated 4D flow sequence compared
to the GRAPPA2-accelerated 4D flow sequence without any impact on measurement results. We demonstrated a good correlation between the two different accelerated 4D flow sequences in a phantom study. This correlation ap-plies for flow volumes, as well as for flow velocities, in both constant and pulsatile flow, and compared to phan-tom and 2D flow.
These results are consistent with the findings in the literature obtained using phase-contrast MRI in healthy
volunteers and patients. In 2014, Schnell et al. [2] found
a good correlation between a GRAPPA2-accelerated 4D
flow sequence and ak-t-accelerated 4D flow sequence in
healthy volunteers with different acceleration factors. In
addition, these researchers found that ak-t acceleration
factor 5 was most recommendable. Limitations of this study were the lack of validation against 2D flow se-quences as the current standard of care and the lack of validation against a flow phantom.
We demonstrated a strong agreement (R= 0.99)
be-tween both accelerated 4D flow sequences and a stand-ard 2D flow sequence. There are numerous articles regarding the validation of different 4D flow sequences
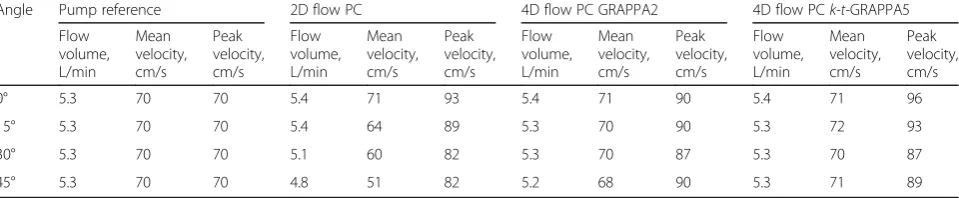
Table 4Distribution of measurements of the flow volumes, mean velocity, and peak velocity for two different 2D flow phase-contrast acquisitions (orthogonal“through-plane”to the phantom vessel and misaligned) and two 4D flow phase-contrast sequences (GRAPPA2 andk-t-GRAPPA5) with angles between the longitudinal axis of the phantom vessel and thez-direction in 15° steps from 0 to 45°
Angle Pump reference 2D flow PC 4D flow PC GRAPPA2 4D flow PCk-t-GRAPPA5
Flow volume, L/min
Mean velocity, cm/s
Peak velocity, cm/s
Flow volume, L/min
Mean velocity, cm/s
Peak velocity, cm/s
Flow volume, L/min
Mean velocity, cm/s
Peak velocity, cm/s
Flow volume, L/min
Mean velocity, cm/s
Peak velocity, cm/s
0° 5.3 70 70 5.4 71 93 5.4 71 90 5.4 71 96
15° 5.3 70 70 5.4 64 89 5.3 70 90 5.3 72 93
30° 5.3 70 70 5.1 60 82 5.3 70 87 5.3 70 87
45° 5.3 70 70 4.8 51 82 5.2 68 90 5.3 71 89
No significant differences between 4D flow measurements, orthogonal (“through-plane”) 2D flow measurements, and the pump reference (p= 0.999). In contrast, the misaligned 2D flow measurements demonstrated increasingly higher differences with the degree of misalignment
2Dtwo-dimensional,4Dfour-dimensional,cm/scentimetres per second,GRAPPAgeneralised autocalibrating partially parallel acquisition,L/minlitres per minute, PCphase-contrast,Vencvelocity encoding
Table 3Distribution of measurements of the flow volumes, mean velocity, and peak velocity for 2D flow and two 4D phase-contrast sequences (GRAPPA2 andk-t-GRAPPA5) with different encoded velocities (Venc)
Venc,
cm/s
Pump reference 2D flow PC 4D flow PC GRAPPA2 4D flow PCk-t-GRAPPA5
Flow volume, L/min
Mean velocity, cm/s
Peak velocity, cm/s
Flow volume, L/min
Mean velocity, cm/s
Peak velocity, cm/s
Flow volume, L/min
Mean velocity, cm/s
Peak velocity, cm/s
Flow volume, L/min
Mean velocity, cm/s
Peak velocity, cm/s
140 7.7 101 101 7.8 103 135 7.6 100 126 7.8 103 133
160 7.7 101 101 7.8 103 135 7.6 100 126 7.8 103 131
190 7.7 101 101 7.8 102 138 7.5 99 125 7.9 103 132
220 7.7 101 101 7.8 102 140 7.6 99 129 7.9 104 133
250 7.7 101 101 7.8 103 143 7.6 100 128 8.0 105 136
280 7.7 101 101 7.9 103 126 7.7 102 127 8.0 106 137
350 7.7 101 101 7.9 102 138 7.8 103 131 7.8 104 138
No significant differences between measurements and pump reference (p= 0.395)
against 2D flow sequences in different anatomical regions
with good correlations [21–23] in humans. All of these
studies lack a valid reference standard, such as invasive flow measurements or a phantom reference. In our study, we demonstrated not only a good correlation between both 4D flow sequences and 2D flow sequences but, more importantly, we also showed a good correlation between all flow sequences and the pump reference regarding the
flow volume and mean velocity in constant and pulsa-tile flow. These basic evaluations of 4D flow sequences against a reliable reference, such as a flow phantom, are mandatory before including these new sequences in the clinical routine. Valid phantom studies also allow for performing consistency tests of the MRI systems to maintain and monitor acquired data quality, as is re-quired for x-ray equipment.
Table 54D flow measurements with GRAPPA2 andk-t-GRAPPA5 sequences of the flow volumes and mean velocities in pulsatile flow in comparison with 2D flow phase-contrast sequences
2D flow PC 4D flow PC GRAPPA2 4D flow PCk-t-GRAPPA5
Flow volume, L/min
Mean velocity, cm/s
Peak velocity, cm/s
Flow volume, L/min
Mean velocity, cm/s
Peak velocity, cm/s
Flow volume, L/min
Mean velocity, cm/s
Peak velocity, cm/s
2.7 35 69 2.7 36 72 2.7 35 72
3.6 47 98 3.6 47 100 3.7 48 102
4.4 58 123 4.3 57 120 4.7 58 123
5.7 71 149 5.4 70 147 5.7 71 149
Correlation coefficientR(pvalue)* 1.0 1.0 1.0 0.99 0.99 0.99
Limits of agreement* -0.18, 0.38 -1.63, 2.13 -5.8, 5.8 -0.38, 0.18 -1.23, 0.73 -5.8, 2.3
2Dtwo-dimensional,4Dfour-dimensional,cm/scentimetres per second,GRAPPAgeneralised autocalibrating partially parallel acquisition,L/minlitres per minute, PCphase-contrast
*Correlation coefficients and limits of agreement between the 4D flow PC GRAPPA2 andk-t-GRAPPA5 with the 2D flow PC sequences used as the reference standard
We measured higher peak velocities compared to the ones calculated from the measured flow volumes of the pump reference in both accelerated 4D flow and in the 2D flow sequence. That approach was employed because
even in constant flow, a parabolic flow profile exists [24]
(see Fig. 2c, d) due to the surface tension of the water.
This phenomenon means that the flow velocity in the peripheral layers is lower than in the centre of the vessel. The formula that we used for the calculation of peak flow velocities from the measured flow volume of the pump reference does not take such inhomogeneous flow profiles into account; therefore, the calculated results in-stead represent the mean flow velocity with the assump-tion of constant flow in all parts of the cross-secassump-tional area of the tube than the peak flow velocity as it occurs in the centre of the vessel.
Several publications about the correlation between dif-ferent 2D flow and 4D flow sequences with a flow
phan-tom already exist, mostly using only constant flow [7,23,
25, 26]. Nilsson et al. [26] found a good correlation
be-tween 2D flow, 4D flow, and the phantom reference with constant flow regarding the peak velocity and flow vol-umes. This finding fits with the results of our own study. However, the authors reported deviations between 2D flow and 4D flow regarding the velocity values from -2.3
to 13.0%. We found a slightly better correlation between
2D and 4D measurements (R= 0.99–1.0). In addition, we
used a k-t-accelerated 4D flow sequence, which was not
evaluated against a phantom.
However, flow phantoms with constant flow do not
fully represent physiological flow patterns in vivo. In
other words, a good correlation between measurements in 2D or 4D flow sequences and constant flow phantom measurements are a prerequisite but not synonymous with good correlations regarding the physiological pulsa-tile flow patterns. Therefore, a validation of the sequences against a flow phantom with pulsatile flow is mandatory.
In our study, we showed excellent agreement (R= 0.99
and 1.0) between both accelerated 4D flow and 2D flow sequences regarding the different flow volumes and mean and peak velocities, and in physiological, pulsatile flow.
The number of phantom studies assessing 4D flow mea-surements of pulsatile flow remains limited. In our study, the correlations were slightly better than in the study of
Garg et al. [27]. These researchers also compared different
accelerated 4D flow sequences with a 2D flow sequence in a phantom study with pulsatile flow and found mean er-rors for 4D flow versus 2D flow from -3.2 to -8.8% for peak velocities. One possible reason for these differences might be that Garg and colleagues used a 1.5-T scanner,
while we used a 3-T scanner. Imaging at higher field strengths provides a higher signal-to-noise ratio (SNR), which means increased image quality and accuracy of flow
measurements [23,28].
To obtain precise measurements with 2D flow
se-quences in vivo, it is important to place the measuring
plane perpendicular to the vessel of interest. Oblique planes may lead to inaccurate measurements. Especially in congenital heart disease, proper positioning of the meas-uring planes can be difficult due to the altered anatomy. The results of this study underline one major advantage of 4D flow sequences: due to their 3D geometry, 4D flow se-quences allow coverage of complete vessel systems, such as the thoracic aorta, with no need for special planning, and they allow for subsequent reconstruction and assess-ment of every vessel within the covered field of view. We showed that deviations of the acquisition planes had no impact on the accuracy of the measurements in 4D flow but led to inaccurate results in 2D flow measurements, de-pending on the degree of misalignment. In 2002, Lotz et
al. [7] reported similar results using a flow phantom to
evaluate 2D flow sequences. They found that oblique measuring planes in 2D flow sequences led to inaccurate measurements. To the best of our knowledge, this report was the first to demonstrate in a phantom flow study that deviations of the acquisition planes have no impact on the accuracy of 4D flow measurements. Therefore, the authors conclude that 4D flow is the ideal technique in regard to flow measurements in complicated vessel anatomy or in examinations of congenital heart disease with altered and complex anatomy.
One general rule for phase-contrast 2D and 4D flow
measurements is that the better theVencfits the real
vel-ocity within the vessel of interest, the better and more
accurate the measurements become [7]. While aVencset
too low leads to phase wrapping, aVencset too high can
lead to underestimation of the real flow velocities and
volumes [7,29,30]. Underestimation occurs due to
inad-equate signal-to-noise ratio. Noise in the velocity
encod-ing images increases with a higher Venc [31]. In our
study, we found no impact of a Vencset too high on the
accuracy of measurements in 2D flow as well as in 4D
flow sequences. Even a Venc set more than three times
higher (350 cm/s, while the real velocity in the vessel was 101 cm/s) showed no effect. Again, one possible rea-son for these observations is that we performed all mea-surements using a 3-T scanner, while the previously mentioned studies by other groups were performed at 1.5 T only. Higher field strength means a higher SNR
[28]. It is already known that phase-contrast imaging
performed using 3-T scanners benefits from a better SNR relative to a 1.5-T scanner and could therefore be more suitable also for simultaneous examinations of the arterial and venous vessels.
Additionally, we also showed a good reproducibility of all measurements in all used 2D flow and 4D flow se-quences, which is mandatory in regard to the integration of the sequences into the clinical routine, where patients may undergo numerous follow-up scans.
One limitation of this study is that we performed the
evaluation only with a flow phantom with“healthy”
ves-sels without any stenosis, as performed by other groups
[27,32,33]. In addition, for the flow measurements, we
did not use contrast medium to increase the SNR
be-cause our goal was to“simulate” in vivoconditions. In
addition, we used a 3-T scanner, where the SNR is already high without the addition of contrast medium. Finally, although we found excellent correlations, a phantom cannot completely simulate physiological con-ditions. Therefore, these results are not completely
transferable to in vivosettings. Proper evaluations in a
phantom study, however, are an important prerequisite for evaluating these techniques in human volunteers or patients.
In conclusion, we showed that both 4D flow sequences and the 2D flow sequence used in this study provide accurate flow data when using a 3-T scanner. All sequences agreed strongly with the reference given by the flow phantom regarding the flow volumes and mean velocities in continuous and pulsatile flow. Importantly, we demonstrated that 4D flow sequences deliver accur-ate measurements even with misaligned acquisition planes, while there is a strong bias using the 2D flow
se-quences, enabling “fast-forward” planning. In addition,
we showed that in a 3-T scanner, due to the high SNR, a
Vencset too high within a physiological range has no
im-pact on the accuracy of measurements using 2D flow and 4D flow sequences in a phantom setting.
Abbreviations
2D:Two-dimensional; 3D: Three-dimensional; 4D: Four-dimensional; GRAPPA: Generalised autocalibrating partially parallel acquisition; LOA: Limits of agreement; MRI: Magnetic resonance imaging; rpm: Rotations per min; SD: Standard deviation of the mean; SNR: Signal-to-noise ratio;Venc: Velocity encoding
Acknowledgements
The authors thank Andreas Greiser (Siemens Healthcare GmbH, Erlangen, Germany) for his support with the GRAPPA 2 sequence. In addition, we thank Susan Rosemeier for her support in data acquisition.
Funding
This study was supported by a DFG grant (GU 777/4-1–AOBJ 629068 and GR 4617/2-1 AOBJ 629069).
Availability of data and materials
Please contact the corresponding author for data requests.
Authors’contributions
development of the softwareBloodlineand reviewed the manuscript. SK reviewed the manuscript and is the expert in statistical analysis and methodology. BP contributed to the invention and developing of the softwareBloodlineand reviewed the manuscript. MGro contributed to the conceptualisation and methodology of the study, conceptualisation of the phantom, data acquisition, and measurements and reviewed the manuscript and is a senior author. MGut contributed to the conceptualisation and methodology of the study and conceptualisation of the phantom, reviewed the manuscript, and is a senior author. All authors read and approved the final manuscript.
Ethics approval and consent to participate
Not applicable.
Consent for publication
Not applicable.
Competing interests
The authors declare that they have no competing interests.
Publisher’s Note
Springer Nature remains neutral with regard to jurisdictional claims in published maps and institutional affiliations.
Author details
1Department of Diagnostic and Interventional Radiology, University of
Leipzig–Heart Centre, Leipzig Strümpellstrasse 39, 04289 Leipzig, Germany.
2Department of Simulations and Graphics, University of Magdeburg,
Magdeburg, Germany.3Institute for Biometrics and Medical Informatics,
University of Magdeburg, Magdeburg, Germany.4Department of Diagnostic,
Interventional and Paediatric Radiology, University of Bern, Bern, Switzerland.
Received: 2 October 2018 Accepted: 1 February 2019
References
1. Markl M, Chan FP, Alley MT et al (2003) Time-resolved three-dimensional phase-contrast MRI. J Magn Reson Imaging 17:499–506
2. Schnell S, Markl M, Entezari P et al (2014) k-t GRAPPA accelerated four-dimensional flow MRI in the aorta: effect on scan time, image quality, and quantification of flow and wall shear stress. Magn Reson Med 72:522–533 3. Meuschke M, Lawonn K, Köhler B, Preim U, Preim B (2016) Clustering of
aortic vortex flow in cardiac 4D PC-MRI data. In: Tolxdorff T, Deserno T, Handels H, Meinzer HP (eds) Bildverarbeitung für die Medizin 2016. Informatik aktuell. Springer Vieweg, Berlin, Heidelberg.https://doi.org/10. 1007/978-3-662-49465-3_33
4. Nordmeyer S, Riesenkampff E, Crelier G et al (2010) Flow-sensitive four-dimensional cine magnetic resonance imaging for offline blood flow quantification in multiple vessels: a validation study. J Magn Reson Imaging 32:677–683
5. Uribe S, Beerbaum P, Sørensen TS, Rasmusson A, Razavi R, Schaeffter T (2009) Four-dimensional (4D) flow of the whole heart and great vessels using real-time respiratory self-gating. Magn Reson Med 62:984–992 6. Gatehouse PD, Keegan J, Crowe LA et al (2005) Applications of
phase-contrast flow and velocity imaging in cardiovascular MRI. Eur Radiol 15: 2172–2184
7. Lotz J, Meier C, Leppert A, Galanski M (2002) Cardiovascular flow measurement with phase-contrast MR imaging: basic facts and implementation. Radiographics 22:651–671
8. Dyverfeldt P, Bissell M, Barker AJ et al (2015) 4D flow cardiovascular magnetic resonance consensus statement. J Cardiovasc Magn Reson 17:72 9. Markl M, Harloff A, Bley TA et al (2007) Time-resolved 3D MR velocity
mapping at 3T: improved navigator-gated assessment of vascular anatomy and blood flow. J Magn Reson Imaging 25:824–831
10. Jung B, Ullmann P, Honal M, Bauer S, Hennig J, Markl M (2008) Parallel MRI with extended and averaged GRAPPA kernels (PEAK-GRAPPA): optimized spatiotemporal dynamic imaging. J Magn Reson Imaging 28:1226–1232 11. Johnson KM, Lum DP, Turski PA, Block WF, Mistretta CA, Wieben O (2008)
Improved 3D phase contrast MRI with off-resonance corrected dual echo VIPR. Magn Reson Med 60:1329–1336
12. Jung B, Stalder AF, Bauer S, Markl M (2011) On the undersampling strategies to accelerate time-resolved 3D imaging using k-t-GRAPPA. Magn Reson Med 66:966–975
13. Hellerbach A, Schuster V, Jansen A, Sommer J (2013) MRI phantoms–are there alternatives to agar? PLoS One 8:e70343
14. Griswold MA, Jakob PM, Heidemann RM et al (2002) Generalized autocalibrating partially parallel acquisitions (GRAPPA). Magn Reson Med 47: 1202–1210
15. Stankovic Z, Fink J, Collins JD et al (2015) K-t GRAPPA-accelerated 4D flow MRI of liver hemodynamics: influence of different acceleration factors on qualitative and quantitative assessment of blood flow. MAGMA 28:149–159 16. Luecke C, Andres C, Foldyna B et al (2012) Impact of heart rate and rhythm
on radiation exposure in prospectively ECG triggered computed tomography. Eur J Radiol 81:2221–2230
17. Köhler B, Born S, van Pelt RFP, Hennemuth A, Preim U, Preim B (2017) A survey of cardiac 4D PC-MRI data processing. Comput Graph Forum 36:5–35 18. Köhler B, Gasteiger R, Preim U, Theisel H, Gutberlet M, Preim B (2013)
Semi-automatic vortex extraction in 4D PC-MRI cardiac blood flow data using line predicates. IEEE Trans Vis Comput Graph 19:2773–2782.https://doi.org/10. 1109/TVCG.2013.189
19. Köhler B, Preim U, Grothoff M, Gutberlet M, Strach K, Preim B (2015) Guided analysis of cardiac 4D PC-MRI blood flow data. Eurographics (Dirk Bartz Prize) 2015:2–5
20. Bock J, Kreher BW, Hennig J, Markl M (2007) Optimized pre-processing of time-resolved 2D and 3D phase contrast MRI data. Proceedings of the 15th Annual Meeting of ISMRM 15:3138.https://cds.ismrm.org/ismrm-2007/files/ 03138.pdf
21. Wentland AL, Grist TM, Wieben O (2013) Repeatability and internal consistency of abdominal 2D and 4D phase contrast MR flow measurements. Acad Radiol 20:699–704
22. Meckel S, Leitner L, Bonati LH et al (2013) Intracranial artery velocity measurement using 4D PC MRI at 3 T: comparison with transcranial ultrasound techniques and 2D PC MRI. Neuroradiology 55:389–398 23. Lotz J, Döker R, Noeske R et al (2005) In vitro validation of phase-contrast
flow measurements at 3 T in comparison to 1.5 T: precision, accuracy, and signal-to-noise ratios. J Magn Reson Imaging 21:604–610
24. Baker M, Wayland H (1974) On-line volume flow rate and velocity profile measurement for blood in microvessels. Microvasc Res 7:131–143 25. Richau J, Dieringer MA, Traber J et al (2017) Effects of heart valve prostheses
on phase contrast flow measurements in cardiovascular magnetic resonance–a phantom study. J Cardiovasc Magn Reson 19:1–11 26. Nilsson A, Revstedt J, Heiberg E, Ståhlberg F, Bloch KM (2015) Volumetric
velocity measurements in restricted geometries using spiral sampling: a phantom study. MAGMA 28:103–118
27. Garg P, Westenberg JJM, van den Boogaard PJ et al (2018) Comparison of fast acquisition strategies in whole-heart four-dimensional flow cardiac MR: two-center, 1.5 tesla, phantom and in vivo validation study. J Magn Reson Imaging 47:272–281
28. Gutberlet M, Noeske R, Schwinge K, Freyhardt P, Felix R, Niendorf T (2006) Comprehensive cardiac magnetic resonance imaging at 3.0 tesla: feasibility and implications for clinical applications. Invest Radiol 41:154–167 29. Evans AJ, Iwai F, Grist TA et al (1993) Magnetic resonance imaging of blood
flow with a phase subtraction technique. Invest Radiol 28:109–115 30. Buonocore MH (1993) Blood flow measurement using variable velocity
encoding in the RR interval. Magn Reson Med 29:790–795 31. Andersen AH, Kirsch JE (1996) Analysis of noise in phase contrast MR
imaging. Med Phys 23:857–869
32. Gu T, Korosec FR, Block WF et al (2005) PC VIPR: a high-speed 3D phase-contrast method for flow quantification and high-resolution angiography. AJNR Am J Neuroradiol 26:743–749