Optimization and Validation of LLE/HPLC-DAD
Method to Determine the Residues of Selected PAHs in
Surface Water
Ahammed Shabeer T.P1, 3, Ajoy Saha1, 2*, V.T. Gajbhiye1, and Suman Gupta1
1Division of Agricultural Chemicals, Indian Agricultural Research Institute, New Delhi, India 2Directorate of Groundnut Research, Junagadh, Gujarat, India
3National Research Centre for Grapes, Pune, Maharashtra, India.
*Email: [email protected]
Paper No. 109 Received: December 27, 2012 Accepted: March 14, 2013 Published: June 1, 2013
Abstract
A rapid precise and accurate method was optimized and validated for the simultaneous determination of 6 PAHs (naphthalene, acenaphthalene, phenanthrene, fluoranthrene, anthracene and pyrene) in water by HPLC and their distribution in surface water (water from Yamuna river in Wazirabad and Okhla region and Aakulam lake, Kerala) were undertaken. The High-Pressure Liquid Chromatography (HPLC) separation of 6 PAHs was carried out by C-18 column with gradient elution of acetonitrile and water with diode-array detection (DAD). The method was optimized by using liquid–liquid extraction (LLE) with different solvent like hexane, dichloromethane and ethyl acetate and extract cleaned by adsorption column cleanup using different adsorbent like silica gel, alumina and florisil. Among the three solvents used for LLE, dichloromethane gave maximum extraction efficiency (70.27-91.09%). For the cleanup of water extract, a florisil column using 20:80 acetone:hexane as the eluting solvent gave recovery of 91.2-97.2 µg and 8.9-9.6 µg at 100 µg and 10 µg of PAHs loaded in the column, respectively. The total method recovery using dichloromethane as the extracting solvent and 20:80 acetone: hexane as the eluting solvent for florisil column clean up varied from 71.02-89.74%. Limit of detection (LOD), limit of quantiûcation (LOQ), and correlation coefficients were found in the range of 0.1 to 1.5 ìg L-1, 0.5 to 4 ìg L-1 and 0.994 to 0.999, respectively. No residues of PAHs were detected in any of the water samples other than the Okhla water samples. The PAHs detected in Okhla water sample were phenanthrene (3.51 µg L-1) and fluoranthrene (4.61 µg L-1).
Highlights
A rapid, precise and accurate method was optimized and validated for simultaneous determination of 6 PAHs in water by HPLC with a method recovery of 71.02-89.74%
Keywords: HPLC-DAD, LLE, poly aromatic hydrocarbons (PAHs), water analysis, yamuna river, aakulam lake
©2013 New Delhi Publishers. All rights reserved
Citation: IJAEB: 6(2): 241-248 June 2013 .
Poly aromatic hydrocarbons (PAHs) are a large group of
the open ocean, over a wide range of concentrations. Most studies of their distribution in aquatic sediments have been conducted in industrialized countries, e.g., England (Woodhead et al., 1999), the USA (Stout et al., 2004), Europe (Notar et al., 2001) and Australia (McCready et al., 2000). However, very limited information is available on the environmental distribution of PAHs in tropical India (Guzzella et al., 2005; Agarwal et al., 2006), although industrialization and urbanization have proceeded rapidly during the last few decades (Choduhury and Rakshit, 2012) and the associated increase in PAHs is of concern in this region. Recently International legislation has set the permissible levels for PAHs in drinking water; the USEPA has established maximum contaminant level (MCL) for total PAHs in drinking water of 0.2 ppb (USEPA).
Highly sensitive analytical methods are required as to detect the PAHs at such a low concentrations in water. Several chromatographic methods have been used to identify and determine PAHs in water, although High-Pressure Liquid Chromatography (HPLC) and Gas Chromatography-Mass Spectrometry (GC-MS) are the most common methods used (APHA et al., 1992; EPA, 2002). Since its inception in the early 1970’s, HPLC has been used for the separation of PAHs. Since Schmit’s report (Schmit et al., 1971), reversed-phase on chemically bonded C-18 phases with the most common detection methods like uv-visible or diode-array detection (DAD) has become the most popular HPLC mode for the separation of PAHs (Bjorseth, 1983: Fetzer, 1989; Sun et al., 1998).
The most widely used sample preparation method for PAHs from liquid (aqueous) samples is liquid–liquid extraction (LLE) and solid phase extraction (SPE) (Titato and Lancas, 2005, 2006). LLE (Handley, 1999) a method that has remained virtually unchanged during the past hundred years. LLE relies on the relative solubility, diffusion, partitioning, viscosity and surface tension of the analyte(s) and the solvent. Though this classical extraction technique is laborious, time-consuming, require large amounts of solvent but still this method is used for extraction because this is a simple, low-cost method with a high efficiency of extraction of organic pollutants from water (Saha et al., 2012) and many of the standard methods of the Environmental Protection Agency (EPA) are based on it. Moreover the selectivity of SPE is usually worse than that of LLE. In view of these points, the aim of the present study was to develop and validate a sensitive and reliable method for the simultaneous determination of 6 different PAHs in water,
using liquid–liquid extraction (LLE) and high performance liquid chromatography with diode-array detection (HPLC-DAD) and their residues in surface water.
Materials and methods
Apparatus and reagents
A Shimadzu-Class VP HPLC equipped with system with a programmable wavelength SPD-M10AVP- diode array detector and Phenomenex-C18 column (250 mm ×4.6 mm ×0.5 µ) was employed for analysis of different PAHs. The analytical grade (>90% purity) PAHs (naphthalene, acenaphthalene, phenanthrene, fluoranthrene, anthracene and pyrene) were procured from M/s Acrose. All the solvents used, that is, acetonitrile, dichloromethane (DCM), n-hexane, ethyl acetate obtained in HPLC grade from Merck Pvt. Ltd. Anhydrous sodium sulphate (Na2SO4), sodium chloride (NaCl) silica gel, alumina and florosil adsorbent were provided by Thermo Fisher Scientific India Pvt. Ltd. Chromatographic glass column (450×30 mm) and other glasswares were procured from Borosil India Ltd.
Stock and working standard solutions
Stock solution of 1000 µg mL-1 for each PAHs were prepared in acetonitrile and 5 mL of each individual stock solution (1000 µg mL-1) were taken in a 50 mL volumetric flask and volume was made up with HPLC grade acetonitrile to get 100 µg mL-1 PAHs mixture stock solutions. Working standard solutions of 10.0, 5.0, 1.0, 0.5, 0.1, 0.05, 0.02, 0.01 and 0.005 µg mL-1 concentration of PAHs mixture were prepared by serial dilution of stock solution (50 µg mL-1 PAHs) with acetonitrile.
For cleanup study column chromatography technique was employed. The column dimension of 450×30 mm was used for the puriûcation procedure. In relation to the degree of puriûcation needed, the different type of adsorbent like silica gel, alumina and florisil were used for chromatographic column packing. The column packing was made such that the 5 g of each of the adsorbent was sandwiched between 2 g of anhydrous Na2SO4 and column was pre-conditioned by eluting with 200 mL of distilled hexane. The column was loaded with mixture of PAHs containing 10 µg and 100 µg and eluted with 150 mL of 20:80 acetone:hexane mixture in triplicate. Six fractions of 25 mL each of the eluting solvents were collected in different conical flasks, dried, analyzed for the added PAHs.
For total method Recovery, the fortified water sample (PAHs mixture containing 0.01 and 0.1 mg L-1 of each) was extracted with the selected extracting solvent and the concentrated extract were cleaned using florisil column. The cleaned extract was collected in conical flask, dried, and analyzed for the PAHs and method recovery was calculated.
Validation parameters
Detection limit (DL) and linearity range of different PAHs in HPLC-DAD
Peak areas of the standard analytes were used to evaluate the linearity and sensitivity of the instrument. In order to determine the sensitivity of the instrument the detection limits were calculated with smallest quantity of the standard materials resulting in peak area thrice that of noise level for each of the PAHs for a 20 µL of injection.
The linearity of the detector response was determined by injecting the standard solution of different concentration into the HPLC-DAD instrument. Calibration curves for individual PAH were constructed by plotting average peak area against concentration and regression equation was computed. To establish linearity, a minimum of 5 concentrations is recommended.
Precision
The precision in the conditions of repeatability (six analyses in a single day) and the intermediate precision (six analyses in five different days) were determined separately at concentrations of 0.01, 0.05 and 0.1 mg L-1 for all the analytes.
Accuracy-recovery experiments
The recovery experiments were carried out by fortifying the distilled water in six replicate with the PAHs under study at three concentration levels, namely 0.01, 0.05 and 0.1 mg L-1.
Limit of detection (LOD) and limit of quantiûcation (LOQ) for the method
The limit of detection of an individual analyte is the lowest amount of analyte in a sample that can be detected with acceptable certainty but not quantiûed as an exact value. The limit of quantiûcation of an individual analytical procedure is the lowest amount of analyte in a sample that can be quantitatively determined with acceptable precision and accuracy. A signal-to- noise ratio (S/N) of 3 was for estimating LOD and signal-to-noise ratio of 10 was used for estimating LOQ. Peak-to-peak noise around the analyte retention time was measured, and subsequently, the concentration of the analyte that would yield a signal equal to certain value of noise to signal ratio was estimated.
Collection and analysis of water samples
The natural water samples were collected from Yamuna river, Delhi (Wazirabad 1, Wazirabad 2 (entry point of Yamuna to Delhi) and Okhla (exit point of Yamuna to Delhi) and Aakulam lake (Kerala), were homogenized and kept under refrigerated condition before processing. One liter of the collected samples in triplicates was extracted, cleaned up using florisil column and analyzed for the residues of selected PAHs by HPLC-DAD.
Results and discussion
Standardization of the HPLC conditions
maximum separation of PAHs was carried out with mobile phase composed of gradient of acetonitrile (ACN) and degassed water and at a wavelength 254 nm. The composition gradient started with 50% water and 50% ACN, then the ACN content was increased to 75% (0–20 min), 100% (20–25 min) and 50% (25–30 min). This level was held constant for 5 min until the end of the analysis. Flow rate: 0.8 ml min-1; Injection volume: 20 µL; total run time: 35 minutes. The chromatogram given in Figure 1 shows clear separation of the 6 compounds within 25 minutes of run time and additional 10 minutes were given to elute impurities if any from the column. Retention time of different PAHs is given in Table 1. HPLC methodology for the analysis of PAHs in water has also been standardized by Agarwal et al., 2006.
Method optimization
Liquid-liquid extraction (LLE) with different solvents like hexane, dichloromethane and ethyl acetate has been tried for the extraction of PAHs from the water. When hexane was used as the extracting solvent, the overall extraction efficiency varied from 67.11-86.64% at 0.1 mg L-1 and
66.37-85.9% at 0.01 mg L-1 fortification level (Table 2). All the PAHs except naphthalene got an extraction efficiency of >70.0% both at high and low fortification level. When ethyl acetate was used for extraction, the overall extraction efficiency varied from 66.83-84.34% at 0.1 mg L-1 and 66.23-82.28% at 0.01 mg L-1 fortification level (Table 2). In case of ethyl acetate also, all the PAHs except naphthalene got an extraction efficiency of >70.0% both at high and low fortification level. When DCM was used for extraction, the overall extraction efficiency varied from 70.27-91.09 % at 0.1 mg L-1 and 71.33-91.71% at 0.01 mg L-1 fortification level (Table 2).
For extraction of PAHs from the water, liquid-liquid partitioning with DCM gave highest extraction efficiency of 70.27-91.71% (Table 2). Except for naphthalene, extraction efficiency for other PAHs was more than 80%. Therefore DCM was selected for extraction of PAHs from water. For extraction of PAHs, DCM has been used as the extracting solvent previously by many researchers (Wang
et al. 2001; Song et al., 2002). Extraction efficiency of naphthalene was found to be less compared to other PAHs both at higher and lower fortification level and it may be
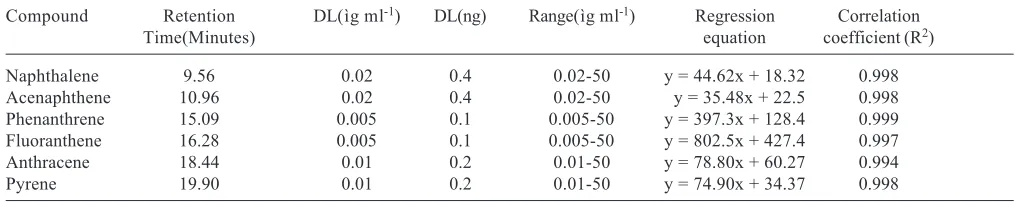
Table 1. Detection limit (DL) and calibration curves for the determination of different PAHs by HPLC-DAD
Compound Retention DL(ìg ml-1) DL(ng) Range(ìg ml-1) Regression Correlation
Time(Minutes) equation coefficient (R2)
Naphthalene 9.56 0.02 0.4 0.02-50 y = 44.62x + 18.32 0.998
Acenaphthene 10.96 0.02 0.4 0.02-50 y = 35.48x + 22.5 0.998
Phenanthrene 15.09 0.005 0.1 0.005-50 y = 397.3x + 128.4 0.999
Fluoranthene 16.28 0.005 0.1 0.005-50 y = 802.5x + 427.4 0.997
Anthracene 18.44 0.01 0.2 0.01-50 y = 78.80x + 60.27 0.994
Pyrene 19.90 0.01 0.2 0.01-50 y = 74.90x + 34.37 0.998
Table 2: Comparison of extracting solvent for recovery of PAHs from water
PAHs Fortification Level (mg L-1) Recovery (%)
Hexane Ethyl Acetate DCM
Naphthalene 0.01 66.37 66.23 71.33
0.1 67.11 66.83 70.27
Acenaphthalene 0.01 84.18 74.41 85.23
0.1 83.97 72.13 84.28
Phenanthrene 0.01 80.8 80.06 91.71
0.1 82.99 78.25 90.27
Fluoranthene 0.01 82.7 77.55 88.94
0.1 79.15 76.95 89.13
Anthracene 0.01 85.9 81.15 89.92
0.1 86.64 82.28 91.09
Pyrene 0.01 84.96 81.95 91.23
because of its high volatility. Zuloaga et al., 2009 also observed lower recovery for naphthalene from sediments compared to other PAHs.
Adsorption column chromatography was used for clean up. Different adsorbent like silica gel, alumina and florisil were tried. The result shows that maximum amount of PAHs (>85%) were recovered by using florisil as adsorbent column as compared to other adsorbent (Figure 2). Among all the PAHs, maximum amount was recovered for fluanthrene (97.2%) and minimum for pyrene (89.1%). Thus for the cleanup method florisil column with 20:80 acetone:hexane as eluting solvent (150 mL) was found suitable for the PAHs analysis. Pointo and Milliet, 2000 also used florisil column cleanup for PAHs extract using 10:90 v/v dichloromethane:hexane as the eluent. Sinclair and Frost, 1978 and Zuloaga et al., 2009 also used florisil column cleanup for PAHs analysis.
For method recovery, the fortified natural water (0.01 and 0.1 mg L-1) samples were extracted with DCM and cleaned up using florisil column with 20:80 acetone:hexane as the eluting solvent. The overall method recovery varied from 71.02-89.43% at 0.1 mg L-1 and 71.74-89.74% at 0.01 mg L-1 fortification level (Figure 3). More than 80.0% of extraction efficiency was noticed for all the PAHs except naphthalene (Figure 3). Maximum extraction efficiency was recorded for pyrene with an average value of 89.43-89.74% and minimum for naphthalene with an average value of 71.02-71.74%.
Method validation
Linearity and sensitivity of different PAHs in HPLC-DAD system
Detection limit (DLs) were calculated as being three times the average level of the baseline noise (measured from the injection of standard solutions mixture containing individual PAHs). For all the PAHs the HPLC-DAD detector system was found sensitive (Table 1) but was more sensitive to phenanthrene and fluoranthene (DL: 0.005 ìg ml-1) as compared to naphthalene and acenaphthene (DL: 0.02 ìg L-1). Calibration curves showed a linear relationship, between the concentration and peak area, with a correlation coefficient found in the range of 0.994 to 0.999 for 6 PAHs. Table 1 shows the values of the linearity range, regression equation and correlation coefficients for individual PAHs.
Figure1: HPLC chromatogram of standard PAHs mixture (5 µg mL -1) at 254 nm (dotted line indicates 1 µg mL-1 concentration) Peaks
identity: (1) Naphthalene; (2) Acenaphthene; (3) Phenanthrene; (4) Fluoranthene; (5) Anthracene; (6) Pyrene
Figure2: Recovery of PAHs from different adsorbent column
Accuracy and Precision of developed method
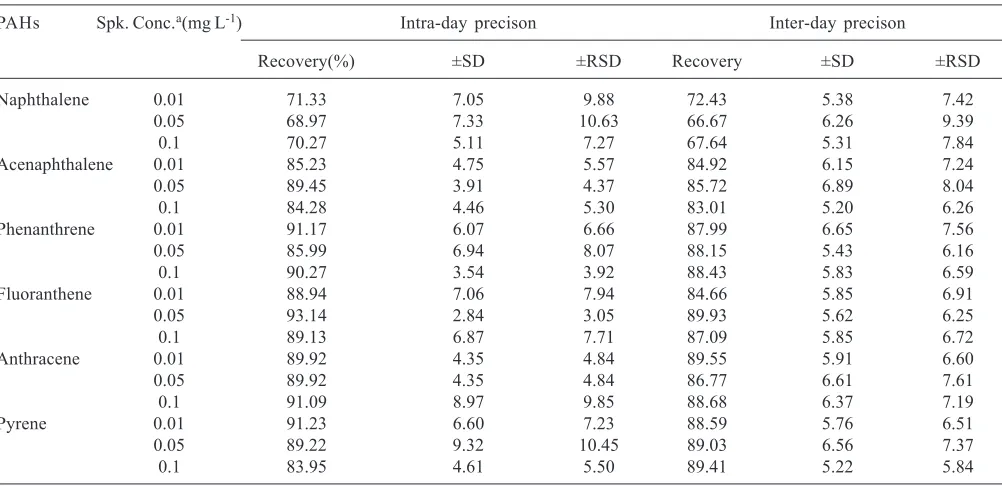
During the laboratory work intra-day and inter-day precision was assigned. For this purpose water samples spiked at three concentration levels (0.01, 0.05 and 0.1 mg L-1), extracted by developed method and were analysed by HPLC-DAD method. For determining the intra-day precision at three different concentration levels with six replicates for each level were analysed on same day. For determining the inter-day precision six replicates (at three different concentrations) were analysed over five consecutive days. The precision of the method developed was determined by calculating values of standard deviation (SD) and relative standard deviation (RSD) of the concentration for the determined compounds. The SD and RSD values were presented in Table 3 and its low values (<11% in all the cases) confirm the precision of the elaborated method.
The recovery of all the PAHs at three different spiking within the range of 68.93–93.14 % (n = 6) (Table 3). The low relative standard deviation values were in the range of ± 4.87-9.88 (at spiking level 0.1 mg L-1), ± 3.05-10.63 (at spiking level 0.5 mg L-1) and ± 3.92-9.85 (at spiking level 0.1 mg L-1) for all the 6 PAHs in the spiked samples signify the accuracy of the developed method.
LOD and LOQ of different PAHs
LOD and LOQ were calculated for each PAH and expressed in microgram per Litre. LOD and LOQ were found in the range of 0.1 to 1.5 (µg L-1) and 0.5 to 4 (µg L-1) respectively as shown in Table 4.
Table 4: LOD and LOQ of different PAHs
PAHs LOD(ìg L-1) LOQ(ìg L-1)
Naphthalene 1 3
Acenaphthene 1.5 4
Phenanthrene 0.2 0.5
Fluoranthene 0.1 0.6
Anthracene 0.4 1.5
Pyrene 0.4 1.2
Application of optimized method—analysis of real water sample
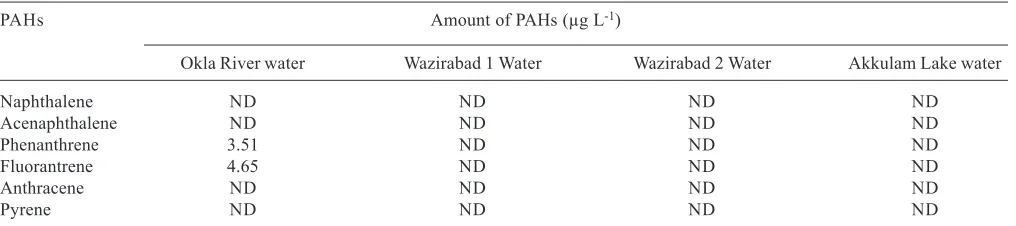
To establish the effectiveness and the acceptability of the developed method, surface water of different sources (river and lake water) were collected analyzed for the presence of PAHs. No residues of any of the PAHs under investigation were detected in the water samples collected from Wazirabad, Yamuna river and Aakulam lake (Table 5). Only the water sample collected from Yamuna river at Okhla
Table 3. Intra-day precision, inter-day precision and accuracy for developed method (n=6)
PAHs Spk. Conc.a(mg L-1) Intra-day precison Inter-day precison
Recovery(%) ±SD ±RSD Recovery ±SD ±RSD
Naphthalene 0.01 71.33 7.05 9.88 72.43 5.38 7.42
0.05 68.97 7.33 10.63 66.67 6.26 9.39
0.1 70.27 5.11 7.27 67.64 5.31 7.84
Acenaphthalene 0.01 85.23 4.75 5.57 84.92 6.15 7.24
0.05 89.45 3.91 4.37 85.72 6.89 8.04
0.1 84.28 4.46 5.30 83.01 5.20 6.26
Phenanthrene 0.01 91.17 6.07 6.66 87.99 6.65 7.56
0.05 85.99 6.94 8.07 88.15 5.43 6.16
0.1 90.27 3.54 3.92 88.43 5.83 6.59
Fluoranthene 0.01 88.94 7.06 7.94 84.66 5.85 6.91
0.05 93.14 2.84 3.05 89.93 5.62 6.25
0.1 89.13 6.87 7.71 87.09 5.85 6.72
Anthracene 0.01 89.92 4.35 4.84 89.55 5.91 6.60
0.05 89.92 4.35 4.84 86.77 6.61 7.61
0.1 91.09 8.97 9.85 88.68 6.37 7.19
Pyrene 0.01 91.23 6.60 7.23 88.59 5.76 6.51
0.05 89.22 9.32 10.45 89.03 6.56 7.37
0.1 83.95 4.61 5.50 89.41 5.22 5.84
a
region contained residues of phenanthrene (3.51 µg L-1) and fluoranthrene (4.61 µg L-1) which is higher than the guide line value for PAHs in drinking water (0.2 µg L-1) (Malik et al., 2004). This may be due to the fact that compared to other sampling areas, Okhla is an industrial area and PAHs are the compounds mainly generated from industrial wastes (Saha et al., 2009). Agarwal et al., (2006) also reported the residues of PAHs in bank sediment of river Yamuna in Delhi. The concentrations below the limit of detection were considered as not detected (ND).
Conclusions
The developed method offers an efficient, cost effective, easy sample preparation procedure for the simultaneous determination of 6 PAHs in water sample. The developed method showed that, LLE was adequate and efficient for extraction of all compounds except naphthalene. The apparatus required for extraction is relatively simple and cheap compared to other sophisticated extraction methods. Correlation coefficient, recovery percentage and precision were high in this study, which specify the reproducibility and accuracy of the extraction method. Moreover, the results of study imply that some of the PAHs may often be found in surface water sample, representing the need to evaluate effective and continuous monitoring system for more severe PAHs contamination in water in the future.
References
Agarwal, T., Khillare, P.S. and Shridhar, V., 2006. PAHs contamination in bank sediment of the Yamuna River, Delhi, India. Environmental Monitoring and Assessment 123:151-166. APHA, AWWA, WPCF. 1992. Me´todos normalizados para el ana’lisis
de aguas potables y residuales, Dý´az de Santos S.A.: Madrid,
Espan˜a, (In spanish).
Bjorseth, A., 1983. Handbook of Polycyclic Aromatic Hydrocarbons. 1-727 p, Marcel Dekker, New York.
Budzinski, H., Jones, I., Bellocq, J., Pierard, C. and Garrigues, P.,
1997. Evaluation of sediment contamination by polycyclic aromatic hydrocarbons in the Gironde Estuary. Marine Chemistry58: 85-97.
Choduhury, M and Rakshit, A., 2012. Chemical aspects of ground water quality in the shallow aquifers in selected districts of eastern Uttar Pradesh. International Journal of Agriculture Environment and Biotechnology5: 345-351.
EPA, 2002. Method 610, Methods for Organic Chemical Analysis of Municipal and Industrial Wastewater, Polynuclear Aromatic Hydrocarbons, Appendix A to Part 136 of Title 40 CFR. Environmental Monitoring Systems Laboratory, Ofûce of Research and Development; U.S. Environmental Protection Agency: U.S. Government Printing Ofûce.
Fetzer, J.C., 1989. Chemical Analysis of Polycyclic Aromatic Compounds. 1-59 p, Wiley, New York.
Guzzella, L., Roscioli, C., Vigano, L., Saha, M., Sarkar, S.K. and Bhattacharya, A., 2005. Evaluation of the concentration of HCH, DDT, HCB, PCB and PAH in the sediments along the lower stretch of Hugli estuary, West Bengal, Northeast India. Environmental International 31: 523-534.
Handley, A.J. ,1999. Extraction methods in organic analysis. 3 p, Sheffield Academic Press, Sheffield.
Lighty, J.S., Vernath, J.M. and Sarofim, A.S., 2000. Combustion aerosols: factors governing their sie and composition and implications to human health. Journal of the Air and Waste Management Association50: 1565-1618.
Lodovici, M. and Venpurini M., 2003. PAHs air levels in florence, Italy and their correlation with other air pollutants. Chemosphere50: 377-382.
McCready, S., Slee, D.J., Birch, G.F. and Taylor, S.E., 2000. The distribution of polycyclic aromatic hydrocarbons in surficial sediments of Sydney Harbour, Australia. Marine Pollution Bulletin 40: 999-1006.
Pointo, L.J. and Moore, M.M., 2000. Release of polycyclic aromatic hydrocarbons from contaminated soils by surfactant and remediation of this effluent by Penicillium spp. Environmentalt Toxicology and Chemistry 19: 1741-1748.
Saha, A., Gajbhiye, V.T., Gupta S. and Rajesh., K., 2012. Development of multi-residue method for the determination of pesticicide residues in river, ground and lake water in Delhi using gas chromatography. International Journal of Agriculture Environment and Biotechnology 5: 199-205.
Table 5. PAHs residues in the surface water collected from different places
PAHs Amount of PAHs (µg L-1)
Okla River water Wazirabad 1 Water Wazirabad 2 Water Akkulam Lake water
Naphthalene ND ND ND ND
Acenaphthalene ND ND ND ND
Phenanthrene 3.51 ND ND ND
Fluorantrene 4.65 ND ND ND
Anthracene ND ND ND ND
Pyrene ND ND ND ND
Saha, M., Togo, A., Mizukawa, K., Murakami, M., Takada, H., Zakaria, M.P. Chiem, N.H., Tuyen, B.C. and Tana, T.S., 2009. Sources of sedimentary PAHs in tropical Asian waters: Differentiation between pyrogenic and petrogenic sources by alkyl homolog abundance. Marine Pollution Bulletin58: 189-200.
Schmit, J.A., Henry, R.A., Williams, R.C. and Dieckman, J.F., 1971. Applications of high speed reversed-phase liquid chromatography. Journal of Chromatographic Science9: 645-51.
Sinclair, N.M. and Frost, B.E., 1978. Rapid method for the determination of benzo(a)pyrene in the particulate phase of cigarette smoke by HPLC with fluorimetric detection. Analyst
103: 1199-1203.
Song, Y.F., Jing, X., Fleischmann, S., Wilke, B.M., 2002. Comparative study of extraction methods for the determination of PAHs from contaminated soils and sediments. Chemosphere48: 993-1001.
Stout, S.A., Uhler, A.D. and Emsbo-Mattingly, S.D., 2004. Comparative evaluation of background anthropogenic hydrocarbons in surficial sediments from nine urban waterways. Environmental Science and Technology38: 2987-2994.
Sun, F., Littlejohn, D., Gibson, M. D., 1998. Ultrasonication extraction and solid phase extraction clean-up for determination of US EPA 16 priority pollutant polycyclic aromatic hydrocarbons in soils by reversed-phase liquid chromatography with ultraviolet absorption detection. Analytica Chimica Acta364: 1-11.
Titato, G.M. and Lancas, F.M., 2005. Comparison between different extraction (LLE and SPE) and determination (HPLC and capillary–LC) techniques in the analysis of selected PAHs in water samples. Journal of Liquid Chromatography & Related Technologies28: 3045-3056
Titato, G.M. and Lancas, F.M., 2006. Optimization and validation of HPLC–UV-DAD and HPLC–APCI–MS methodologies for the determination of selected PAHs in water samples. Journal of Chromatographic Science44: 35-40.
USEPA, EPA National Drinking Water Standards. http:// w w w. f o r e v e r p u r e . c o m / d o w n l o a d s / t e c _ r e f _ E PA _ drinking_water_standard.pdf
Wang, X.C., Zhang, T.X. and Chen, R.F., 2001. Distribution and partitioning of polycyclic aromatic hydrocarbons (PAHs) in different size fractions in sediments from Boston Harbour, United States. Marine Pollution Bulletin42: 1139-1149. Woodhead, R.J., Law, R.J. and Matthiessen, P., 1999. Polycyclic
aromatic hydrocarbons in surface sediments around England and Wales, and their possible biological significance. Marine Pollution Bulletin 38: 773-790.