DOI: 10.5958/2230-732X.2016.00111.X
©2016 New Delhi Publishers. All rights reserved
FOOD SCIENCE
Optimization and Storage Study of Banana Chocolate
Yogesh Kumar Rathor
1, Smita Singh*
2, Sudhir Kumar
3and Rajendra Kumar Pandey
2 1SPAR Hypermarket Pvt. Ltd., New Delhi-58, India2Department of Animal Husbandry & Dairying, Institute of Agricultural Sciences, Banaras Hindu University, Varanasi, U.P. India 3Centre of Food Science & Technology, Institute of Agricultural Sciences, Banaras Hindu University, Varanasi, U.P. India
*Corresponding author: [email protected]
Paper No. 514 Received: 21-3-2016 Accepted: 7-10-2016
Abstract
Optimization of the process was done by using response surface methodology (RSM) for the development of banana chocolate. Sensory evaluation was performed by a semi-trained panel of 9 members on the basis of product’s color, body and texture and flavor. Statistical analysis showed that all the responses were significantly affected by independent variables. The banana chocolate was developed using the derived optimum processing conditions to check the validity of the quadratic model. The recommended optimum range for the development of banana chocolate is banana, cocoa powder and milk powder as 15-30g, 5-10g and 20-40g, respectively. Storage study of banana chocolate was performed at 2οC, 10οC and 25οC; storage at 2οC proved to be the best optimized storage condition.
Highlight
• Banana chocolate simultaneously provides the benefits of fruit (banana) and properties of chocolate to collectively provide vitamins and minerals as well as combat with free radicals produced inside the body.
Keywords: Banana, chocolate, response surface methodology, sensory evaluation, storage study
Banana is one of the major fruit crop grown in India. It is the most consumed fruit in tropical and sub-tropical regions. India stands first in the production of banana after mango and in respect of area; it stands at second position in the world. There are two broad groups of bananas: dessert bananas, which can be eaten raw or cooked; and plantains, which are starchy and must be cooked before eating. Aripe banana contains as high as 18 per cent reducing sugars which may be fermented under suitable conditions to alcohol. The alcohol obtained may, in turn, be oxidized to form acetic acid or vinegar. Banana is consumed in various forms of delicious dishes. They are eaten in deep fried form, baked in their skin in a split bamboo, or steamed in glutinous rice wrapped in a banana leaf. Bananas are very popular as jams and pancakes among people of South Asia and South-East Asia. Banana is a rich source of calcium and antioxidants.
It stabilizes blood sugar and reduces the risk of nausea. Banana also acts as a pre-biotic which stimulates the growth of friendly bacteria in the bowel. Banana is a rich source of iron which helps to fight against anemia.
(Cordero-Herrera et al. 2015) and anti-platelet effects (Peluso et al., 2015). It has been found that stearic acid imparts a neutral cholesterolemic response (Steinberg et al., 2003) which restricts the increase in the cholesterol level. It has also been reported that polyphenols of chocolate inhibits low-density lipoprotein (LDL) oxidation. This combination of banana chocolate is still underneath in the market. The growing need of functional foods is increasing in demand day-by-day. Therefore, there is a need to produce this combination of banana chocolate to ensure the positive health attributes to children as well as to adults.
Materials and Methods
The present work was carried out in the “Centre
of Food Science and Technology”, Institute of Agricultural Science, Banaras Hindu University, Varanasi. Banana chocolate was prepared using
ripe banana, cocoa powder, skim milk powder and sugar. All the ingredients were purchased from the
local market of Varanasi, India. Cocoa butter and
sodium alginate were taken from the laboratory of
CFST, BHU, Varanasi.
Processing of Banana Chocolate
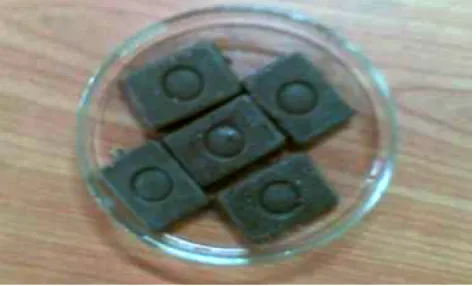
Desired amount of cocoa butter was heated at 100°C for its melting and cocoa powder was mixed in it homogenously. Sugar solution was prepared and milk powder was later added to it. The paste was blended in the grinder and banana was added into it. Milk powder, sugar solution and banana were mixed to obtain homogenous and smooth paste. Then, it was tempered manually on a cool surface. Immediately, the mixture was poured into the mould and was refrigerated at 3oC for proper
crystallization of chocolate (Fig. 1).
Experimental Design
This study involves the application of response surface methodology (RSM) that involves design of experiments (DOE), selection of levels of variables in experimental runs, fitting mathematical models and finally selecting variable levels by optimizing the response (Khuri and Cornell 1987).The experiments
were designed comprising of three independent variables by applying a central composite rotatable
design (CCRD) (Table 1). Three factors, viz., banana, milk powder and cocoa powder were taken into
account and twenty experiments were performed for the analysis.
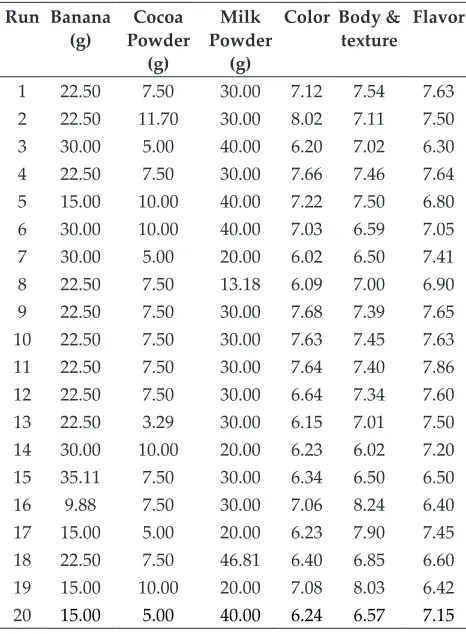
Table 1: Experimental values of the suggested solution of Banana Chocolate by design expert 9.0.2
Run Banana
(g) Powder Cocoa (g)
Milk Powder
(g)
Color Body & texture Flavor
1 22.50 7.50 30.00 7.12 7.54 7.63
2 22.50 11.70 30.00 8.02 7.11 7.50
3 30.00 5.00 40.00 6.20 7.02 6.30
4 22.50 7.50 30.00 7.66 7.46 7.64
5 15.00 10.00 40.00 7.22 7.50 6.80 6 30.00 10.00 40.00 7.03 6.59 7.05
7 30.00 5.00 20.00 6.02 6.50 7.41
8 22.50 7.50 13.18 6.09 7.00 6.90
9 22.50 7.50 30.00 7.68 7.39 7.65
10 22.50 7.50 30.00 7.63 7.45 7.63 11 22.50 7.50 30.00 7.64 7.40 7.86 12 22.50 7.50 30.00 6.64 7.34 7.60 13 22.50 3.29 30.00 6.15 7.01 7.50 14 30.00 10.00 20.00 6.23 6.02 7.20 15 35.11 7.50 30.00 6.34 6.50 6.50
16 9.88 7.50 30.00 7.06 8.24 6.40
17 15.00 5.00 20.00 6.23 7.90 7.45 18 22.50 7.50 46.81 6.40 6.85 6.60 19 15.00 10.00 20.00 7.08 8.03 6.42
20 15.00 5.00 40.00 6.24 6.57 7.15
Statistical Analysis
Statistical analysis was done by central composite Rotatable Design method using a commercial statistical software package design expert 9.0.5. Analysis of variance (ANOVA) was performed on experimental data for fitting the model represented by equation 1 to examine the statistical significance of model terms. Data obtained from Anova is shown in Table 3.
Yk = f (A, B, C) (1)
parameter is a second order polynomial equation of the form described below:
Yk = βo + ∑βi Xi + ∑βii + X² + ∑βijXiXj
Where,Yk = Response,
βo , βi , βii and βij= constant, linear, quadratic and cross product regression coefficients.
Xi’s = actual value of the independent variables Mathematical model was evaluated for each response using multiple regression analysis. The modeling was started with quadratic model including linear, square and interaction terms. Significant term in the model for each response were found by analysis of variance (ANOVA) and significance was judged by F statistic calculated from the experimental data. Model adequacies were checked by R2, Adj-R2, pred-R2. After model fitting, residual analysis including the examination of diagnostic plots and calculation of case statistics were conducted to validate assumption used on each response and to fit polynomial model to experimental data. Statistical significance (p<0.05) of all main effect was determined and regression coefficient of proposed model were calculated.
Sensory Analysis
The chocolate samples were evaluated for their color and appearance, flavor and body and texture. The analysis was performed by a panel of semi-trained members including 9 members from staff and doctoral students of the Centre of Food Science and Technology, BHU, Varanasi, India. The results were taken on hedonic scale ranging from 1 to 9, where 1 represented dislike extremely and 9 represented like extremely (Lawless and Hayman 1998).
Results and Discussion
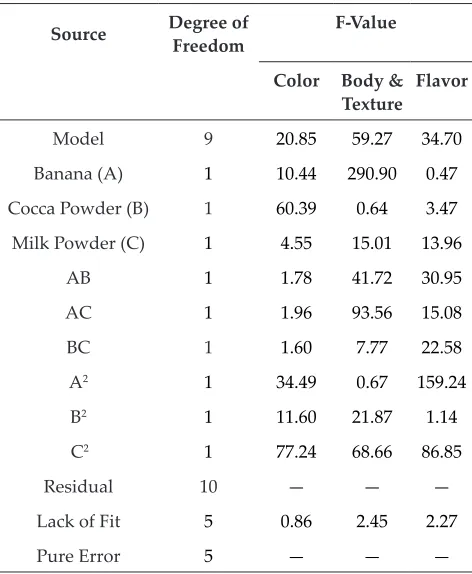
Analysis of variance (ANOVA) and regression analysis were used to examine the statistical significance of the model. It was observed that the lack-of-fit test (F values) for all the models were
insignificant (Fcal<Ftab), implying that the models were accurate enough to predict the responses (Table 2).
Optimization
The optimization was applied for selected range of banana, cocoa powder and milk powder as 15-30g, 5-10g and 20-40g, respectively. In this study, the level of banana was maximized since the main aim of this study is to prepare minerals and fiber rich chocolate, while cocoa powder and milk powder are kept in the range. The constraints fixed for all the variables and responses are presented in Table 4. Keeping all the responses in range, numerical optimization technique was applied using Design Expert Software 9.0.2. By applying desirability function method, 1 solution was obtained for the optimum covering criteria with highest desirability 0.742.
Table 3: ANOVA for different predicted models for responses
Source Degree of Freedom F-Value
Color Body & Texture Flavor
Model 9 20.85 59.27 34.70
Banana (A) 1 10.44 290.90 0.47 Cocca Powder (B) 1 60.39 0.64 3.47
Milk Powder (C) 1 4.55 15.01 13.96
AB 1 1.78 41.72 30.95
AC 1 1.96 93.56 15.08
BC 1 1.60 7.77 22.58
A2 1 34.49 0.67 159.24
B2 1 11.60 21.87 1.14
C2 1 77.24 68.66 86.85
Residual 10 — — —
Lack of Fit 5 0.86 2.45 2.27
Pure Error 5 — — —
Table 2: Predicted score of suggested optimized formulation of banana chocolate
No. Banana Cocoa
powder powderMilk Color Body & texture Flavor Grain-iness Mouth feel Desira-bility
Sensory Evaluation
Effect on Color
The average color score of banana chocolate varied from6.02 to 8.02 (Table 1) and the data were fitted in quadratic model as presented below:
Color = - 1.65213 + 0.23279 × A + 0.63310 × B + 0.24376 × C – 5.26667E - 003 × AB + 1.38333E-003 × AC + 3.75000E-003 × BC – 5.76005E-003 × A2 - 0.030062 × B2 – 4.84870E-003 × C2 Where, A is banana, B is Cocoa powder and C is milk powder.
The coefficient estimation of color showed that levels of banana and milk powder had a negative effect on the color. Only the levels of cocoa powder exhibited a positive effect on banana chocolate. In quadratic model, A & B were found significant. The quadratic model for color was found significant (p<0.0001). The coefficient of determination (R²) was 0.9494 and the adequate precision was 12.571. Fig. 2 shows the response surface plot for color as influenced by milk powder and banana levels. It is obivious from figure that increasing the level of milk powder first increased the sensory score of color upto 30, but then it decreased slightly. The addition of banana made a slight increase in the sensory score. Fig. 3 shows the response surface plot for color as influenced by cocoa powder and banana levels.
It can be seen from the figure that there was a negative effect on color of banana chocolate due to banana and even the increasing level of the item considerably increased the sensory score for color, but then decreased slightly. Fig. 4 shows the response surface plot for color as influenced by cocoa powder and milk powder levels. It is evident from the figure that there was a negative effect on color of banana chocolate with an increase in the level of milk powder, as first it got increased, but
then decreased gradually. The color of chocolate increased with increasing the level of cocoa powder.
Effect on body and texture
The average body and texture score of banana chocolate varied from6.02 to 8.24(Table 1) and the data were fitted in quadratic model as mentioned below:
Body & texture = + 7.71746 - 0.096772 × A + 0.49611 × B - 0.012588 × C – 0.013133 × AB + 4.91667E-003 × AC + 4.25000E-4.91667E-003 × BC – 4.12906E-004 × A2 – 0.021252 × B2 – 2.35358E-003 × C2 The quadratic model for body and texture was found significant (p<0.0001). The coefficient of determination (R²) was 0.9816 and the adequate precision was 29.448. The coefficient estimation of body and texture showed that the levels of banana and milk powder had a negative effect on the body and texture. Only levels of cocoa powder had positive effect on the body and texture of banana chocolate. In quadratic model A and B were found significant. Fig. 5 shows the response surface plot for body and texture as influenced by milk powder and banana levels. It is obvious from the figure that there was a slight increase in the body and texture of banana chocolate due to milk powder.
The increasing level of banana showed a little decrease in the body and texture of banana chocolate. Fig. 6 exibits the response surface plot for body and texture as influenced by cocoa powder and banana levels. It can be seen from the figure that with increasing level of banana, there was slight decrease in sensory score of body and texture. Contrary to this, the increasing levels of cocoa powder increased sensory score of body and texture. Fig. 7 reflects the response surface plot for body and texture influenced by cocoa powder and milk powder levels. It is evident from the figure that the increasing level of cocoa powder ,very slightly increased the sensory score of body and texture in
Table 4: Constraints fixed for optimization of Banana powder, Milk powder & Cocoa powder levels in Banana Chocolate
Name Goal Lower Limit Upper Limit Lower Weight Upper Weight Importance
A:Banana Maximize 15 30 1 1 3
B:Cocoa Powder is in range 5 10 1 1 3
banana chocolate. The addition of milk powder also imparted very slight increase in the sensory score of body and texture of banana chocolate.
Effect on flavor
The average graininess score of banana chocolate varied from6.3 to 7.86 (Table 1) and data recorded during experimental were fitted in quadratic model as given below:
Flavour = + 3.99302 + 0.29850 × A – 0.47609 × B + 0.15614 × C + 0.012800 × AB -2.23333E-003 × AC + 8.20000E-003 × BC – 7.21087E-003 × A2 – 5.50085E-003 × B2 – 2.99545E-003 × C2 The positive coefficient for milk powder, banana and cocoa powder indicated that with increasing levels of this powder, there was an increased in the flavor of banana chocolate. The quadratic model for flavor was found significant (p<0.0001).
Fig. 1: Flowchart for banana chocolate preparation
Fig. 2: Color as influenced by levels of milk powder and
banana
Fig. 3: Color as influenced by levels of cocoa powder and
banana
chocolate and milk powder levels. It can be seen from figure that there was a positive effect of both ingredients on flavour in banana chocolate. The increasing levels of milk powder first increased the flavor of banana chocolate then, decreased slightly. The increase in banana level, however, first increased considerably, then decreased very slightly the flavour of chocolate. Fig. 9 shows the response surface plot for flavor as influenced by banana and cocoa powder levels. It is obvious from the figure that there was a negative effect of both ingredients on flavour of banana chocolate.
Fig. 4: Color as influenced by levels of cocoa powder and milk powder
Fig. 5: Body and texture as influenced by levels of milk
powder and banana
Further it was noted that the increasing level of cocoa powder decreased the flavor and addition of banana first increased the flavour of chocolate and then continuosly decreased. Fig. 10 shows the response surface plot for flavour as influenced by milk powder and cocoa powder levels.It can be seen from the figure that there was a slight increase in
flavour of banana chocolate and then, decereased slightly. It was also noted that the increasing levels of cocoa powder decreased the flavor of the chocolate.
Fig. 6: Body and texture as influenced by levels of cocoa
powder and banana
Fig. 7: Body and texture as influenced by level of cocoa powder and milk powder
Fig. 8: Flavour as influenced by levels of milk powder and
Fig. 9: Flavour as influenced by levels of cocoa powder and
banana
Fig. 10: Flavour as influenced by levels of cocoa powder and milk powder
Effect on Color
The change in color was measured by the semi trained sensory panel using 9 point hedonic scale. The sensory score of color decreased linearly in the chocolate sample at temperature 25°C and decrease in color was observed continuously up to one month (Graph 1).
No visible color was visualized and observed in sample stored at 10°C up to 7 days and there after a slight degradation in color was visible. Very less change in color was observed in chocolate at temperature 2°C up to one month storage.
Effect on body & texture
The change in body and texture was measured by the semi trained sensory panel using 9 point
hedonic scale. The sensory score of body and texture degraded within 7 days in the chocolate sample at temperature 25°C (Graph 2). Very less change in body and texture was observed in chocolate at temperature 2°C up to one month of storage. Degradation in body and texture at 25°C was observed within 7 days, while at 10°C degradation started after 14 days. Degradation in body and texture was observed very fast at 25°C and it continued till one month of storage.
Graph 1: Effect of temperature on color during storage of banana chocolate
Graph 2: Effect of temperature on body and texture during storage of Banana chocolate
Effect on Flavor
The change in flavor was measured by the semi trained sensory panel using 9 point hedonic scale. Very less change in flavor was observed in chocolate up to one month storage at temperature 2°C (Graph 3). Flavor decreased linearly in the chocolate sample at temperature 25°C, and decrease in flavor was observed continuously up to one month. No change in flavor was observed in sample stored at 10°C upto 7 days and there after a slight degradation in flavor was observed.
Acknowledgements
We express our sincere gratitude to the Professors of Centre of Food Science and Technology for their proper guidance and complete support in the completion of this research work.
References
Awua, P.K. 2002. Cocoa processing and chocolate manufacture in Ghana. Essex, UK: David Jamieson and Associates Press Inc.
Beckett, S.T. 2000. The Science of chocolate. Royal Society of chemistry paperbacks.
Cordero-Herrera, I., Martin, M.A., Escriva, F., Alvarez, C., Goya, L. and Ramos, S. 2015. Cocoa-rich diet ameliorates hepatic insulin resistance by modulating insulin signaling and glucose homeostasis in Zucker diabetic fatty rats. The Journal of Nutritional Biochemistry26(7): 704-712.
Giacometti, J., Muhvic, D., Pavletic, A. and Dudaric, L. 2016. Cocoa polyphenols exhibit antioxidant, anti-inflammatory, anticancerogenic, and anti-necrotic activity in carbon tetrachloride-intoxicated mice. Journal of Functional Foods23: 177-187.
Khuri, A.I. and Cornell, J.A. 1987. Response surfaces: designs and analyses, Marcel Dekker, Inc. New York, NY, USA. Lawless, H.T., Heymann, H. 1998. Sensory Evaluation of Food:
Principles and Practices. New York: Chapman & Hall. Peluso, I., Palmery, M. and Serefini, M. 2015. Effect of cocoa
products and flavanols on platelet aggregation in humans: A systematic review. Food & Function6: 2128-2134. Steinberg, F.M., Bearden, M.M. and Keen, C.L. 2003. Cocoa
and chocolate flavonoids: Implications for cardiovascular health. Journal of the American Dietetic Association 103: 2 215-223.