Analysis of Production Loss and Way to Increase
Productivity in a Particular Knitting Floor
Dip Das, Md. Shamsuzzaman Rasel*, Malaz Rahman Khan
Department of Textile Engineering, World University of Bangladesh, Dhaka, Bangladesh
Abstract
This research recommends a way to improve the productivity of a particular knitting floor. A knitting floor might be standstill due to various reasons that should resolve problems before and on the time of its arising immediately unless factory would get huge loss for that. In this research, production data of five days for 20 different types of the knit machine were recorded and compared with the target production. Most of the cases, the production efficiency were found around 10-30% lower than the targeted one since no mentioned steps have been implemented then. Surprisingly, when the mentioned steps have been implemented steps by steps, factory has started to receive around 80-90% efficiency on target production and a 10-30% extra production than the regular production. The best production rate has been observed when machine has faced less no. of program changed and better quality of yarn is supplied. Besides, knitting floor environment, relief from pressure and tension upon the machine operator also plays a very significant role here.Keywords
Knit fabric, Knit machine, Productivity, Efficiency, Necessary steps1. Introduction
1.1. Introduction
The knit fabric is considered as one of the most popular, comfortable and largest readymade ware sector throughout the world. A continuous length of yarn is converted into vertically intermeshed loops by machine in knitted by using needle, sinker and thread [1]. Although knit fabrics are of two types basically; i) warp knit and ii) weft knit, the demand of weft knit fabric is increasing day by day because of its higher production rate, lower cost, higher quality of the fabric and easy machinery and design instalment [2]. A wide range of weft knitted fabric structure has been possible to produce with circular knitting machine after some changes such as the following four types; a) single jersey, b) rib, c) interlock and d) purl. Among the mentioned types of knit structure, purl structure has been declining day by day for its complexity and higher production cost. On the other hand, the popularity of other fabric types is increasing significantly for its structure varieties and lower production cost [3]. Due to air permeability and stretchable, knitted fabrics takes less time than woven items. Additionally, knitted fabrics have a wide range of garments versatility from hosiery, formalwear
* Corresponding author:
shamsuzzaman_tex@yahoo.com (Md. Shamsuzzaman Rasel) Published online at http://journal.sapub.org/textile
Copyright©2019The Author(s).PublishedbyScientific&AcademicPublishing This work is licensed under the Creative Commons Attribution International License (CC BY). http://creativecommons.org/licenses/by/4.0/
and casual wear, sleeping wear, leisurewear, underwear, sweaters, slacks, sportswear, and other home furnishings [4-5].
The production rate and efficiency of the weft knitting machine depend largely on the knitting parameters, yarn quality and the skills of the operators. The knitting parameters includes gauge, needle type, cam-type, yarn feeding system, number of feeders, takedown system, cloth rolling or spreading, monitoring, control systems, stitch length, tension of feeding yarn, no. of knit program and rpm of the machine, maintenance and servicing of the machines. Moreover, the types of yarn (card/comb) and the count of yarn influence per day production. Besides, the mental pressure and the performance rate of the machine operators play a vital role also [4,6]. Poor maintenance of machinery and fabric handling also causes serious reason for production loss. That’s why actual production always recorded as lower than the calculated production [6]. During production of knit fabrics, a wide range of faults arises and kill the productive time, as a result, production hampered.
Due to that negative impact, several measures are present right now to minimize the loss; for example, checking needles, sinkers and cam; surveillance systems of faults detection implemented; uses of vision and optical devices for inspection has increased. Therefore, an established lean system has been introduced to resolve those problems and consequently productivity has been increased [7].
types of production, strong monitoring along with the mentoring and ensuring the proper uses of the capacities can improve the production of a knitting floor.
1.2. Objectives
i) To analyze the regular production of the knitting floor of 5 days
ii) To analyze the productivity of the knitting floor of 5 days after implementation of necessary steps
iii) To compare the impact of changes on the efficiency of the knitting productivity
2. Materials and Methods
2.1. Materials
This research has been carried out at Fakir Knit Apparels Ltd, Narayongonj, Bangladesh. A specific knitting floor was brought into consideration. The survey and records of data have been conducted by analysing 20 different knitting machines for specific types of production of knit fabric. Each individual machine has been given a production target on the basis of the constant machine diameter and gauge; types and count of yarn count and RPM. For target calculation, the following formula has been considered and calculated.
Production/ day (22 hour) in kg at 100% efficiency (Target Production)
= 𝜋 𝑑𝑔 ×𝑁𝑜.𝑜𝑓 𝑓𝑒𝑒𝑑𝑒𝑟 ×𝑆.𝐿.×𝑅𝑃𝑀 ×60 ×2210 ×2.54 ×36 ×840 ×𝐶𝑜𝑢𝑛𝑡 ×2.2046
2.2. Machine Analysis
Table 1. Knitting machine parameters analysis
M/C no.
M/C diameter
× gauge Yarn Count
Fabric Types
Stitch Length Mm
RPM of M/C
Target Production, kg (22 hours)
1. 32 × 24 34 +20D Lycra L/S/ Jersey 2.90 20 308
2. 30 × 24 34+20D Lycra L/S/ Jersey 2.90 20 308 3. 38 × 24 30+40D Lycra L/S/ Jersey 3 .10 20 534
4. 38 × 24 30+40D Lycra L/S/ Jersey 3 .10 20 534
5. 38 × 18 34 1 × 1 Rib 2.55 18 344
6. 38 × 18 30+20D Lycra 1 × 1 Ly Rib 2.80 18 428
7. 32 × 18 24+70D Lycra 2 × 1 Ly Rib 2.90 19 276 8. 36 × 18 28+70D Lycra 2 × 1 Ly Rib 2.85 20 310
9. 38 × 24 40 Inter lock 1.50 18 217
10. 38 × 24 40 Inter lock 1.50 18 217
11. 34 × 24 34 Inter lock 1.65 20 264
12. 34 × 24 34 Inter lock 1.65 20 264
13. 36 × 20 34+16+75D Fleece 4.7+1.8+3.25 20 349
14. 36 × 20 30+14+75D Fleece 4.8+1.8+3.35 20 387 15. 34 × 20 34+16+75D Fleece 4.7+1.8+3.25 20 366
16. 34 × 20 34+16+75D Fleece 4.7+1.8+3.25 20 366 17. 32 × 24 30 +40D Lycra L/Terry Fleece 3.10+1.30 20 265 18. 32 × 24 30 +40D Lycra L/Terry Fleece 3.10+1.30 20 265
19. 32 × 24 30 +40D Lycra L/Terry Fleece 3.10+1.30 20 265 20. 32 × 24 30 +40D Lycra L/Terry Fleece 3.10+1.30 20 265
2.3. Methods of Data Calculation
For collection and calculation of data, there are three consecutive steps has been taken for each individual machine that has been considered as a test machine.
i) Target production calculated according to the formula ii) Actual production has been recorded as data of five (5)
days before implementing necessary steps
iii) Actual production has been recorded as data of five (5) days after implementing necessary steps
2.4. Steps have been Taken
After collecting the production data of 5 days, the following steps have been taken to higher productivity. After ensuring such steps, second phase data has been recorded.
i) Reduced no. of program
ii) Ensured good quality knitting yarn
For data of 5 days before implementation, the factory was used to carded yarn for knit the program. However, combed yarn was supplied during the data collection of 5 days after that.
iii) Servicing of the knit machine
After collecting prior data of 5 days every knit machine were brought into under servicing before going to the second phase of analysis.
iv) Overhead removed from the employee
During the second phase of analysis, each operator of the machine was freed from any excessive pressure and load to them.
v) Motivation and Training
Operators were motivated and trained to develop the productivity of the machine.
vi) Supply of roll marking label
A label of roll marking has been given to the operator so that they do not have to stop machine during roll marking.
vii) Removal of loose yarn
Loose yarn causes tensioning problems. So, such types of yarn were avoided.
viii) Environment of the floor
It has been ensured to be free from any unnecessary yarns, sacks, fabric rolls etc. from the knitting floor. As a result, the floor environment was good enough to keep more concentration on production.
3. Results and Discussion
3.1. Determination of Production Efficiency of Jersey Machine
The below table 2 has shown the production of 4 Jersey machine before implementing any steps where Ly S/J fabric was produced. Besides, table 3 has shown the knitting machine data after mentioned steps have been implemented.
Table 2. Production data of Lycra Single Jersey fabric (Before
implementation)
Parameters M/c 01 M/c 02 M/c 03 M/c 04
No. of Program 4 3 4 3
Target per day, kg 308 308 534 534
Day-1, kg 242 290 486 377*
Day-2, kg 292 245 434 466
Day-3, kg 235* 224* 476 472
Day-4, kg 279 282 338* 448
Day-5 237* 236* 423 453
Average Production,
kg (5 days) 257 255 431 443
Efficiency (%) 83.4% 82.8% 80.7% 83.0%
Remarks L/S/J L/S/J L/S/J L/S/J
* Program changed
Table 3. Production data of Lycra Single Jersey fabric (After
implementation)
Parameters M/c 01 M/c 02 M/c 03 M/c 04
No. of Program 2 2 1 1
Target per day, kg 308 308 534 534
Day-1, kg 264** 288 492 473
Day-2, kg 317 242* 434** 472
Day-3, kg 253* 234** 506 386**
Day-4, kg 283 295 512 476
Day-5 270 292 498 489
Average Production,
kg (5 days) 278 270 488 459
Efficiency (%) 90.2% 87.7% 91.4% 86 %
Remarks L/S/J L/S/J L/S/J L/S/J
*Program changed, **Lycra Changed
From the above two data table 2 and 3, the following graph 1 can be plotted. The graph has shown higher production efficiency after implementing the necessary steps that have been taken into considerations than conventional. It is found around 13-20% lower production efficiency when knitting floor was running as usual. Experimentally, the mentioned steps have been increased production efficiency by a great number (4-10%), more specifically, 105 kg, 75 kg, 285 kg and 80 kg Lycra Single Jersey fabric production increased for machine 1, machine 2, machine 3 and machine 4 respectively after 5 days at that particular knitting floor. So, it can be decided that the production of Lycra Single Jersey fabric has upward inclination i.e. higher production efficiency after implementing the necessary steps.
Figure 1. Efficiency analysis of the Lycra Single Jerseyfabric
3.2. Determination of Production Efficiency of Double Jersey Machine (Rib)
The below table 4 has shown the productivity before implementing any steps of 4 Rib machine where different types of Rib fabric were produced. Besides, table 5 has shown the knitting machine data after mentioned steps have been implemented.
0 20 40 60 80 100
M/C 1 M/C 2 M/C 3 M/C 4
100 100 100 100
83.590.2 82.4 80.7 83
87.7 91.4
86
TARGET
BEFORE
AFTER
Producti
on
Eff
ic
ie
ncy
,
Table 4. Production data of Rib fabric (Before implementation)
Parameters M/c 05 M/c 06 M/c 07 M/c 08
No. of Program 4 3 4 2
Target per day, kg 344 428 276 310
Day-1, kg 241 320 225 202*
Day-2, kg 253* 266* 196* 255
Day-3, kg 235* 325 185* 241
Day-4, kg 279 317 201* 248
Day-5, kg 237* 277* 218* 244
Average Production,
kg (5 days) 249 301 205 238
Efficiency (%) 72.4% 70.3% 74.3% 76.8%
Remarks 1x1 Rib 1x1
L/Rib
2x1 HF L/Rib
2x1 HF L/Rib
*Program Changed
Table 5. Production data of Rib fabric (After Implementation)
Parameters M/c 05 M/c 06 M/c 07 M/c 08
No. of Program 4 3 4 2
Target per day, kg 344 428 276 310
Day-1, kg 322 376 245 278
Day-2, kg 317 312* 238 292
Day-3, kg 254* 381 229 285
Day-4, kg 315 348 246 288
Day-5, kg 326 378 236 295
Average Production,
kg (5 days) 307 359 239 288
Efficiency (%) 89.2% 83.9% 86.6% 92.9%
Remarks 1x1
Rib
1x1 L/Rib
2x1 HF L/Rib
2x1 HF L/Rib
*Program Changed
Figure 2. Efficiency analysis of the Rib fabric
From the above two data table 4 and 5, the following graph 2 can be plotted. Generally, the graph has shown higher production efficiency after implementing the necessary steps than conventional. About 24-30% low productions have been recorded than targeted production when rib machines were producing fabric as usual way. However, production jumped to 12-17% more than this when the mentioned steps
were tried to implement. It is recorded that approximately 290 kg, 290 kg, 170 kg and 250 kg rib fabric production increased for machine 5, machine 6, machine 7 and machine 8 respectively after 5 days.
3.3. Determination of Production Efficiency of Double Jersey Machine (Interlock)
The below table 6 has shown the productivity before implementing any steps of 4 Interlock machine where only normal interlock fabric was produced. Besides, table 7 has shown the knitting machine data after mentioned steps have been implemented.
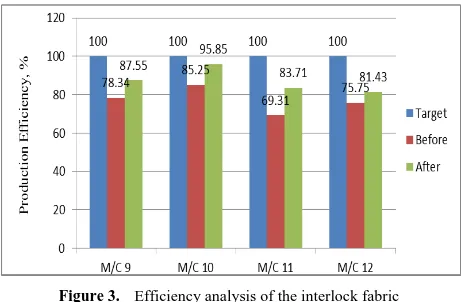
Table 6. Production data of Interlock fabric (Before implementation)
Parameters M/c 09 M/c 10 M/c 11 M/c 12
No. of Program 3 2 3 2
Target per day, kg 217 217 264 264
Day-1, kg 172 196 176* 192
Day-2, kg 157* 170* 182* 184*
Day-3, kg 178 192 178* 213
Day-4, kg 176 192 178* 213
Day-5, kg 165* 184 188 204*
Average Production,
kg (5 days) 170 185 183 200
Efficiency (%) 78.34% 85.3% 69.31% 75.75%
Remarks Interlock Interlock Interlock Interlock
*Program Changed
Table 7. Production data of Interlock fabric (After implementation)
Parameters M/c 09 M/c 10 M/c 11 M/c 12
No. of Program 3 2 3 2
Target per day, kg 217 217 264 264
Day-1, kg 183 198 236 206
Day-2, kg 181 206 225 196
Day-3, kg 192 212 213 218
Day-4, kg 198 209 223 226
Day-5, kg 196 214 209 230
Average Production,
kg (5 days) 190 208 221 215
Efficiency (%) 87.55% 95.85% 83.71% 81.43%
Remarks Interlock Interlock Interlock Interlock
From the above two data table 6 and 7, the following graph 3 can be plotted. Similarly, the graph has shown higher production efficiency after implementing the necessary steps than conventional. It is found about 15-31% low production efficiency for conventional method where 6-14% higher production efficiency found after implementing the mentioned steps. Moreover, approximately 100 kg, 115 kg, 190 kg and 75 kg interlock fabric produced more in 5 days after that. This clearly indicates the higher productivity of that particular types of machine in the knitting floor.
0% 20% 40% 60% 80% 100%
M/C 5 M/C 6 M/C 7 M/C 8
100% 100% 100% 100%
72.4% 70.3 % 74.3 % 76.8 % 89.2% 83.9% 86.6% 92.9 %
Target Before After
P
rod
uc
ti
on
E
ff
ic
ie
nc
y,
%
Figure 3. Efficiency analysis of the interlock fabric
3.4. Determination of Production Efficiency of 3 Thread Fleece Machine
The below table 8 has shown the productivity before implementing any steps mentioned of 4 Fleece machine where only normal fleece fabric was produced. Besides, table 9 has shown the knitting machine data after mentioned steps have been implemented.
Table 8. Production data of 3 threads fleece fabric (Before
implementation)
Parameters M/c 13 M/c 14 M/c 15 M/c 16
No. of Program 3 2 3 2
Target per day, kg 349 387 366 366
Day-1, kg 281 296 256 263
Day-2, kg 236* 308 225* 272
Day-3, kg 242* 318 218* 278
Day-4, kg 278 277* 265 281
Day-5, kg 272 277* 265 281
Average Production,
kg (5 days) 262 302 245 267
Efficiency (%) 75% 78% 67% 73%
Remarks Fleece Fleece Fleece Fleece
*Program Changed
Table 9. Production data of 3 threads fleece fabric (After implementation)
Parameters M/c 13 M/c 14 M/c 15 M/c 16
No. of Program 3 2 3 2
Target per day, kg 349 387 366 366
Day-1, kg 284 318 288 280
Day-2, kg 290 314 278 292
Day-3, kg 262* 325 271 302
Day-4, kg 296 318 276 296
Day-5, kg 284 324 296 295
Average Production,
kg (5 days) 283 320 282 293
Efficiency (%) 81% 82.7% 77% 80%
Remarks Fleece Fleece Fleece Fleece
From the above two data table 8 and 9 the following graph 4 can be plotted. Similarly, the graph has shown higher production efficiency after implementing the necessary steps
than conventional. After analyzing it is clearly visible that the 3 thread fleece fabric found upward productivity after taken necessary steps than the conventional methods. Around 4-10% extra production efficiency found compared to before implementing any steps. The floor has seen an increment of 105 kg, 90 kg, 185 kg and 130 kg of production in 5 days for machine 13, machine 14, machine 15 and machine 16 respectively.
Figure 4. Efficiency analysis of the 3 threads fleece fabric
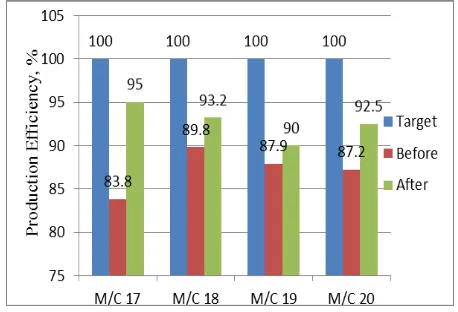
3.5. Determination of Production Efficiency of 2 Threads Terry Fleece Machine
Table 10. Production data of 2 threads terry fleece fabric (Before
implementation)
Parameters M/c 17 M/c 18 M/c 19 M/c 20
No. of Program 3 2 2 3
Target per day, kg 265 265 265 265
Day-1, kg 234 233 230 223
Day-2, kg 201* 215* 225 228
Day-3, kg 241 258 242 234
Day-4, kg 236 244 235 242
Day-5, kg 198* 240 232 227
Average Production,
kg (5 days) 222 238 233 231
Efficiency (%) 83.8% 89.8% 87.9% 87.2%
Remarks Terry Terry Terry Terry
*Program Changed
Table 11. Production data of 2 threads terry fleece fabric (after
implementation)
Parameters M/c 17 M/c 18 M/c 19 M/c 20
No. of Program 3 2 2 3
Target per day, kg 265 265 265 265
Day-1, kg 256 245 248 234
Day-2, kg 249 253 242 252
Day-3, kg 244 242 238 248
Day-4, kg 252 239 244 243
Day-5, kg 258 255 232 247
Average Production,
kg (5 days) 252 247 241 245
Efficiency (%) 95% 93.2% 90% 92.5%
The above table 10 has shown the productivity before implementing any steps mentioned of 4 Terry fleece machine (S/J) where 2 threads fleece fabric was produced. Besides, table 11 has shown the knitting machine data after mentioned steps have been implemented.
From the above two data table 10 and 11, the following graph 5 can be plotted. Similarly, the graph has shown higher production efficiency after implementing the necessary steps than conventional. It is clearly visible that the 2 thread fleece fabric found upward productivity after taken necessary steps than the conventional methods. Approximately 10-16% low production found for the case when no steps have been taken properly. Around 5-10% more production efficiency found compared to before implementing any steps. The floor has seen an improve productivity of 150 kg, 45 kg, 40 kg and 70 kg of production in 5 days for machine 17, machine 18, machine 19 and machine 20 respectively.
Figure 5. Efficiency analysis of the 2 threads terry fleece fabric
4. Conclusions and Recommendations
4.1. Findings
Proper planning of implementation causes a higher production of a knitting floor
Categorizes of the machinery can go for smooth productivity
Less no. of program change ensures higher productivity and efficiency
Supply of better quality knitting elements, yarn and other optical devices confirms the higher production rate
Knitting floor environment and relief from pressure enhance the attention and growth the production much
Supply of fabric role marking sticker saves time from loss of production
4.2. Conclusions
An effective knitting floor always is possible to have when a proper system of floor planning is implemented. In fact, a knitting production floor always should follow proper strategies. Not surprisingly, productivity and efficiency increased higher if the floor is run on a perfect planning basis only. In this research, nothing special parameters were changed or modified except ensuring to implement well-known planning steps accurately. As a consequence, factory has been observed a huge no. of improved production after implementation of the steps than the usual.
4.3. Recommendations
Categorize each floor basis on the types of products they are recommended
Well-developed planning and supply chain management can be a major implementation for high productivity
Continuation must ensure in every moment
Machining condition should have regular check
REFERENCES
[1] Ray, S.C. (2011) Fundamentals and Advances in Knitting Technology. Woodhead Publishing India Pvt. Limited, New Delhi.
[2] Belal, E.S.A. (2006) Understanding Textile for a Merchandiser. BMN Publication, Dhaka.
[3] Solaiman, M., Khalil, E., Rahman, M. and Sarkar, J., 2014. Efficiency Losses Calculation and Identify Causes of Losses of Circular Knitting Machine during Knit Fabric Production. Manufacturing Science and Technology, 2(5), pp.93-96. [4] Spancer, D.J. (2001) Knitting Technology. Woodhead
Publishing Limited, Cambridge.
[5] Rassel, M.A. and Hoque, M.M.U., Re-evaluation on Causes of Circular Knitting Machine Production Efficiency and their Impact on Fabric Quality.
[6] Catarino, A.P., Rocha, A.M., Monteiro, J.L. and Soares, F., 2005. Knitting process surveillance using time and frequency analysis.