Available Online at www.ijpret.com
195
INTERNATIONAL JOURNAL OF PURE AND
APPLIED RESEARCH IN ENGINEERING AND
TECHNOLOGY
A PATH FOR HORIZING YOUR INNOVATIVE WORK
DAIRY WASTEWATER TREATMENT USING VERTICAL FLOW CONSTRUCTED
WETLAND
MAHATME P. S.1, WADHONKAR P.S.2
1. Assistant Professor, Civil Engineering Department, Pro. Ram Meghe College Of Engineering And Management, Badnera, Amravati.
2. 2-Lecturer, Civil Engineering Department, Nav Vidya Niketan Institute Of Technology (Polytechnic),Mardi Road, Amravati.
Accepted Date: 27/02/2014 ; Published Date: 01/05/2014
\
Abstract:The dairy industry is generally considered to be the largest source of food processing wastewater in India. As awareness of the importance of improved standards of wastewater treatment grows, process requirements have become increasingly stringent. Although the dairy industry is not commonly associated with severe environmental problems, it must continually consider its environmental impact, particularly as dairy pollutants are mainly of organic origin. 70 % of all available water in India is considered polluted. It has been estimated that-approximately 73 million working days are lost due to water related diseases. The cost of environmental damage is estimated to be over 5 % of India’s GDP.India currently generates over 110,000 million liters of wastewater a day. There are many methods to treat dairy wastewater. One of them is constructed wetland. Constructed wetland is natural method to treat wastewater. Constructed wetlands are constructed basins that have a permanent pool of water throughout the year (or at least throughout the wet season) and differ from wet ponds primarily in being shallower and having greater vegetation coverage. In the present study performance of the fabricate model on which parameter like pH, TS, BOD, COD with typha studied for detention period 3 days , 5 days, 7 days and 9 days. The result shows, % removal of TS is 80 %, % removal of BOD is 51%, and % removal of COD is 55%.It is also found that the increase in the detention period of waste water the removal rate also increase.
Keywords: Wastewater Treatment, Environmental Problems, Cod, Dairy Industry.
Corresponding Author: MR. MAHATME P. S
Access Online On:
www.ijpret.com
How to Cite This Article:
PS Mahatme, IJPRET, 2014; Volume 2 (9): 195-209
Available Online at www.ijpret.com
196
INTRODUCTION
Prepare Several studied experiments and research works have been carried out since a long time all over the world to understand or to evaluate the effect of constructed wetland on waste water with the latest techniques adopted for the improved performance of the same. Technical articles published in the proceeding and other journals have been referred to determine the scope of work and understand the presence status the proposed study.
Jennifer A. Schaafsma, et.al.,(1999), has studied results suggest that while reductions are large, further removal is necessary to meet design requirements. This may be possible through the addition of another anaerobic wetland cell downstream of the system or recirculation of wastewater through the wetland cells to promote denitrification and uptake of nutrients by plants. Jaiprakash kushwaha,et al (2002), they work on various technologies for the treatment of dairy Wastewaters at Poompavai , Uttarakhand , India 2002. Erin Smith et.al.(2007), has studided two small-scale constructed wetlands (100 m2) of differing operational depth (wetland 1: 0.15 m shallow zone depth and wetland 2: managed water level) were designed to treat agricultural wastewater at the Bio-Environmental Engineering Center of the Nova Scotia Agricultural College. Coulibalyet al.,(2008), emphasis on constructed wetland planted with Amaranthus hybridus was developed for domestic wastewater treatment. Two beds planted with yang A. Hybridus plants and one with unplanted bed were used to perform the experiment. M. Tsalkatidouet. al ( 2008), worked on the Combined stabilization ponds– constructed wetland system. In a pre-existing wastewater treatment pilot plant consisting of
three interconnected waste stabilization ponds. Oneţ Cristian(2010), worked on the
characteristics of the untreated wastewater produced by food industry. Fang CUI et. al (2011), worked on Constructed Wetland as an alternative solution to Maintain Urban Landscape Lake Water Quality, and concluded that the SFS constructed wetland is better than the FWS wetland. Ramprasad. C (2012), worked on waste water treatment using lab scale reed bed system using Phragmitis australis, chennai . The waste water generated from the quarters, school hostel and college hostels in our university campus were collected and analyzed.
Available Online at www.ijpret.com
197
2.Theorotical Background
Constructed wetland
Constructed wetlands are constructed basins that have a permanent pool of water throughout the year (or at least throughout the wet season) and differ from wet ponds primarily in being shallower and having greater vegetation coverage. The main objective of the study of constructed wetland was to test current engineered constructed wetland technology for the treatment of the high strength wastewaters produced by a dairy milkhouse under seasonal conditions. To accomplish this constructed wetland system was designed and built. Both the design and construction of the system were planned with respect to the dairy farmer’s financial requirements and abilities to construct and maintain the system.
2.1 Type of constructed wetland are-
1. Free Water Surface Systems (FWS)
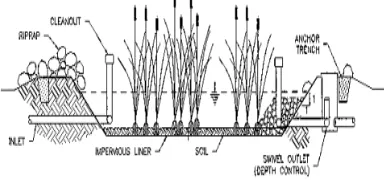
The systems shown in fig 1, typically consist of basins or channels, with some sort of subsurface barrier to prevent seepage, soil or another suitable medium to support the emergent vegetation, and water at a relatively shallow depth flowing through the unit. The shallow water depth, low flow velocity, and presence of the plant stalks and litter regulate water flow and, especially in long, narrow channels minimize short circuiting.
Fig 1-Free Water Surface Systems
2. Subsurface Flow Systems (SFS)
Available Online at www.ijpret.com
198 Fig 2-Subsurface Flow Systems
3. Horizontal flow systems
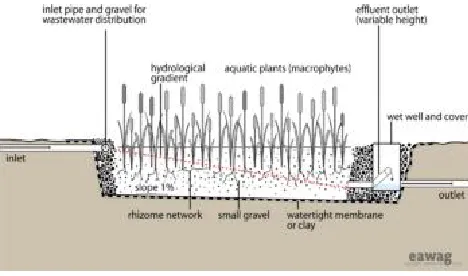
Fig 3. shows schematic cross section of a horizontal flow constructed wetland. It is called HF wetland because the wastewater is fed in at the inlet and flow slowly through the porous substrate under the surface of the bed in a more or less horizontal path until it reaches the outlet zone. During this passage the wastewater will come into contact with a network of aerobic, anoxic and anaerobic zones. The aerobic zones will be around the roots and rhizomes of the wetland vegetation that leak oxygen into the substrate. During the passage of wastewater through the rhizosphere, the wastewater is cleaned by microbiological degradation and by physical and chemical processes. The wastewater flows horizontally through a porous soil medium where the emergent plant vegetation is rooted, and is purified during the contact with the surface areas of the soil particles and the roots of the plants. This system includes an impermeable liner or native soil material at the bottom to prevent possible contamination of the groundwater.. HF wetland can effectively remove the organic pollutants (TSS, BOD5 and COD) from the wastewater. Due to the limited oxygen transfer inside the wetland, the removal of nutrients (especially nitrogen) is limited, however, HF wetlands remove the nitrates in the wastewater( UN-HABITAT, 2008. Constructed Wetlands Manual).
Available Online at www.ijpret.com
199
4. Vertical flow systems
Vertical flow systems are characterized by an intermittent charging including filling and resting periods where wastewater percolates vertically through a soil layer that consists of sand, gravel or soil. The plant species primarily used in vertical flow wetlands is common reed due to its deeply penetrating, dense root and rhizome system. Key advantage of vertical flow systems is an improved oxygen transfer into the soil layer .Beside oxygen input by the plants and diffusion processes that both occur also in horizontal subsurface flow wetlands, vertical flow filter show a significant oxygen input into the soil through convection caused by the intermittent charging and drainage. Compared to horizontal subsurface flow systems, the additional aeration of the soil by convective processes allows higher nitrification capacities as well as removal of organic matter. However, denitrification that requires anoxic conditions is usually lower in vertical flow beds compared to horizontal subsurface flow beds. They are also less effective for removal of suspended solids than horizontal surface flow and subsurface flow beds.fig 3,5 shows the vertical flow system.
The following points shows that how vertical wetland is good as compare to other:
1. They have much greater oxygen transfer capacity resulting in good nitrification
2. They are considerably smaller than HF system,
3. They can efficiently remove BOD5, COD and pathogens.
Fig-.4 Vertical flow systems
5. Hybrid constructed wetland
Available Online at www.ijpret.com
200 to promote aerobic and anaerobic reactions. as may the remoral of ammonia from agricultural wastewater.
3. Materials And Methods
3.1. Experimental set up and operation conditions of wetlands
One subsurface flow wetland systems were constructed and located at the Civil engineering laboratory. The constructed wetland systems, including Typha orientalis with vegetation, were operated in continuous flow mode. The raw dairy wastewater sampled was collected from the local Congress nagar dairy farm. The 22 liters of wastewater is introduced in the inlet unit. The constructed wetland units made of plastic material, the raw wastewater and treated wastewater container have same dimension of 23×20×38 cm and bed assembly is cylindrical having diameter 23 cm and height 45 cm were fabricated. The schematic diagram of the wetland modules with Typha orientalis is shown in Fig. 3.1
Figure 3.1 :Diagram showing laboratory setup for constructed wetland with Typh orientalis
3.2 Preparation of Bed
Available Online at www.ijpret.com
201 Aggregate must be wash with the clean water and dried so as to remove the impurity over the surface of it. Constructed wetland technology is based upon the treatment power of three main mechanisms: micro-organisms colonizing the system, the physical and chemical properties of the bed media , and finally the plants themselves. The laboratory scale model calibrated for the various discharge like 3-days,5-days and 7-days and 9 days.
3.3 Starting of experiment
After the preparation of the bed for the constructed wetland the actual performance of the bed started. The raw wastewater from the local Congress nagar dairy farm is collected, before putting the wastewater in the influent container it was screened. The raw wastewater characteristics like pH, DO, BOD, COD, and TS was calculated using standard methods. The screened wastewater was put into the influent container the container provided with the calibration knob, the knob calibrated for the varying detention time i.e for 3, 5, and 7days. After the calibration the wastewater was allowed to pass over the surface of the bed, as the time progress the percolation of wastewater start into the bed. Percolated water from the bed collected in the outlet tank. The purified wastewater characteristics also studied by using standard methods.
4 . Results And Discussion
The raw wastewater collected from Government Dairy plant, Congress Nagar, Amravati was studied in the laboratory. The various tests were conducted on the raw wastewater like pH, DO, BOD, COD, T.S, as per standard methods. From the result it is observed that the waste is moderate in strength and needs the treatment before discharging into stream.
Available Online at www.ijpret.com
202
Fig 4.1 : % removal of TS for detention period 3 days
Fig4.2 : % removal of COD for detention period 3 days
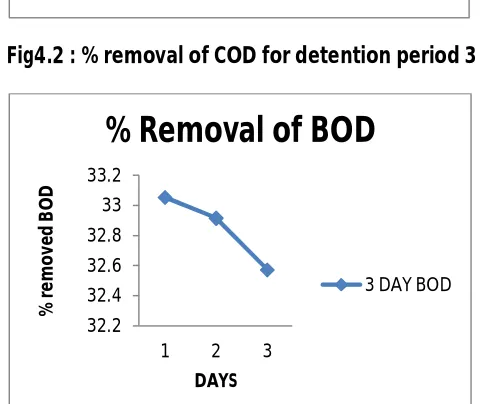
Fig4.3 : % removal of BOD for detention period 3 days
56.1 56.15 56.2 56.25 56.3 56.35 56.4 56.45
1 2 3
% r e m ov ed T S DAYS
% Removal of TS
3 DAY TS
30.1 30.2 30.3 30.4 30.5
1 2 3
% r e m ov ed C O D DAYS
% Removal of COD
3 DAY COD
32.2 32.4 32.6 32.8 33 33.2
1 2 3
% r e m ov ed B O D DAYS
% Removal of BOD
Available Online at www.ijpret.com
203 The characteristics of the row Industrial wastewater in the inlet and the characteristics of the treated wastewater at the outlet was studied for the detention period 5 days. For the TS it was found that percentage removal was in the range of 59 %. Fig 4.4 shows percentage removal of total solid for the ditention period 5 days. The percentage removal of BOD was 48.21 to 48.44%. Fig 4.6 shows the percentage removal of COD for the detention period 5 days.the percentage removal of COD was in range of 53 %. The fig 4.7 shows percentage removal of COD for 5 days.
Fig4.4 : % removal of TS for detention period 5 days
Fig4.5 : % removal of COD for detention period 5 days
59.05 59.1 59.15 59.2 59.25 59.3 59.35 59.4
1 2 3 4 5
%
r
em
o
ve
d
T
S
DAYS
% Removal TS
TS 5
52.55 52.6 52.65 52.7 52.75 52.8 52.85 52.9 52.95 53
1 2 3 4 5
%
r
e
m
ov
ed
C
O
D
DAYS
% Removal COD
Available Online at www.ijpret.com
204
Fig4.6 : % removal of BOD for detention period 5 days
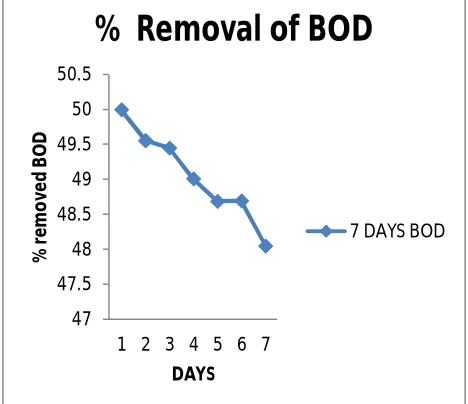
The characteristics of the row Industrial wastewater in the inlet and the characteristics of the treated wastewater at the outlet was studied for the detention period 7 days. For the TS it was found that percentage removal was in the range of 73 %. Fig 4.7 shows percentage removal of total solid for the ditention period 7 days. The percentage removal of BOD was 50.00 to 48.7 %. Fig 4.9 shows the percentage removal of COD for the detention period 7 days. the percentage removal of COD was in range of 53 %. The fig 4.8 shows percentage removal of COD for 7 days.
Fig4.7 : % removal of BOD for detention period 7 days
48.05 48.1 48.15 48.2 48.25 48.3 48.35 48.4 48.45 48.5
1 2 3 4 5
%
r
e
m
ov
ed
B
O
D
DAYS
% Removal BOD
BOD5
72.9 72.95 73 73.05 73.1 73.15
1 2 3 4 5 6 7
%
r
em
ov
e
d
T
S
DAYS
% Removal TS
Available Online at www.ijpret.com
205
Fig 4.8 : % removal of BOD for detention period 7days
Fig 4.9 : % removal of BOD for detention period 7 days
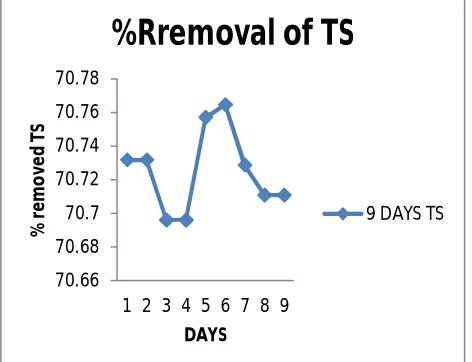
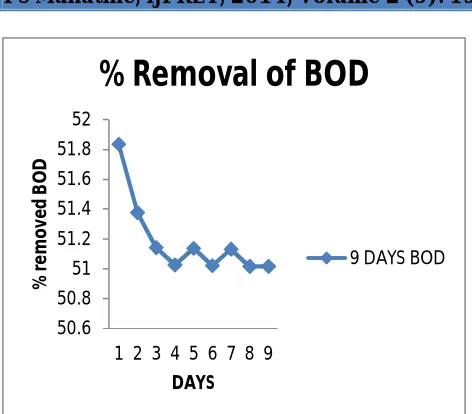
The characteristics of the row Industrial wastewater in the inlet and the characteristics of the treated wastewater at the outlet was studied for the detention period 9 days. For the TS it was found that percentage removal was in the range of 70 %. Fig 4.10 shows percentage removal of total solid for the detention period 9 days. The percentage removal of BOD was 51.83 to 51.02 %. Fig 4.12 shows the percentage removal of COD for the detention period 9 days .the
51.6 51.8 52 52.2 52.4 52.6 52.8 53
1 2 3 4 5 6 7
%
r
em
o
ve
d
C
O
D
DAYS
% Removal COD
7 DAYS COD
47 47.5 48 48.5 49 49.5 50 50.5
1 2 3 4 5 6 7
%
r
em
o
ve
d
B
O
D
DAYS
% Removal of BOD
Available Online at www.ijpret.com
206 percentage removal of COD was in range of 52 %. The fig 4.11 shows percentage removal of COD for 9 days
Fig 4.10 : % removal of BOD for detention period 9 days
Fig 4.11 : % removal of BOD for detention period 9 days
70.66 70.68 70.7 70.72 70.74 70.76 70.78
1 2 3 4 5 6 7 8 9
%
r
em
o
ve
d
T
S
DAYS
%Rremoval of TS
9 DAYS TS
53.5 54 54.5 55 55.5
1 2 3 4 5 6 7 8 9
%
r
em
o
ve
d
C
O
d
DAYS
% Removal of COD
Available Online at www.ijpret.com
207
Fig 4.12 : % removal of BOD for detention period 9 days
Comparisons of different detention period
During the comparison of different detention period it was found that the maximum percentage removal of the total solid was found to be 75% and it was for the detention period of 9 days . the fig 4.13 shows the percentage removal of TS for the different period .
Fig 4.13 : % Removal of TS, for different detention time 50.6
50.8 51 51.2 51.4 51.6 51.8 52
1 2 3 4 5 6 7 8 9
%
r
e
m
ov
ed
B
O
D
DAYS
% Removal of BOD
9 DAYS BOD
71.5 72 72.5 73 73.5 74 74.5 75
1 2 3 4 5 6 7 8 9
%
R
EM
O
V
A
L
DAYS
TS
3 days
5 days
7 days
Available Online at www.ijpret.com
208 For the BOD the maximum percentage removal was found to be 70.76 % and the minimum percentage removal was found to be 33 % for the detention period 3 days. The maximum percentage removal was found for the 9 days and the minimum percentage removal was found for the detention period 9 days. Fig 4.14 shows the percentage removal of BOD for the different detention period.
Fig 4.14 % Removal of BOD for different detention time
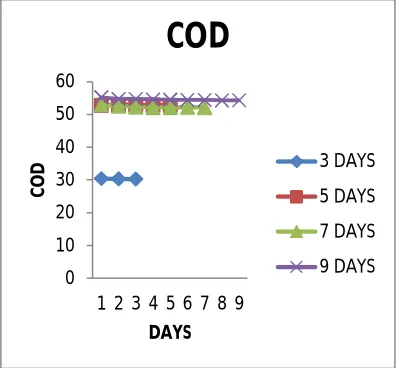
For the COD the maximum percentage removal was found to be 55 % and the minimum percentage was found to be 30 % for the detention period 9 days and for the detetion period 3 days . fig 4.15 shows the percentage removal of COD for the different detention period.
Fig 4.15: % Removal of COD for different detention time 0
10 20 30 40 50 60
1 2 3 4 5 6 7 8 9
C
O
D
DAYS
COD
3 DAYS
5 DAYS
7 DAYS
9 DAYS 0
20 40 60 80
1 2 3 4 5 6 7 8 9
%
RE
M
O
V
A
L
DAYS
BOD
3 DAYS
5 DAYS
7 DAYS
Available Online at www.ijpret.com
209
5.Conclusion
The dairy waste is collected from Government Dairy plant, Congress Nagar, Amaravati. The parameters like PH, OC, COD, BOD, TS are checked in laboratory before and after passing through vertical constructed wetland system using typha. Model , vertical constructed wetland is fabricated in civil engineering laboratory. The test is conducted for untreated and treated waste.
REFERENCE:
1. It was found that there is an increase in the PH of the treated wastewater for each case.
2. After treating waste for detention period 3days,5 days, 7days, 9 days, the average percentage removal for TS, BOD, COD are 80% , 55%, 51% .
3. From this observation , it was found that for certain increase in detention period the percent removal is remain constant.
4. It was found that the overall percentage removal of all pollutant were for the detention period 7 days as compare to the other detention time.
5. It was found that the BOD , COD, was best removed constructed wetland in natural method . It is because of the oxygen diffusion from roots of the typha.