Available Online at www.ijpret.com 174
INTERNATIONAL JOURNAL OF PURE AND
APPLIED RESEARCH IN ENGINEERING AND
TECHNOLOGY
A PATH FOR HORIZING YOUR INNOVATIVE WORK
CRY ANALYSIS
DHANASHRI U.S. TALAULIKER1, NAYANA SHENV2
1. M.E. (ECI) Student, Second Year, Goa Engg College, Farmagudi- Goa. 2. Asst. Prof. E&TC Dept, Goa Engg College, Farmagudi-Goa
Accepted Date: 05/03/2015; Published Date: 01/05/2015
\
Abstract:The acoustic analysis of infant cry is used to deduce information on the state of health of new-born babies as well as of children a few weeks old. Crying is the first tool of communication for an infant. Cry is not just an infant behavior, but rather it is a part of a behavioral system in the human species that assures survival of the helpless neonate by eliciting others to meet basic needs. The preterm infants and infants with neurological conditions have different cry characteristics like fundamental frequency, when compared to healthy full term infant. There are possible differences between full term and preterm infant in their neuro-physiological maturity and subsequent impact on their speech development. Also the anatomical and physiological bases of inspiratory cry phonation are of relevance. New born infant cry characteristics, change with increase in conceptual age. Acoustics analysis of preterm infant cry signals can thus give an aid to clinical diagnosis and prevention of distress since it is easy to perform, cheap and completely non-invasive. Hence, this paper aims at representing cry signal in time and frequency domain and estimating the fundamental frequency (pitch) using time domain and frequency domain analysis. Such parameters are of interest in exploring brain function at early stages of child development, for the timely diagnosis of neonatal disease and malformation.
Keywords: Cry Analysis, Fundamental Frequency, Time domain Analysis, Frequency domain Analysis,
rhythmic alteration, Spectrogram
Corresponding Author: MS. DHANASHRI U.S. TALAULIKER
Access Online On:
www.ijpret.com
How to Cite This Article:
Dhanashri U. S. Talauliker, IJPRET, 2015; Volume 3 (9): 174-179
Available Online at www.ijpret.com 175 INTRODUCTION
The cry signal results from coordination among several brain regions that control respiration and vocal cord vibration from which the cry sounds are produced. Previous work has shown a relationship between acoustic characteristics of the cry and diagnoses related to neurological damage, Sudden Infant Death Syndrome, prematurity and substance exposure during pregnancy. Assessment of infant cry provides a window into the neurological and medical status of the infant.
Assessment of infant cry is brief and noninvasive and requires recording equipment and a standardized stimulus to elicit a pain cry. The typical protocol involves30 seconds of crying from a single application of the stimulus. The recorded cry is submitted to an automated computer analysis system that digitizes the cry and either presents a digital spectrogram of the cry or calculates measures of cry characteristics. The most common interpretation of cry measures is based on deviations from typical cry characteristics. Infants with abnormal cries should be referred for a full neurological evaluation. Crying is a biological siren, alerting the care giving environment about the needs and wants of the infant and motivating the listener to respond.
I. METHODS
A. Fundamental Frequency
[2]Infant crying comprises the rhythmic alteration of cry sounds (utterances) and inspirations. Crying is part of the expiratory phase of respiration with sound or phonation produced by the larynx, which contains the vocal cords or folds and glottis (opening between vocal folds). The larynx has three functions: swallowing, breathing (glottis is fully open), and voice production (glottis is closed).When air is forced through adducted (closed) vocal cords, the increased air speed due to passage through a constricted tube (Venturi tube effect) results in a drop in air pressure (the Bernoulli principle), causing the vocal cords to open and close rapidly (approx. 250 to 450 Hz or cycles per second in a normal healthy newborns). This vibration is the
fundamental frequency (f0). The upper vocal tract shapes the sound to produce resonant
frequencies or formants (frequency bands above f0).There are three identifiable cry modes of
vocal fold vibration: basic cry or phonation or fundamental frequency (f0 ), high pitch cry or
hyper-phonation (1000 to 2000 Hz), and noisy or turbulent cry (dysphonation).Only the first
two formants are usually measured: The first formant(F1) occurs at approximately 1100 Hz and
Available Online at www.ijpret.com 176 B. Method1: Estimation of Fundamental Frequency by Autocorrelation method (Time domain Analysis)
The information about pitch period 'T0' is more pronounced in the autocorrelation sequence of
voiced speech compared to the speech segment itself. The second largest peak is the
autocorrelation sequence, represents T0 and can be picked up easily by a simple peak picking
algorithm. There is no prominent peak in the case of unvoiced speech. Speech pitch is typically in the range 100-400 Hz and accordingly the pitch in the range 2.5-10 msec. Therefore for the estimation of pitch the largest peak in the partial autocorrelation sequence starting from 2.5 m sec lag is found out and its distance with respect to zero lag is measured as pitch peak 'T0 '.
Once To is known, then pitch can be computed as 1/T0 as shown in figure Fig1.
Fig 1- Measurement of ‘To’
C. Method2: Cepstrum Pitch Determination method (Frequency domain Analysis)
Main limitation of pitch estimation by the auto correlation of speech is that there may be peaks
larger than the peak corresponding to the pitch period T0. As a result there may be picking of
Available Online at www.ijpret.com 177 Fig 2- Measurement of ‘To’
II.RESULTS
MATLAB 7.1 is used for coding. Codes for representing cry signal in time & frequency domain and estimating fundamental frequency in time & Frequency domain are developed. The results are as follows.
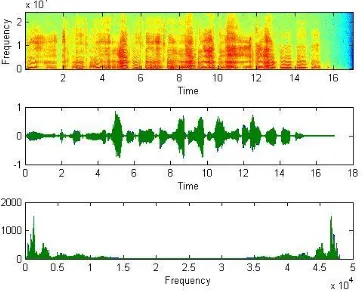
1) Representation of cry signal in time domain, frequency domain and its Spectrogram
Available Online at www.ijpret.com 178
3) Estimation of Fundamental Frequency in frequency domain(Cepstrum analysis)
III. CONCLUSION
The Fundamental frequency found using two analyses are almost same and are in the range of normal infant.
f0=436.364 Hz( Using Autocorrelation method)
f0=444.444 Hz (Using Cepstrum Analysis)
IV. REFERENCES
1. Manfredi, I. Bocchi, S. Orlandi, L. Spaccatera, G.P. Donzelli," High resolution cry analysis in preterm newborn infants" Dept of E&TC, UniversitadegliStudi di Firenze, ViaS. Ma, Italy &Dept of paediatrics, Children Hospital A. Meyer. UniversitadegliStudi di Firenze, Firenze, Italy,2009
2. Linda L. La Gasse, A. Rebecca Neal and Barry M. Lester, "Assessment of infant cry: acoustic
cry analysis and parental perception" Dept of pediatrics, Brown medical school, Rhode Island, 2005.
3. Dror Lederman ,“Estimation of Infants’ Cry Fundamental Frequency Using a Modified SIFT
Available Online at www.ijpret.com 179
4. Yasmina Kheddache, Chakib Tadj ,“Characterization of Pathologic Cries of Newborns Based
on Fundamental Frequency Estimation” , October 2013
5. Rami Cohen1, Yizhar Lavner, IEEE 27-th Convention of Electrical and Electronics Engineers in
Israel, “Infant Cry Analysis and Detection”, 2012
6. Ada Fort, Claudia Manfredi, “Acoustic analysis of newborn infant cry signals”, Medical