Online at http://jdesert.ut.ac.ir
DESERT 13 (2008) 155-165
Catchment-scale spatial variability analysis of soil hydro-physical
properties in a semi-arid region of Iran
H. Motaghian
a, J. Mohammadi
b*, A. Karimi
ca
M.Sc. student, Shahrekord University, Shahrekord, Iran
b
Associate professor, Shahrekord University, Shahrekord, Iran
c
Assistant professor, Shahrekord University, Shahrekord, Iran
Received 9 April 2008; Received in revised form 20 October 2008; Accepted 10 November 2008
Abstract
Soil hydrau-physical data are important for many hydrological modelings. They are the main variables controlling the key processes such as water and chemicals movement and transport in the soil profiles. This study was conducted in order to analyze the spatial distribution of selected soil hydrau-physcial characteristics including infiltration rate (IR), saturated hydraulic conductivity (Ks), bulk density (BD), clay, silt, and sand content. The study area was sampled on a pseudo-regular sampling scheme with initial grid spacing of 1 km during June and July 2007. Maximum coefficient of variation (CV) was found for IR (72%) and Ks (67%). While, BD showed a minimum CV of 9%. Statistical analyses illustrated that there is a significant difference (P<0.05) in the mean values of IR in two different landforms, i.e., plateaus and alluvial plains. However, different land uses including rangelands and dry farming revealed no significant differences in the mean values of measured IR. The contrasting results were obtained for Ks. Geostatistical analyses revealed that the spatially dependent stochastic component (structure) was predominant over the nugget variance (noise). The developed and modeled variograms of each variable were used in generating kriged maps. As expected, these maps exploited spatial similarities among soil properties.
Keywords: Infiltration rate; Kriging; Saturated hydraulic conductivity; Variogram
1. Introduction
Spatial variability is a key stone in deep understanding and effective management of soils in climatologically different regions. Spatial variability of soil physical and chemical properties at a large-scale, like catchment-scale, is mainly due to geological, geomorophological and pedological soil forming factors that could be altered and induced by other factors such as different land use managements. Therefore, it is important to study the extent of spatial variability at soil surface.
Among the various soil hydrau-physical properties, infiltration rate (IR) and saturated hydraulic conductivity (Ks) are reported to have
∗ Corresponding author. Tel.: +98 913 3261083; fax: +98 381 4424428.
E-mail address: [email protected]
(2005). Infiltration rate and saturated hydraulic conductivity on a large-scale region may vary from very low to very high because of variability in the related soil physical and chemical properties. Such a spatial variability can greatly influence the variability in different key processes like runoff, erosion and crop yield.
Spatial variability in IR, Ks, and other related factors can be assessed quantitatively using classical and spatial statistics. Moreover, inter-correlations between these key properties and other soil variables can be used to estimate IR and Ks with a reasonable accuracy. The popular approach in describing and modeling spatial continuity of soil hyrau-physical variables is the use of probabilistic models (instead of deterministic methods). In stochastic modeling, the data are assumed to be the result of a random process and the variance of increments can be represented in the form of mathematical functions such as variograms. Some studies used variograms, kriging and cokriging techniques to characterize the spatial patterns of soil hydrau-physical properties, and examples include Wilson et al. (1989), Reynolds and Zebchuk (1996), Mallants et al. (1996), Buttle and House (1997), Chin et al. (1997), Mohanty and Mousli (2000), Ersahin (2003), Haws et al. (2004), Sobieraj et al. (2004) and Iqbal et al. (2005).
Vieira et al. (1981) characterized spatial variability of infiltration rate using geostatistical techniques and reported a range of 50 m for 1280 filed measured infiltration rates. Iqbal et al. (2005) used 209 soil profiles from 18 parallel transects which sampled with a separation distance of about 80 m. Their geostatistical analyses revealed that structured variance was dominant over random component (nugget effect). The highest percentage nugget values were found for surface Ks and bulk density (BD). They reported the range values of 94, 106, 218, and 421 m for Ks, BD, percentages of sand, and clay of surface horizon, respectively. The variograms of above variables were modeled using an exponential model. Haws et al. (2004) studied the spatial variability of steady-state infiltration rate at different scales on an agricultural landscape and used different sample size (infiltrometer size). They observed a clear evidence of non-stationary behavior in infiltration rate data at hillslope scale. For all support sizes, variograms of infiltration rate data were modeled using a linear model. While, the spatial structure of landscape-scale IR measurements were modeled using a spherical model with range values of 169.7 m to 209.4 m
for different supports. Vauclin et al. (1983) used statistical and geostatistical techniques to study spatial variability of sand, silt and clay contents, available water content and water stored at -33 kPa. They found the strongest correlation (r=-0.83) between sand content and available water content. The cross variogram showed that sand content was spatially correlated with soil water content at -33 kPa within a distance of about 30 m. Sobieraj et al. (2002) investigated if Ks exhibited a similar functional distribution in space as other soil properties, i.e. color, texture, mineralogy, etc., along a tropical rainforest catena. At the hillslope scale and sampling intervals of 25 m, they found that the Ks was uncorrelated with soil properties. Furthermore, Sobieraj et al. (2004) found no spatial structure in Ks at distances greater than 25 m. In summary, soil properties like infiltration rate, bulk density, textural fractions, and saturated hydraulic conductivity are spatially variables which in turn are scale-dependent. Therefore, it is necessary to assess quantitatively the spatial variability of these properties before deciding, designing and conducting any management practices. The main objectives of this study were (i) to explore probable close relationships among IR, Ks, and easily measured soil physical and chemical variables and (ii) to determine and assess the spatial variability in various soil hydraulic and physical properties at a catchment -scale in a semi-arid region.
2. Materials and methods
2.1. Sites and soils
This study was conducted on an about 97
km2 catchment area (mountains and hills with
1.5-m-deep pits revealed that the A (moderate, fine granular) and in some parts the Bca
(moderate-strong, medium subangular blocky) horizons are well structured. Alluvial plains cover smaller parts of the region with the very gentle slopes. Although, the agricultural activities have not been developed intensively, the main land uses in the region include (poor) rangelands and (poor) dry farming. Most parts of the rangeland and dryland farming areas were imposed by severe degradation due to intensive grazing and improper tillage activities. The mean annual precipitation is 400 mm which most of it falls during winter and spring. The annual average temperature is 23 οC with the average minimum of 3.8 οC and the average maximum of 30.7 οC.
2.2. Soil sampling, field measurements, and laboratory analysis
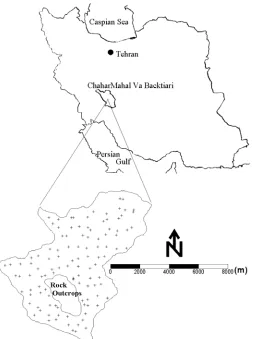
The study area was sampled on a pseudo-regular initial grid spacing of 1 km during June and July 2007. In total, 111 sampling points were considered for infiltration test, undisturbed soil sampling and other related soil variables analysis. The map of the study area with sampling layout, showing 111 sampling locations and the boundary of the excluded rock outcrops area is shown in Fig. 1. All 111 soil samples were analyzed for sand, silt, and clay contents by the hydrometer method (Gee and Bauder, 1986). In addition, at each sampling site, undisturbed soil samples were obtained
from the topsoil using 200-cm3 steel cores to
determine soil bulk density and saturated hydraulic conductivity. For determination of saturated hydraulic conductivity, after securing the bottom of the each soil core, they were placed in a shallow tray of water and allowed to saturate for 2 days at laboratory temperature. Once saturated, the Ks were determined for each soil core using the falling head method (Klute and Dirksen, 1986). Infiltration tests were conducted on all 111 sample sites using double ring variable-water level infiltrometer. The internal diameter was 30 cm for inner and 45 cm for outer ring. To prepare the infiltration measurement surface, hay vegetation was removed and double-rings were than forced into the soil to a depth of 10 cm. The soil surface inside the ring's and ring edges was then lined with a plastic wrap and water was added. The wrap was gently removed and the falling head was recorded. Subsequent to the first series of falling head measurements, water was again
added to the infiltrometer, and the head drop was measured. This procedure was continued up to 120 min. Thus, the measured infiltration rate after 120-min period approached an asymptotic value, which was recorded as the final infiltration rate.
2.3. Statistical and geostatistical analyses
Using classical statistical methods,
descriptive statistics including mean, median, minimum, maximum, standard deviation, and coefficient of variation were calculated for all soil variables. To test the character normality, the Kolmogrov-Smirnov normality test (Davis, 1986) for each character was conducted. In addition, simple Pearson correlation coefficients between hydrological soil characteristics (IR and Ks) and each physical and chemical topsoil properties were calculated. In order to improve the strength of correlations among soil properties, two spatial stratifications, based on land use types and land forms were conducted. A one-way ANOVA was performed to determine the statistical efficiency of different stratification schemes.
The magnitude and structure of spatial variability of each soil variable was determined using variogram analysis (Isaaks and Srivastava, 1989). Before applying the geostatistical analysis, each variable was checked for normality and anisotropy. Anisotropy analysis was conducted using surface variograms (Pannatier, 1996) and calculating directional variograms at four main geographical directions. Moreover, the existence of possible trend was explored by spatial data depicting and using background knowledge from the region. If a geographic trend was obvious, then a linear (first-order) model was developed between values of soil variable (as a dependent variable) and geographical coordinates.
The variogram (semivariance) function was calculated as:
( )
( )
( )[
(
) ( )
]
⎪⎭ ⎪ ⎬ ⎫ ⎪⎩
⎪ ⎨ ⎧
− +
=
∑
= h N
i
i
i h Z x
x Z h N h
1
2
2 1
γ (1)
Where N (h) is the number of pairs separated by a lag distance ofh, Z(xi) is a measured variable at location i, Z(xi+h) is a measured variable at
spatial location i+h. A typical variogram
Fig. 1. Study area and sampling locations
The nugget effect is a local variance component (noise) occurring at scales finer than the shortest sampling interval and could be attributed to the measurement error, fine scale spatial variations, and sampling error. The sill represents the total variance. The range determines the distance, which beyond that distance the values of the variable considered as not correlated. The theoretical models were fitted to experimental variograms. The selection of appropriate model was based on qualitative interpretation of which model best represented the overall behavior of the experimental variogram. The model parameters were calibrated based on a minimization of a weighted sum of the squared deviations between the fitted and computed values. The contour maps (SURFER 7.02, 2000) of each variable were created through ordinary kriging using
their optimized search parameters and respective variogram models.
3. Results
3.1. Statistical characterization of soil properties
Statistical summaries for all variables are given in Table 1. The results of Kolmogrov-Smirnov test indicated that only IR and Ks were skewed significantly. The approximated significance levels, after estimating overall K-S statistics, for IR, Ks, bulk density, sand, silt, clay, and organic carbon contents were 0.06, 0.03, 0.80, 0.70, 0.84, 0.20, and 0.30, respectively. The skewed variables were transformed using natural logarithm before applying statistical and geostatistical analyses.
Table 1. Descriptive statistics of soil variables (n = 111)
Variable Min. Max. Mean Median SD CV%
IR, cmh-1 0.37 14.12 4.31 3.40 3.12 72.3
Ks, cmh-1 0.12 2.35 0.72 0.59 0.48 66.9
BD, Mgm3 0.99 1.41 1.18 1.18 0.10 8.5
Clay, % 24.54 51.09 37.02 37.43 5.07 13.7
Silt, % 28.07 55.64 44.02 44.51 6.32 14.5
The regional mean values for IR and Ks were 4.31 and 0.72 cmh-1, respectively. These values indicated that both IR and Ks were on average small at the region. Comparing to other hydrau-physical soil variables, the field-measured IRs were more variable with minimum and
maximum values of 0.37 and 14.12 cmh-1,
respectively, and a coefficient of variation (CV) of 72.28%. Ersahin (2003) found a mean value
of 5.11 cmh-1 and a CV 36.49% for 50
field-measured IRs. In his study, the average textural classes of both topsoils (0-30 cm) and subsoils (30-60 cm) were loam and IR values were normally distributed with a relatively small variance. While, measured IRs in the field plot with infiltrometer by Sisson and Wierenga (1981) exhibited a lognormal distribution. In the study conducted by Vieira et al. (1981) based on 1280 field measured IRs, a mean of 6.98 mmh-1 and a CV of 39.9% were found. In the current study, the dominant textural classes of topsoils were clay loam to silty clay loam.
Besides to IRs, the Ks values showed relatively high variation with minimum value of
0.12 and maximum value of 2.35 cmh-1 and CV
of 66.91%. Mallants et al. (1996) in evaluating spatial variability of hydraulic properties in a multi-layered soil profile found the maximum CV for Ks, i.e., 599% at 10 cm, 322% at 50 cm, and 897% at 90 cm soil depths. Tsegaye and Hill (1998) reported a CV of 173% for 6-9 cm and 231% for 27-36 cm depths. Iqbal et al. (2005) reported Ks values for 209 samples of surface, subsurface and deep horizons with
mean values of 24.46, 6.03, and 12.44 cmd-1,
respectively. They suggested that increased Ks values in surface horizons could be due to lower bulk density owning to the presence of root channels and macroprosities. The major soil types in their study included fine-silty, coarse-loamy and coarse-silty Entisols and Inceptisols under cotton cultivation. Rasse et al. (2000) attributed the increased Ks values to increased amplitudes of wetting and drying cycles and higher rates of alfalfa root turnover in the Ap horizon.
Once we partitioned the data based on two land use types including natural (but degraded and intensively grazed) rangeland and dry farming, no significant differences (P>0.05) were found in the mean IR of two land use types. The mean value of IR in the rangelands was 4.18 cmh-1 and 4.55 cmh-1 in dry farming area. Considering two different landforms- plateaus and alluvial plains, significant difference (P<0.05) was found in the mean IR
values. The mean IR values were 5.18 and 3.86
cmh-1in plateau and alluvial plain areas,
respectively. Compared to IR values, different results were obtained from partitioning of Ks data. Stratification based upon land use types resulted in significant differences (P<0.05) in the mean values of Ks. The mean value of Ks was 0.83 cmh-1 in rangelands and 0.66 cmh-1 in dry farming area. No significant (P>0.05) differences were found in the mean Ks in different landforms. The Ks showed mean values of 0.68 cmh-1 for plateau and 0.81 cmh-1 for plains. It seems that the infiltration rate was highly controlled by soil forming processes like succession of different depositional materials; while the Ks is mainly influenced by the land use practices.
Among the soil variables studied at this study, bulk density was the least variable physical soil property. It showed a mean value
of 1.18 Mgm-3 and a CV of 8.50%. Similar
results were reported by Tsegaye and Hill (1998), Ersahin (2003) and Iqbal et al. (2005). No significant differences (P>0.05) were found between mean values of bulk density when different stratification strategies were performed on the data set.
The average silt content (44%) was higher than the clay content (37%) and both were on average about two times greater than the sand content (19%). However, some locations, maximum sand content of 36% was observed. In terms of CV, both clay and silt content showed similar low variability. Sand content exhibited a large CV value of 42%, ranked third after IR and Ks. Only the silt content showed significantly (P<0.05) different mean values in plateaus (44%) and alluvial plains (49%).
3.2. Statistical relationships among soil properties
Table 2. Pearson statistical correlation coefficients among soil hydro-physical properties (n = 111) P-values are presented in parenthesis
Variable Ln(IR) Ln(Ks) BD Clay Silt Sand
Ln(IR) 0.65 (0.0001) 0.38 (0.0001) -0.38 (0.0001) -0.06 (0.5624) 0.28 (0.0029)
Ln(Ks) 0.41(0.0001) -0.32 (0.0001) -0.02 (0.8899) 0.21 (0.0273)
BD -0.43 (0.0001) -0.28 (0.0027) 0.49 (0.0001)
Clay -0.04 (0.7489) -0.61 (0.0001)
Silt -0.77 (0.0001)
3.3. Spatial structure analysis
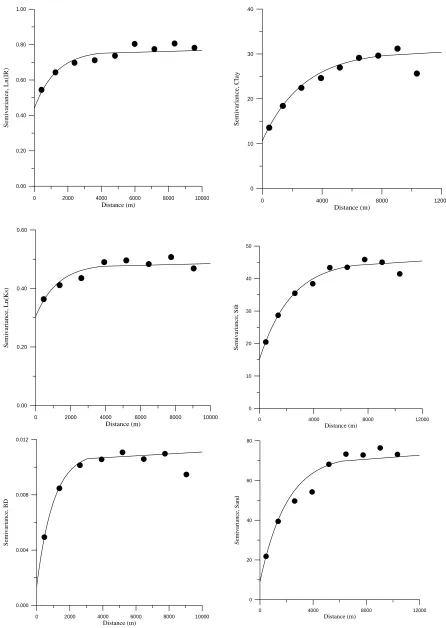
Attempts to calculate surface variograms and directional variograms resulted in no obvious and pronounced anisotropy and trend behavior in variables (data not shown). Table 3 lists the variogram parameters for the variables. The variograms of selected soil variables are shown in Fig. 2. To define the degree of spatial dependency, spatial class ratios similar to those
presented by Cambardella et al. (1994) were adopted. That is the ratio of nugget variance (noise) to total variance (sill) multiplied by 100. If the ratio of spatial class was less than 25% then the variable is considered to be strongly spatially dependent; if the ratio was between 25% and 75%, the variable was regarded as moderately spatially dependent; and if the ratio was more than 75%, the variable was considered weakly spatially dependent.
Table 3. Variogram characteristics of soil hydro-physical properties
Variable Model Nugget Sill Range (m) Spatial dependency class
Ln(IR) Exp. 0.4408 0.7673 3936.5 moderate
Ln(Ks) Exp. 0.3050 0.4850 3850.0 moderate
BD Exp. 0.0014 0.0111 3080.0 strong
Clay Exp. 10.66 30.66 8250.0 moderate
Silt Exp. 15.20 45.60 7040.0 moderate
Sand Exp. 8.96 72.96 6160.0 strong
3.4. Estimating and mapping soil properties
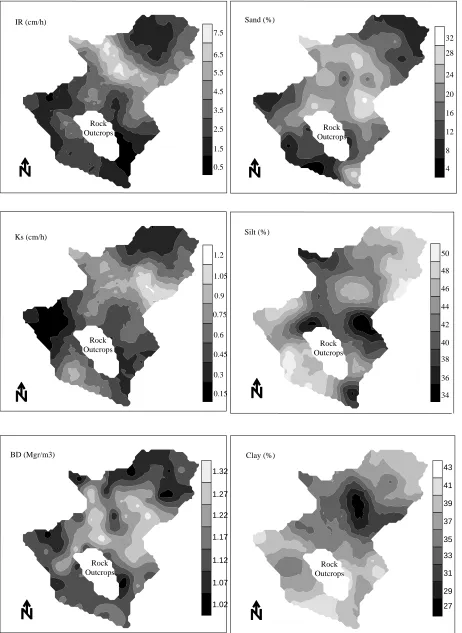
Ordinary kriging was used along with isotropic variograms to estimate soil hydrau-physical values at about 8500 not observed locations. Optimal kriging parameters were found based on the results from the cross validation procedure. A minimum of one and a maximum of eight data values within the search ellipse (with a radius of about twice of corresponding range value) were included in the kriging estimation. Kriged maps of soil hydrau-physical variables are shown in Fig. 3.
4. Discussion
From the results presented, it is obvious that both IR and Ks were on average small at the region. Furthermore, field-measured IRs was more variable than other variables. Infiltration rate was reported to be highly influenced by the soil layer with lowest hydraulic conductivity in soil profile (Hillel, 1980). Ersahin (2003) found no significant relationship between IR and bulk density values of topsoil, but a significant correlation (P<0.05) was found between IR values and the percentage of silt. He found high negative correlation between IR and bulk density of subsoil indicating that the plow layer reduced IR considerably in his study area. The same result was reported by Henderson and Haise (1987). Accordingly this may result in
temporary excessively wet condition during heavy rainfall or irrigation.
In the current study, the strong positive correlations between IR and Ks values with bulk density values of topsoil are not only noteworthy but should be interpreted in the light of the strong negative relation between bulk density and clay content on one side and the same negative correlation of IR and Ks values with the percentage of clay on the other side. Considering different stratification strategies did not result in improving or altering relationships among soil properties.
The fitted variograms indicated the existence of moderate to strong spatial dependency for all soil hydro-physical properties. Among all variables, the nugget percentage calculated for sand content (12.28%) and bulk density (12.61%) were low, which suggested that these variables showed a considerable spatial dependence within sampling distances. However, Ks (62.89%) and IR (57.45%) showed high nugget percentage, which corresponded to the distinctive class of moderately spatially dependence.
The experimental variogram of
0 2000 4000 6000 8000 10000
Distance (m)
0.00 0.20 0.40 0.60 0.80 1.00
S
e
m
ivar
iance
, L
n
(I
R
)
0 2000 4000 6000 8000 10000
Distance (m)
0.00 0.20 0.40 0.60
Semiv
a
rian
ce, L
n
(K
s)
0 2000 4000 6000 8000 10000
Distance (m)
0.000 0.004 0.008 0.012
Se
m
iv
a
ri
an
ce
, B
D
0 4000 8000 12000
Distance (m)
0 10 20 30 40
Se
m
ivar
iance, Clay
0 4000 8000 12000
Distance (m)
0 10 20 30 40 50
Se
m
iv
a
ri
an
ce
, S
il
t
0 4000 8000 12000
Distance (m)
0 20 40 60 80
Sem
ivari
anc
e
, Sand
Fig. 3. Kriged maps of different soil hydrau-physical properties
27 29 31 33 35 37 39 41 43 Clay (%)
Rock Outcrops
34 36 38 40 42 44 46 48 50 Silt (%)
Rock Outcrops
4 8 12 16 20 24 28 32 Sand (%)
Rock Outcrops
1.02 1.07 1.12 1.17 1.22 1.27 1.32 BD (Mgr/m3)
Rock Outcrops
0.15 0.3 0.45 0.6 0.75
0.9 1.05 1.2 Ks (cm/h)
Rock Outcrops
0.5 1.5 2.5 3.5 4.5 5.5 6.5 7.5 IR (cm/h)
At the hillslope scale, they considered linear models for IR values for different infiltrometer sizes. The Ln-transformed IR values were spatially dependent over a distance of 3936.5 m (Table 3). Ersahin (2003) reported a range of approximately 165 m for 50 IR values measured on an 8.5 ha field. Vieira et al. (1981) reported a range of 50 m for 1280 measured IR values within a 160 by 50 m filed. Haws et al. (2004) characterized their variograms at the landscape scale with the range values from 169.7 to 209.4 m for different infiltrometer sizes. The calculated range value for IR values in the present study was far greater than those filed-scale studies reported by above authors.
Like IR, the Ln-transformed Ks values showed a spatial structure which was modeled using an exponential model. Compared with the present study, Iqbal et al. (2005) reported an exponential model for Ks values for surface, subsurface and deep horizons. Similar to our results, they found moderate spatial dependence for the Ks values of surface horizon. The close similarity of the geostatistical range values obtained for IR (3936.5 m) and Ks (3850 m) is noteworthy. Furthermore, both variables presented almost the same class of spatial dependency (nugget percentage). Sobieraj et al. (2004) investigated the scale dependency of spatial patterns of Ks along independent transects at sampling intervals of 25, 10, 1 and 0.25 m. Their independent transects spanning the entire catena at lag intervals of 25 and 10 m revealed little to no spatial patterns in Ks. Their calculated variograms displayed little autocorrelation in Ks. However, as their sampling precision increased, sampling intervals of 1 and 0.25 m, spatial patterns emerged in Ks. Some other studies also reported spatial structure in Ks (Wilson et al., 1989; Ciollaro and Romano, 1995).
The resulting variogram of BD indicated the existence of strong spatial dependence. The same result was reported by Ersahin (2003). Iqbal et al. (2005) reported moderate spatial dependency for bulk density for surface, subsurface and deep horizons. Compared with the present study, Tsegaye and Hill (1998) attributed 75% of total spatial variability of surface bulk density to the nugget variance. Their sampling interval was 1 m in a very small area (45 by 37 m) located on a level landscape. In the present study, although the range value for BD is much less than range values of both IR and Ks, but these values could be classified in a class with almost close and same range values. The other class of range values might
contain range values of clay, silt and sand content.
The spatial structure analysis of textural fractions indicated spatial variability across the region for soil texture. The variograms for clay and silt content revealed moderate spatial structure, while, the variogram for sand content indicated strong spatial dependence. The same results were obtained by Iqbal et al. (2005). But, they found higher percentage nugget effect with the lower range values for sand and clay content in the subsoil and deep soil horizons in a 162 ha field. By contrast, we found very large range values for all three soil fractions which could be attributed to the present landscape-scale study. Chien et al. (1997) reported weak to moderate spatial dependence, nugget percentage of 57 to 80%, for clay, silt, and sand content. Their data sets were derived from soils in a 10 km2 area. Empirical variograms of clay, silt, and sand content calculated by Sobieraj et al. (2004) showed ranges exceeding the scale of observation (>220 m), reflecting the large-scale, catena-wide spatial patterns of these soil properties.
Our finding of two classes of the geostatistical range values might be roughly attributed to the geomorphological (topography and landforms) and geological (parent materials) characteristics of the present landscape. The first class of range values (in average of 3.5 km) coincides with landscape morphology; while the second class of range values (in average of 7 km) could be in agreement with geological structure of the study area.
Kriged map of IR indicated that higher IR values were found in the middle part of the study area, extending from NW to SE. Almost the same spatial distribution was found for estimated Ks values. Values for IR in plateaus and upper terraces were higher than estimated values in alluvial plains. Furthermore, close spatial similarities were found between IR and bulk density, IR and sand content, Ks and bulk density, and Ks and sand content maps. It seems to us that the spatial distribution patterns of bulk density is more similar to spatial variability patterns of sand content than the other variables. The clear opposite spatial distribution patterns were found between clay content and the other soil variable maps.
distribution of physical soil properties like clay, silt, and sand content are more smooth and gradual than the soil hydraulic properties. These spatial patterns might reflect the transitions among earth materials and geological patterns. However, the spatial distribution of soil hydraulic properties closely followed the distribution pattern of topographical elements such as landforms. Although, we could not investigate the influences of land use practices due to the selected level of spatial scale of the present study and low levels of land use management in the area, but it seems to us that the spatial distribution of bulk density might indicate a differential soil hydrau-physical behavior of both different land uses and catena-wide scales.
5. Conclusions
This catchment-scale study demonstrated that there is a moderate to strong spatial dependency in the selected soil hydrau-physical properties. The statistical analysis revealed that among selected soil variables, IR had the greatest variability with a CV of 72%. Moreover, measured Ks values (67%) and sand content (42%) showed higher coefficient of variations. Bulk density values displayed the lowest coefficient of variation (9%). The statistical variation of clay and silt content was almost the same (14%). The mean values of IR and Ks indicated lower and weak hydraulic behavior of soils due to the extent of heavy-textured soils. In order to investigate and determine the factors controlling the selected variables, two stratification strategies were performed on the data set. The results showed that there was a significant difference in the mean values of IR in two different landforms (plateaus vs. alluvial plains). However, no significant differences were found in mean values of IR at two different land use types (dry farming vs. rangelands). The contrasting results were found for mean values of Ks. That is, the mean values of Ks showed significant difference in two different land use types. The Pearson correlations showed significant relationships (P<0.05) between IR and Ks (0.65), bulk density (0.38), sand (0.28), and clay content (-0.37). Almost the same results were found for Ks values, however, compared to IR, the strength of relationships between Ks and bulk density was higher (0.40), Ks and sand content (0.21), and clay content (-0.31) were lower.
Analysis of spatial structures of different soil hydrau-physical properties revealed that
stochastic distribution of some soil hydro-physical properties at a catchment scale in a semi-arid region. This study is applicable for hillslope- (catena) and catchment-scale modeling and decision making.
References
Bosch, D.D. and L.T. West, 1998. Hydraulic conductivity variability for two sandy soils. Soil Sci. Soc. Am. J. 62: 90-98.
Buttle, J.M., D.A. House, 1997. Spatial variability of saturated hydraulic conductivity in shallow macroporous soils in a forested basin. J. Hydrology 203: 127-142.
Cambardella, C.A., T.B. Moorman, T.B. Parkin, D.L. Karlen, R.F. Turco, and A.E. Konopka, 1994. Field scale variability of soil properties in Central Iowa soils. Soil Sci. Soc. Am. J. 58: 1501-1511.
Chien, Y.J., D.Y. Lee, H.Y. Guo and K.H. Houng, 1997. Geostatistical analysis of soil properties of mid-west Taiwan soils. Soil Science 162(4): 291-298.
Ciollaro, G. and N. Romano, 1995. Spatial variability of the hydraulic properties of a volcanic soil. Geoderma 65: 263-282.
Davis, S.H., R.A. Vertessy and R.P. Silberstein, 1999. The sensitivity of a catchment model to soil hydraulic properties obtained by using different measurement methods. Hydrological Processes 13(5): 677-688. Davis, J.C., 1986. Statistics and data analysis in geology, John Wily and Sons, NY.
Ersahin, S., 2003. Comparing ordinary kriging and cokriging to estimate infiltration rate. Soil Sci. Soc. Am. J. 67: 1848-1855.
Gee, G.W. and J.W. Bauder, 1986. Particle size analysis. In: A. Klute (Ed.), methods of soil analysis. Part 1. 2nd edition. Agron. Monogr. 9. ASA and SSSA, Madison, WI. Pp. 404-407.
Golden Software Inc., 2000. Surface Mapping System, Surfer 7.02, Colorado, USA.
Haws, N.W., B. Liu, C.W. Boast, P.S.C. Rao, E.J. Kladivko, and D.P. Franzmeier, 2004. Spatial variability and measurement scale of infiltration rate on an agricultural landscape. Soil Sci. Soc. Am. J. 68: 1818-1826.
Henderson, D.W. and H.R. Haise, 1987. Control of water intake rates. In: R.M. Hagan et al. (Eds.), Irrigation of agricultural lands. Agron. Monogr. 11. ASA and SSSA, Madison, WI. Pp. 925-940.
Hillel, D., 1980. Introduction to soil physics, Academic Press Inc., San Diego, CA.
Iqbal, J., A. Thomasson, J.N. Jenkins, P.R. Owens, and F.D. Whisler, 2005. Spatial variability analysis of soil physical properties of alluvial soils. Soil Sci. Soc. Am. J. 69: 1338-1350.
Isaaks, H.E. and R.M. Srivastava, 1989. An introduction to applied geostatistics. Oxford University Press, NY.
Klute, A. and C. Dirksen, 1986. Hydraulic conductivity and diffusitivity: laboratory methods. In: A. Klute (Ed.), methods of soil analysis. Part 1. 2nd edition. Agron. Monogr. 9. ASA and SSSA, Madison, WI. Pp. 687-734.
Litaor, I.M., Seastedt, T.R. Walker, D.A., 2002. Spatial analysis of selected soil attributes across an alpine topographic/snow gradients. Landscape Ecology 17, 71-85.
Mallants, D., P.M. Binayak, J. Diederik, and J. Feyen, 1996. Spatial variability of hydraulic properties in a multi-layered soil profile. Soil Sci., 161: 167-181. McBratney, A.B., 1998. Some considerations on methods for spatially aggregating and disaggregating soil information. Nutrient Cycling Agroecosystem 50: 51-62.
Mohanty, B.P. and Z. Mousli, 2000. Saturated hydraulic conductivity and soil water retention properties across a soil-slope transition. Water Resources Research 36: 3311-3324.
Oline, D.K. and M.C. Grant, 2002. Scaling patterns of biomass and soil properties: an empirical analysis. Landscape Ecology 17: 13-26.
Pannatier, Y., 1996. VARIOWIN: software for spatial data analysis in 2D. Statistics and computing series, Springer-Verlag, Berlin.
Rasse, D.P., A.J.M. Smucker, and D. Santos, 2000. Alfalfa and shoot mulching effects on soil hydraulic properties and aggregation. Soil Sci. Soc. Am. J. 64: 725-731.
Reynolds, W.D. and W.D. Zebchuk, 1996. Hydraulic conductivity in a clay soil: two measurement techniques and spatial characterization. Soil Sci. Soc. Am. J. 60: 1679-1685.
Sisson, J.B. and P.J. Wierenga, 1981. Spatial variability of steady-state infiltration rates as a stochastic process. Soil Sci. Soc. Am. J. 45: 699-704.
Sobieraj, J.A., H. Elsenbeer, and G. Cameron, 2004. Scale dependency in spatial patterns of saturated hydraulic conductivity. Catena 55: 49-77.
Sobieraj, J.A., H. Elsenbeer, R. Marques, and B. Newton, 2002. spatial variability of soil hydraulic conductivity along a tropical rainforest catena. Geoderma 108(1-2): 79-90.
Tsegaye, T. and R.L. Hill, 1998. Intensive tillage effects on spatial variability of soil physical properties. Soil Science 16(2): 143-154.
Vauclin, M., S.R. Vieira, G. Vachaud, and D.R. Nielsen, 1983. The use of co-kriging with limited field soil observations. Soil Sci. Soc. Am. J. 47: 175-184. Vieira, S.R., D.R. Nielsen, and J.W. Biggar, 1981. Spatial variability of filed-measured infiltration rate. Soil Sci. Soc. Am. J. 45: 1040-1048.
Wilson, G.V., J.M. Alfonsi, and P.M. Jardine, 1989. Spatial variability of saturated hydraulic conductivity of the subsoil of two forested watersheds. Soil Sci. Soc. Am. J. 53: 679-685.