Early college high school achievement outcomes in North
Carolina: End of grade and ACT performance
Kaniuka, Theodore
Fayetteville State University, USA (tkaniuka@uncfsu.edu)
Received: 15 November 2016 Revised: 14 December 2016 Accepted: 18 January 2017
Available Online: 24 January 2017 DOI: 10.5861/ijrse.2017.1690
ISSN: 2243-7703 Online ISSN: 2243-7711
OPEN ACCESS
Abstract
High school reform in the United States has a long and unremarkable history with regard to
improving the outcomes of traditionally underrepresented youth. Beginning in 2002, North
Carolina began to implement the Early College High School model. In 2012 the state of North
Carolina adopted a new accountability program that includes the ACT as a measure of college
readiness in addition to the long-standing end-of-course assessments in English, algebra, and
biology. Several reports and research studies have been conducted to evaluate the
performance outcomes of early college students to traditionally prepared high school students
and found in general early college students do as well if not better than their peers. This study
examines four years of performance outcomes using the North Carolina End of Grade Tests
and one year of ACT results for all students in the testing program. Of particular interest was
examining the achievement gaps between Hispanic, Black, and White students over time and
then assessing EOC and ACT performance as an indicator of college readiness. The findings
indicate that (a) early college high school students tend to perform better on EOC and ACT
assessments, (b) that the benefits of attending an early college can in many cases mitigate the
effects of race, gender, and poverty, and (c) early college students may be more college ready
than traditionally prepared peers.
Keywords:
school reform; college readiness; school accountability; longitudinal analysis;
Early college high school achievement outcomes in North Carolina: End of grade and
ACT performance
1. Introduction
Increasing access to higher education for traditionally underserved students began in earnest in North Carolina in 2002 when then Governor Mike Easley relying on a grant from the Bill and Melinda Gates Foundation opened the first early college high schools under the umbrella of the Early College High School Initiative (Hoffman & Webb, 2009; Jobs For the Future [JFF], 2009) by improving the achievement of students. The emphasis on improving college access for students has now become a statewide initiative including all high schools with the recent redesign of the North Carolina high school accountability model that includes scores from the ACT for college bound students and the WorkKeys® for those students contemplating attending community colleges and maintains a focus on course specific exams. This new redesign calls for a focus on career and college readiness (North Carolina Department of Public Instruction [NCDPI], 2015) and includes new pathways students can select that are intended to improve preparation for post-secondary education. To more fully develop a readiness model, the ACT was chosen as a measure since it has been presented a as measure of college readiness and the ACT has developed standards that have been shown to correlate well with college success (Allen & Sconing, 2005).
The emphasis on increasing college access has also been addressed at the federal level when the United States Department of Education (USDOE) released the report A Test of Leadership: Charting the Future of U.S. Higher Education in 2006 which called for significant changes in higher education. Of the several areas suggested for improvement were access, affordability, quality of instruction, accountability, and innovation. Aside from calling on colleges to change, the report also cited that college professors reported that a substantial portion of college freshman were ill-prepared for the rigors of higher education. The report in addition to calling for reforms in higher education the commission “strongly encourages early assessment initiatives that determine whether students are on track for college” (p. 17). The report even endorsed the expansion of early college and dual enrollment programs. The combined focus in the report of simultaneously improving higher education and high school preparation has been reported to have had limited success (Field, 2011, September 23) in improving higher education access and accountability. Field stated that at the time of publication 14 states preformed early assessment to determine if students were ready for college, an increase of 8 since 2006 and in a related study Klasik (2013) also found that this policy had increased college access in several states.
This present study looked at one such reform advocated by the Spelling Report and that is currently being implemented on a large scale in North Carolina, the early college high school model and to a more limited degree across the United States. To determine if the early college model has an effect on a measure of college readiness, as defined by improved performance on the select course specific exams and ACT, answers to the following question was sought: In North Carolina do early college high schools have more students considered college ready as compared to traditional high schools? To reflect the nested nature of students within schools multilevel models were used to explore the possible mediating effects of student and school factors such as wealth, race, gender, and prior achievement.
2. High School Reform and Accountability
2.1 North Carolina School Accountability Model
students are ready for the future and in the case of high schools whether students are either career or college ready. The model for high schools includes assessing math performance in higher-level courses, ACT and WorkKeys® achievement, graduations rates, and a graduation project. Key to this model is the incorporation of ACT performance benchmarks (ACT, 2013). Schools will be evaluated on several factors including EOC exams, graduation rates and as to how many students achieve the benchmarks that ACT has developed as measures for college readiness. According to the ACT, students who meet the ACT Test benchmark have a high probability of success which is for those students meeting this standard there is a 50% chance they will receive a B of better in the corresponding college course. Other than previous research on the effect of AP and advanced courses on student readiness, passing course specific exams have not been included in a college readiness model (see DeBerard, Spielmans, & Julka, 2004; Long, Conger, & Iatarola, 2012; Scott-Clayton, 2012). The NCDPI does state that parents and students should expect scores to be lower than the national average as all grade 11 students will take the test, not just those students planning to attend college. The utilization of the ACT to gauge college readiness does have support (Richards & Lutz, 1968; Sawyer, 1989) to predict student success especially when coupled with high school grades (Noble, 1991; Noble & Sawyer, 2002), which the current accountability model substitutes for with end-of-grade test scores. On face the North Carolina model appears to be aligned with the available data on how to reasonably predict success beyond high school using standardized assessments and given the research presented by Klasik (2013) a model that if successful could contribute to better prepared students and increase college participation.
2.2 Design of the North Carolina Early College Model1
The Early College model in North Carolina is designed to provide students who are traditionally under-represented in post-secondary settings access to rigorous educational opportunities by supporting academic attainment in high school and beyond. The model is proposed to target who are predominately minority low-income students and who generally will be the first member of their immediate family to attend a college or university. The import of this is clear as minority students are less likely to attend college when compared to nonminority students according to American Council on Education [ACE], (2007). Compounding this is the nagging reality that in addition to minorities being less likely to attend college than other students, far fewer minority males access post-secondary education than minority females. Further complicating the issue, entrance to college is not only a function of academic performance, but one of accessibility in terms of affordability (Commission on the Future of Higher Education, 2006). So for low-income minority students attending college and /or graduating is problematic. The North Carolina model attempts to address these issues by providing post-secondary educational opportunities for Early College High School (ECHS) students by giving tuition-free access to community college and university level courses. These schools are located on the campuses of two-year and four-year colleges and universities to alleviate transportation barriers and provide access to higher education courses.
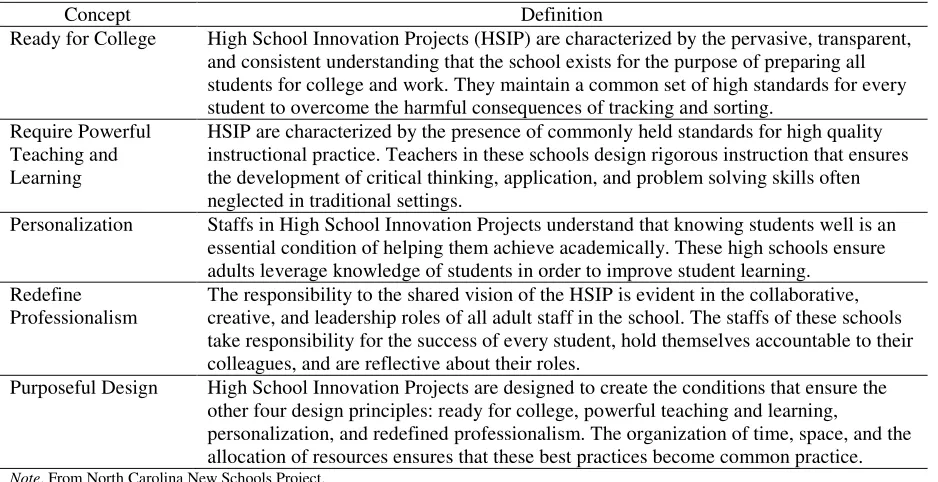
Table 1
Summary of the North Carolina High School Innovation Design Principles
Concept Definition
Ready for College High School Innovation Projects (HSIP) are characterized by the pervasive, transparent, and consistent understanding that the school exists for the purpose of preparing all students for college and work. They maintain a common set of high standards for every student to overcome the harmful consequences of tracking and sorting.
Require Powerful Teaching and Learning
HSIP are characterized by the presence of commonly held standards for high quality instructional practice. Teachers in these schools design rigorous instruction that ensures the development of critical thinking, application, and problem solving skills often neglected in traditional settings.
Personalization Staffs in High School Innovation Projects understand that knowing students well is an essential condition of helping them achieve academically. These high schools ensure adults leverage knowledge of students in order to improve student learning.
Redefine Professionalism
The responsibility to the shared vision of the HSIP is evident in the collaborative, creative, and leadership roles of all adult staff in the school. The staffs of these schools take responsibility for the success of every student, hold themselves accountable to their colleagues, and are reflective about their roles.
Purposeful Design High School Innovation Projects are designed to create the conditions that ensure the other four design principles: ready for college, powerful teaching and learning,
personalization, and redefined professionalism. The organization of time, space, and the allocation of resources ensures that these best practices become common practice. Note. From North Carolina New Schools Project.
Many traditional high school students can access these educational options; however taken they are unique to early colleges. For example, across the United States high school students can take college classes while in the traditional high school, however due to the way these opportunities are provided students are usually not well integrated into the college environment resulting is a disjointed learning experience (see ECSHI, 2012). A key curricular design element in early college high schools is the alignment of high school and college classes in a manner that accelerates four years of high school into two and coordinates the instructional delivery in the high school and college environments to have high school students that are not only successful in high school but also as college students. To assist in achieving this goal high school and college instructors attend professional development as a team, discuss students, and work collaboratively to support students (see ECHSI, 2012). Given at least in design, North Carolina seems well positioned as a state to increase college access and increase the representation in higher education of minorities and child of poverty. In North Carolina not all districts have early college high schools therefore investigating how district factors are related to the new college readiness measures may lead to a reconsideration of this by those districts not presently offering this option to students.
2.3 Research on the Early College Model
Recently there has been a marked increase of research concerning various aspects of the early college model. Beginning in earnest in last 7 years have provided an interesting picture of the impact of the EC model. Beginning with Edmunds et al. (2010) reported the performance of ECHS students was mixed as compared to other high school students. They found that ECHS students did have better graduation rates and improved discipline, but academic performance was not found to be consistently better than traditional high school students. Supporting the results of Edmunds, Kaniuka, and Vickers (2010) found that the students at one ECHS had consistently higher passing rates on selected North Carolina end-of-course high school tests when compared to traditional high school students.
much smaller for ECHS students. In a related study, Kaniuka (2012) found that EC high schools had overall higher rates of passing state exams and that the achievement gaps in terms of pass/fail were more narrow in EC schools. Expanding the research to include a national perspective a study by Berger, Adleman, and Cole (2010) reported that student achievement, accrual of college course credit, graduation rates, and overall progress were positive for ECHS students.
More recently Hall (2013) reports that at 4 North Carolina EC, students and faculty report higher rates of satisfaction along with high performance outcomes. Hall also states that the faculty at these high schools developed strong and supportive relationships with their students consistent with what Kaniuka and Vickers (2010) found. Garet, Knudson, and Hoshen, (2014) report that students attending EC as compared to their peers 1) have a greater opportunity to attend and graduate college, 2) had a superior academic trajectory in terms of earning a college degree; 3) had smaller achievement gaps between economic different students, and 4) their appeared to be long term benefits beyond the high school years for EC students. A series of papers from several authors (Edmunds, 2016; Edmunds et al., 2016; Haxton et al., 2016; Unlu, Edmunds, Fesler, & Glennie, 2015) found that EC students performed better as compared to similar students. These studies are grouped together as they all used similar data from North Carolina EC schools that utilized a lottery admission process and thus argued random selection existed allowing for causal arguments to be defended. In study that compares these lottery and non-lottery schools (Lauen, 2016) found that these effects existed in larger samples as well adding support to the generalization of the effects of the EC model. In a study using data from Texas EC schools, (Chapa, Kupczynski, Mundy, & Gibson, 2016) found that EC students tend to perform as well if not better in college English classes. This study seeks to add to this developing body of research by examining the performance of ECHS and traditional high school students by increasing the sample size and addressing issues in sample bias similar to Lauen (2016).
3. Methods
This study used a quasi-experimental design which incorporated multilevel regression modeling on panel data. The use of multilevel or hierarchical methods has been well documented and its purpose is clear (Raudenbush & Byrk, 2002). In this study utilizing hierarchical modeling provided the opportunity to examine both student and school effects in a nested model. The nested model reflected the theoretical posit that students attending a school are homogenous, across certain characteristics and that modeling such will account for the variance explained both within and between schools and students.
3.1 Research Questions/Objectives Purpose
This study was designed to seek answers to the following two questions:
What if any relationships exist between attending an ECHS and achievement as measured across select EOC performance scores?
What if any relationships exist between attending an ECHS and achievement as measured across select ACT performance scores?
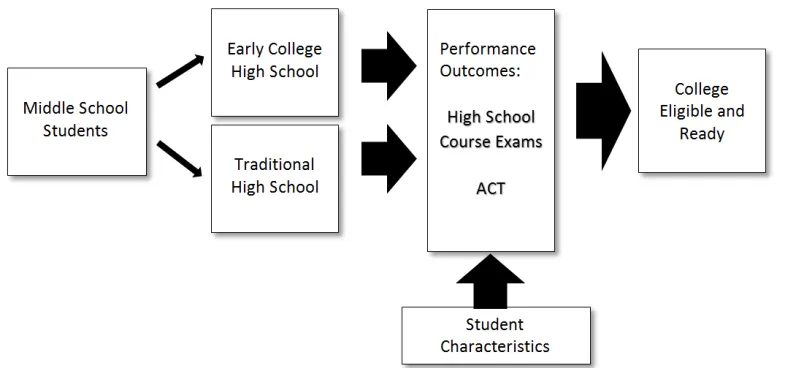
3.2 Conceptual Framework
Figure 1. Conceptual Model of Research Design
The model shows that middle school students can either enter a traditional or EC high school and due to state accountability requirements must take the same exams. The success students have on these exams are a function of their characteristics and high school experience which depending upon the outcome prepares them for post-secondary education. The model further hypothesizes that how well a student is prepared is dependent upon both the high they attend and any pretreatment characteristics.
3.3 Participants
This study utilizes the entire population of high school students between the years of 2008-2012 in the state of North Carolina. The importance of using this type of data was emphasized by Bell, Olsen, Orr, and Stuart (2016) when they discussed the external validity bias in studies that use non-random cities as compared to more inclusive data such as state-wide sources. They demonstrated that purposeful sampling and the non-random nature of such a design can yield such bias results resulting in findings inconsistent with larger or random design designs. Earlier in a similar vein, Stuart, Olsen, Bell, and Orr (2012) warned against purposeful selection of evaluation cites in studies designed to assess the effectiveness of programs and reforms. This study addresses these limitations as all EC high schools are included as well as traditional schools in districts that have such schools.
EOG - The data this is aspect of the study were provided by the North Carolina Department of Instruction’s data and research section. The data cover the school years from 2008-09 to 2011-12 and include individual student achievement records beginning in grade three to grade twelve. Data include in the set ranges from demographic data such as race, sex, wealth with achievement data on the North Carolina end-of-grade and end-of-course exams. Used in this study were pretreatment variables of sex, race, wealth, grade 8 reading and math achievement levels. Before conducting propensity score matching, each data set was reduced to include only those students from the education agency that sponsored the Early College to address heterogeneity across unmeasured variables. Once matched each data set was then propensity scored matched to yield four data sets across the different school years. The results from the matching are reported in Table 3.
Table 3 which resulted in 2460 students in each group. While the matching show no significant differences between the groups there are limitations to propensity score matching (Caliendo & Kopeinig, 2008; Guo & Fraser, 2015).
3.4 Data Analysis
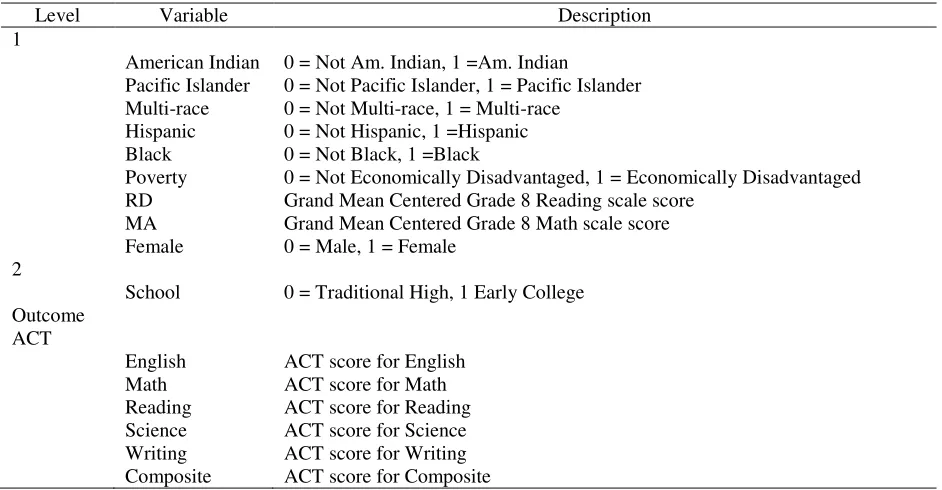
Descriptive statistics were computed from the data to report the means, standard deviation, percentages, and counts for each of the parameters used in the analysis. Table 2 reports the variable coding for the end-of-grade analysis while Table 3 reports the variables for the ACT component.
Table 2
Variable Coding
Level Variable Description
1
Hispanic 0 = Not Hispanic, 1 =Hispanic
Black 0 = Not Black, 1 =Black
Poverty 0 = Not Economically Disadvantaged, 1 = Economically Disadvantaged
RAL Grade 8 reading Achievement Level
MAL Grade 8 Math Achievement Level
Female 0 = Male, 1 = Female
2
School 0 = Traditional High, 1 Early College
Outcome EOG
Algebra 0 = Fail, 1 = Pass
English 0 = Fail, 1 = Pass
Biology 0 = Fail, 1 = Pass
Table 3
Variable Coding
Level Variable Description
1
American Indian 0 = Not Am. Indian, 1 =Am. Indian
Pacific Islander 0 = Not Pacific Islander, 1 = Pacific Islander Multi-race 0 = Not Multi-race, 1 = Multi-race
Hispanic 0 = Not Hispanic, 1 =Hispanic
Black 0 = Not Black, 1 =Black
Poverty 0 = Not Economically Disadvantaged, 1 = Economically Disadvantaged
RD Grand Mean Centered Grade 8 Reading scale score
MA Grand Mean Centered Grade 8 Math scale score
Female 0 = Male, 1 = Female
2
School 0 = Traditional High, 1 Early College
Outcome ACT
English ACT score for English
Math ACT score for Math
Reading ACT score for Reading
Science ACT score for Science
Writing ACT score for Writing
EOG Analysis - Data were analyzed using a two-level logistic mixed model with a random intercept and random slope for high school type. The level 1 and level 2 models are presented below.
Level-1 Model (i = ith student, j = jth school) Prob(BIOPASSij=1|βj) = ϕij
log[ϕij/(1 - ϕij)] = ηij
ηij = β0j + β1j*(RALij) + β2j*(MALij) + β3j*(Blackij) + β4j*(Hispanicij) + β5j*(Femaleij) + β6j*(Povertyij)
Mixed Model
ηij = γ00 + γ01*Schoolj + γ10*RALij + γ20*MALij + γ30*Blackij + γ40*Hispanicij + γ50*Femaleij + γ60*Povertyij + u0j
No unconditional model was run to assess the variance distribution across level 1 and level 2 given the concerns expressed by Raudenbush and Bryk (2002) as to the value of the information for such an effort.
ACT Analysis - The performance outcomes of English, mathematics, science, reading, writing, and an overall composite score were the dependent variables and the predictors were the student and school variables listed in Table 2. Racial characteristics of both the district and school are accounted for in the majority variable, which is a composite of Asian and white students.
An unconditional model was run first, one that does not have any estimation parameters to establish basic statistics that were used to calculate the intra-class district correlation and later to assess model fit using the deviance statistics to test the hypothesis that the addition of the level 2 predictors did not result in significant improvement in model fit. Below are two equations that represent, in the general case, the models used in the analysis. Originally the full model had two more level 2 variables, school district wealth and overall composite score of high school performance. When these variables were included at no time were the coefficients found to be significant for any ACT performance outcome.
Model 1– Unconditional (i = ith student, j = jth school) ACT Performanceij = γ00 + u0j+ rij
Model 2 – Full
ACTij = γ00 + γ01*Schoolj + γ10*RD08ij + γ20*MA08ij + γ30*Blackij + γ40*Hispanicij + γ50*Multiij + γ60*Pacific
Islanderij + γ70*Femaleij + γ80*Povertyij + u0j+ rij
The full model has a random intercept and the random slope for the School (ECHS). The random intercept was selected to reflect the variability in each school districts’ mean scores. The random slope for school type was selected to allow for the early college/not-early college gaps in performance to vary across the two school types again consistent with the observed differences revealed in the graphical and descriptive analyses.
4. Results
The results from the descriptive analysis for the independent variables are shown in Table 3 and 4 for the EOC and ACT analyses respectively. The propensity score matching for the EOC and ACT analysis shows the effect sizes are reasonable. The results of the matching for the EOC analyses showed for all four years that after matching that the number of students defined by the variables used is equal across the type of school. An effect size analysis was conducted for each data set and the ES was 0.00 for each variable.
percent each year with the largest gap being 5.7 percent in 2009 and 2010.
Table 3
Descriptive Data for Level 1 Independent Variables in EOC Analysis
Level 1 Year
Variable 2008 2009 2010 2011
N Percent
(Mean)
N Percent
(Mean)
N Percent
(Mean)
N Percent
(Mean)
RAL (3.54) (3.62) (3.61) (2.86)
MAL (3.56) (3.06) (3.14) (3.2)
Asian 32 4.3 43 2.9 58 3.2 55 2.5
Black 295 40 407 27.6 500 27.7 578 25.6
Hispanic 40 5.5 117 7.9 182 10.0 247 10.9
White 370 50.2 909 61.6 1063 58.9 1375 60.9
Female 440 59.7 896 60.7 1075 59.6 1384 62.3
Poverty 224 30.4 514 34.8 763 42.4 1012 44.9
Table 4
Descriptive Data for Level 2 Dependent Variables in EOC Analysis, Number Passing and (Percent Passing)
Level 2 Year
Variable 2008 2009 2010 2011
Traditional ECHS Traditional ECHS Traditional ECHS Traditional ECHS
Algebra 583
(81.5) 562 (81.1) 1108 (77.3) 1135 (80.8) 1389 (78.6) 1399 (80.8) 1821 (82.9) 1862 (83.3)
English 652
(90.7) 645 (94.6) 1233 (85.9) 1273 (90.9) 1560 (87.9) 1578 (91.4) 1927 (87.4) 2080 (92.9)
Biology 468
(65.7) 494 (71.4) 1101 (77.1) 1151 (82.8) 1429 (80.8) 1477 (85.3) 1832 (83.1) 1977 (88.4)
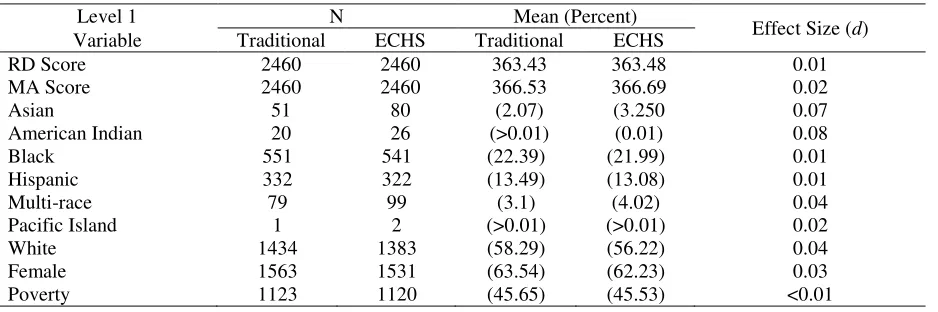
In tables 5 and 6 the descriptive statistics for the ACT analysis are displayed showing that the matching was far less effective in the ACT study. While that being the case the effect size differences are all small with 6 of the ten having an ES equal to or below 0.02. The small sample of Pacific Islander identified students could lead to bias and inconsistent estimations and is a limitation in this current sample.
Table 5
Descriptive Data for Level 1 Independent Variables in ACT Analysis
Level 1 N Mean (Percent)
Effect Size (d)
Variable Traditional ECHS Traditional ECHS
RD Score 2460 2460 363.43 363.48 0.01
MA Score 2460 2460 366.53 366.69 0.02
Asian 51 80 (2.07) (3.250 0.07
American Indian 20 26 (>0.01) (0.01) 0.08
Black 551 541 (22.39) (21.99) 0.01
Hispanic 332 322 (13.49) (13.08) 0.01
Multi-race 79 99 (3.1) (4.02) 0.04
Pacific Island 1 2 (>0.01) (>0.01) 0.02
White 1434 1383 (58.29) (56.22) 0.04
Female 1563 1531 (63.54) (62.23) 0.03
Poverty 1123 1120 (45.65) (45.53) <0.01
Table 6
Descriptive Data for Dependent Variables in ACT Analysis
Level 2 N Mean Standard Error
Variable Traditional ECHS Traditional ECHS Traditional ECHS
Composite 2396 2392 19.47 20.46 0.09 0.08
English 2397 2392 18.14 19.43 0.12 0.11
Math 2396 2392 20.07 20.72 0.09 0.08
Reading 2396 2392 19.76 20.74 0.09 0.08
Science 2396 2392 19.43 20.38 0.09 0.08
Writing 2381 2385 6.26 6.58 0.03 0.03
4.1 Mixed Model Results
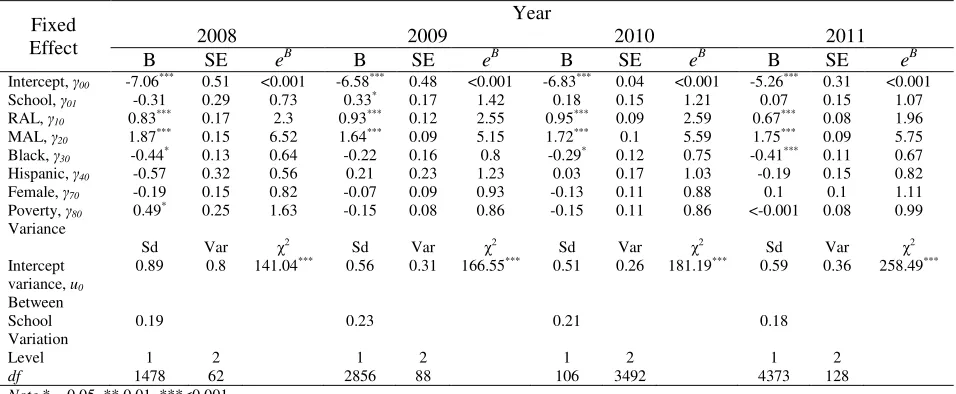
EOC - The results for the four years of EOC data are reported in the tables 7, 8, and 9. Table 7 shows the results for the unit averaged model due to the focus of this study on the level 2 model. Per Radenbush and Byrk (2002), the level two model how differences in the level 2 variables (School) related to differences in the level 1 processes in each level 1 unit (students). The tables are constructed across time to visually see if any differences or patterns can be gleamed. Comparing odds ratios is highly problematic and no agreement currently exists comparing the coefficients across models (personal email July 19, 2015, STATA listserve). That being the case the author chose not to compute differences at this time.
The effect of school attended on algebra performance is not consistent and 75% of the time was not significant implying that the probability of passing algebra was not able to be predicted by the type of school a student attended. What is clear, is that middle school performance for reading and math both were positively associated with increases in the odds that a student will pass algebra. Little else is clear for algebra, in three years Black students had a lower log odds of passing as compared to majority students (Asian and White).
Table 7
Summary of Multilevel Logistic Regression Analysis for Variables Predicting End-of-Course Algebra, Controlling for School Type and Student Characteristics
Fixed Effect
Year
2008 2009 2010 2011
B SE eB B SE eB B SE eB B SE eB
Intercept, γ00 -7.06*** 0.51 <0.001 -6.58*** 0.48 <0.001 -6.83*** 0.04 <0.001 -5.26*** 0.31 <0.001
School, γ01 -0.31 0.29 0.73 0.33* 0.17 1.42 0.18 0.15 1.21 0.07 0.15 1.07
RAL, γ10 0.83*** 0.17 2.3 0.93*** 0.12 2.55 0.95*** 0.09 2.59 0.67*** 0.08 1.96
MAL, γ20 1.87*** 0.15 6.52 1.64*** 0.09 5.15 1.72*** 0.1 5.59 1.75*** 0.09 5.75
Black, γ30 -0.44* 0.13 0.64 -0.22 0.16 0.8 -0.29* 0.12 0.75 -0.41*** 0.11 0.67
Hispanic, γ40 -0.57 0.32 0.56 0.21 0.23 1.23 0.03 0.17 1.03 -0.19 0.15 0.82
Female, γ70 -0.19 0.15 0.82 -0.07 0.09 0.93 -0.13 0.11 0.88 0.1 0.1 1.11
Poverty, γ80 0.49* 0.25 1.63 -0.15 0.08 0.86 -0.15 0.11 0.86 <-0.001 0.08 0.99
Variance
Sd Var χ2 Sd Var χ2 Sd Var χ2 Sd Var χ2
Intercept variance, u0
0.89 0.8 141.04*** 0.56 0.31 166.55*** 0.51 0.26 181.19*** 0.59 0.36 258.49***
Between School Variation
0.19 0.23 0.21 0.18
Level 1 2 1 2 1 2 1 2
df 1478 62 2856 88 106 3492 4373 128
Note * = 0.05, ** 0.01, ***<0.001.
present for Hispanic students but at a much smaller amount. Female students have a large benefit from attending an EC as their relative odds are 2.56. Finally, in 2010 students of poverty have greater odds of passing because of attending an ECHS ceteris paribus. The influence of the EC on English performance is not consistent and many of the student-centered variables are not significant predictors of passing English once the model controls for school at level two.
Table 8
Summary of Multilevel Logistic Regression Analysis for Variables Predicting End-of-Course English, Controlling for School Type and Student Characteristics
Fixed Effect
Year
2008 2009 2010 2011
B SE eB B SE eB B SE eB B SE eB
Intercept, γ00 -8.91*** 0.81 <0.01 -7.15*** 0.61 <0.01 -7.33*** 0.62 <0.01 -5.92 0.49 <0.01
School, γ01 0.69* 0.29 1.98 0.63*** 0.17 1.89 0.58** 0.19 1.78 0.95*** 0.17 2.59
RAL, γ10 2.46*** 0.22 11.64 1.93*** 0.14 6.86 2.12*** 0.14 8.33 1.77 0.11 5.91
MAL, γ20 1.0*** 0.18 2.72 0.85*** 0.1 2.34 0.81*** 0.1 2.23 1.15 0.13 3.15
Black, γ30 0.05 0.28 1.05 -0.13 0.14 0.88 -0.33* 0.15 0.72 -0.45 0.17 0.64
Hispanic, γ40 0.28 0.59 1.33 0.02 0.24 1.02 -0.52** 0.19 0.59 -0.24 0.21 0.78
Female, γ70 0.37 0.22 1.44 0.46* 0.18 1.59 0.36** 0.13 1.43 0.63 0.15 1.89
Poverty, γ80 -0.1 .032 0.9 -0.35* 0.17 0.71 -0.31* 0.13 0.73 -0.18 0.13 0.84
Variance
Sd Var χ2 Sd Var χ2 Sd Var χ2 Sd Var χ2
Intercept
variance, u0 0.49 0.25 56.06 0.34 0.11 98.48 0.63 0.39 171.88*** 0.46 0.22 154.44*
Between School Variation
0.07 0.13 0.11 0.09
Level 1 2 1 2 1 2 1 2
df 1405 61 2856 88 3493 105 4373 128
Note * = 0.05, ** 0.01, ***<0.001.
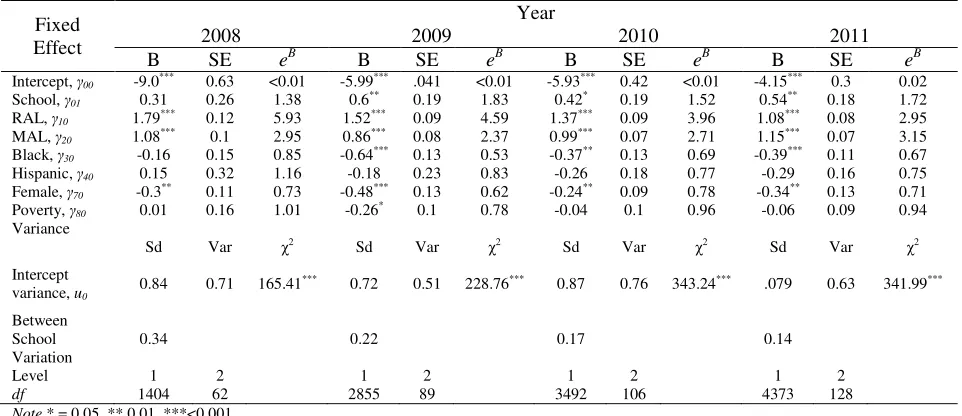
Table 9
Summary of Multilevel Logistic Regression Analysis for Variables Predicting End-of-Course Biology, Controlling for School Type and Student Characteristics
Fixed Effect
Year
2008 2009 2010 2011
B SE eB B SE eB B SE eB B SE eB
Intercept, γ00 -9.0*** 0.63 <0.01 -5.99*** .041 <0.01 -5.93*** 0.42 <0.01 -4.15*** 0.3 0.02
School, γ01 0.31 0.26 1.38 0.6** 0.19 1.83 0.42* 0.19 1.52 0.54** 0.18 1.72
RAL, γ10 1.79*** 0.12 5.93 1.52*** 0.09 4.59 1.37*** 0.09 3.96 1.08*** 0.08 2.95
MAL, γ20 1.08*** 0.1 2.95 0.86*** 0.08 2.37 0.99*** 0.07 2.71 1.15*** 0.07 3.15
Black, γ30 -0.16 0.15 0.85 -0.64*** 0.13 0.53 -0.37** 0.13 0.69 -0.39*** 0.11 0.67
Hispanic, γ40 0.15 0.32 1.16 -0.18 0.23 0.83 -0.26 0.18 0.77 -0.29 0.16 0.75
Female, γ70 -0.3** 0.11 0.73 -0.48*** 0.13 0.62 -0.24** 0.09 0.78 -0.34** 0.13 0.71
Poverty, γ80 0.01 0.16 1.01 -0.26* 0.1 0.78 -0.04 0.1 0.96 -0.06 0.09 0.94
Variance
Sd Var χ2 Sd Var χ2 Sd Var χ2 Sd Var χ2
Intercept
variance, u0 0.84 0.71 165.41
*** 0.72 0.51 228.76*** 0.87 0.76 343.24*** .079 0.63 341.99***
Between School Variation
0.34 0.22 0.17 0.14
Level 1 2 1 2 1 2 1 2
df 1404 62 2855 89 3492 106 4373 128
Note * = 0.05, ** 0.01, ***<0.001.
performance gap between Blacks and majority students is reduced. Female students consistently benefit from attending an ECHS to such a degree that in each case when the school coefficient was significant, it was larger than the coefficient for female, eliminating the gender differences between males and females. Student poverty was not found to be a significant predictor of biology performance except for one year, 2009. These results may be attributed to the matching on pretreatment, as the students in this sample do have higher pretreatment scores, therefore the effects of poverty are somewhat moderated. An interesting outcome in this analysis is that for Hispanic students, only in 1 of 12 analyses was the coefficient found to be significant. This result may indicate that once matched on pretreatment variables, that being Hispanic does not predict high school outcomes as compared to the majority student.
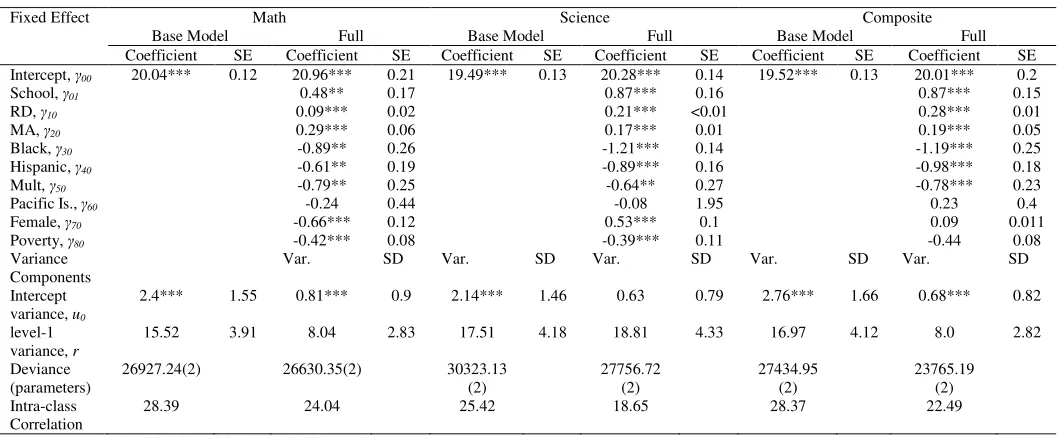
ACT - The question regarding whether students attending an Early College performed differently than their traditionally prepared peers. An unconditional model run for each outcome and the results reported in Tables 10 and 11. The estimates for the means of the dependent variables in the unconditional models are similar to the means presented in Table 9. The intra-class correlation (ICC) for these models was calculated to show the amount of variance in ACT scores that can be accounted for by group membership or in this case the school district. As seen in the table the unconditional ICCs ranged from a low of 29.84 for English to 22.34 for reading indicating that a significant amount the variance in ACT scores was at the school level. The conditional ICCs were calculated from the full models and in all cases moderate reductions in the amount of the variance of ACT explained by school attended. The moderate reductions in the ICC show that even after accounting for student variables, the amount of variation between groups (schools) remains high with the small reduction in the ICC being attributed to the within variation on ACT accounted for by students.
The results show that in all six cases, students attending an ECHS had higher ACT scores as compared to their traditionally prepared peers. The greatest advantage is seen in the slope coefficient associated with the intercept in English (γ01). Here ECHS students have scores that are predicted to be 1.19 points higher holding constant all other coefficients. The smallest advantage is in writing albeit still positive and significant and this test showed the fewest significant effects for student race. The influence of previous school achievement (Grade 8 Reading and Math), although highly significant which implies for students who had higher scores on their middle school assessments their ACT performance is predicated to increase although small in magnitude, clearly showing that while school attended is important, the effects of the high school are somewhat dependent on how well prepared the student was and students starting off with higher scores will on average continue to hold that advantage regardless of what high school they attend.
compared to male students in English.
Table 10
Summary of Linear Regression Analysis for Variables Predicting ACT Performance for Academic Achievement for English, Reading, and Writing Tests Controlling for School Type and Student Characteristics
Fixed Effect English Reading Writing
Base Model Full Base Model Full Base Model Full
Coefficient SE Coefficient SE Coefficient SE Coefficient SE Coefficient SE Coefficient SE
Intercept, γ00 18.21*** 0.16 18.21*** 0.24 19.89*** 0.15 20.05*** 0.22 6.29*** 0.05 5.96*** 0.07
School, γ01 1.19*** 0.21 0.92*** 0.19 0.31*** 0.08
RD, γ10 0.38*** 0.01 0.43*** 0.01 0.03*** <0.01
MA, γ20 0.16*** 0.06 0.11 0.06 0.04*** <0.01
Black, γ30 -1.38** 0.29 -1.27*** 0.28 -0.21*** 0.05
Hispanic, γ40 -1.7*** 0.22 -0.67*** 0.21 <0.01 0.07
Mult, γ50 -0.76** 0.32 -0.91** 0.32 <0.01 <0.11
Pacific Is.,
γ60
-0.37 0.84 1.57 0.95 0.46 0.31
Female, γ70 1.08*** 0.14 0.47** 0.15 0.57*** 0.05
Poverty, γ80 -0.52*** 0.13 -0.49*** 0.13 -0.15*** 0.04
Variance Components
Var. SD Var. SD Var. SD Var. SD Var. SD
Intercept variance, u0
4.54*** 2.13 1.22*** 1.11 2.59*** 1.61 0.63 0.79 0.32*** 0.56 0.19*** 0.43
level-1 variance, r
27.39 5.23 14.57 3.82 31.03 5.57 18.81 4.33 2.28 1.51 2.03 1.42
Deviance (parameters)
29738.73(2) 26630.35(2) 30323.13
(2) 27756.72 (2) 17717.54 (2) 17147.83 (2) Intra-class Correlation
29.84 22.49 22.34 15.53 26.78 23.43
Note. *p<0.05, **p<0.01, ***p<0.001, ~p<0.1.
Table 11
Summary of Linear Regression Analysis for Variables Predicting ACT Performance for Academic Achievement for Math, Science, and Composite Tests Controlling for School Type and Student Characteristics
Fixed Effect Math Science Composite
Base Model Full Base Model Full Base Model Full
Coefficient SE Coefficient SE Coefficient SE Coefficient SE Coefficient SE Coefficient SE
Intercept, γ00 20.04*** 0.12 20.96*** 0.21 19.49*** 0.13 20.28*** 0.14 19.52*** 0.13 20.01*** 0.2
School, γ01 0.48** 0.17 0.87*** 0.16 0.87*** 0.15
RD, γ10 0.09*** 0.02 0.21*** <0.01 0.28*** 0.01
MA, γ20 0.29*** 0.06 0.17*** 0.01 0.19*** 0.05
Black, γ30 -0.89** 0.26 -1.21*** 0.14 -1.19*** 0.25
Hispanic, γ40 -0.61** 0.19 -0.89*** 0.16 -0.98*** 0.18
Mult, γ50 -0.79** 0.25 -0.64** 0.27 -0.78*** 0.23
Pacific Is., γ60 -0.24 0.44 -0.08 1.95 0.23 0.4
Female, γ70 -0.66*** 0.12 0.53*** 0.1 0.09 0.011
Poverty, γ80 -0.42*** 0.08 -0.39*** 0.11 -0.44 0.08
Variance Components
Var. SD Var. SD Var. SD Var. SD Var. SD
Intercept variance, u0
2.4*** 1.55 0.81*** 0.9 2.14*** 1.46 0.63 0.79 2.76*** 1.66 0.68*** 0.82
level-1 variance, r
15.52 3.91 8.04 2.83 17.51 4.18 18.81 4.33 16.97 4.12 8.0 2.82
Deviance (parameters)
26927.24(2) 26630.35(2) 30323.13
(2) 27756.72 (2) 27434.95 (2) 23765.19 (2) Intra-class Correlation
28.39 24.04 25.42 18.65 28.37 22.49
Note. *p<0.05, **p<0.01, ***p<0.001, ~p<0.1.
5. Discussion
college readiness evaluation. Below these ideas will be developed more fully.
5.1 College Readiness
College readiness is for a lack of better term, being prepared to perform at the post-secondary level and is defined in several ways (Wiley, Wyatt, & Camara, 2011; North Carolina Department of Public Instruction, n.d.; US News, May 11, 2015). What they all have in common is performance expectations measure albeit on a variety of constructs all designed to predict to some degree whether a student will succeed in post-secondary education. In this study college readiness is viewed from two perspectives, passing the mandated course specific exams and the ACT college entrance test. For this group of schools, the results suggest that students attending early college high schools exhibit greater “college readiness” than do their traditional high school peers. In 75% of the possible outcomes, the effect of the type of school attended was significant a showed a benefit to ECHS students. This finding is consistent with previous work (Edmunds, Willse, Arshavsky, & Dallas, 2013; Garet, Knudson, & Hoshen, 2014; Garet, & Song, 2013) who found that the early college model was a benefit to students.
Across all six ACT performance measures, students attending early college students are estimated to have from a .31 to 1.19-point gain in mean ACT score. If in fact the ACT can be a useful determinant of college readiness (Allen & Sconing, 2005) and a view held by the State of North Carolina (2012), then early college high schools are predicated to have a clear advantage in meeting the revised accountability standards and their students will have a marked advantage in being successful in post-secondary environments. This finding is encouraging for the targeted population of traditionally underserved early college high school students. The ACT performance advantage is consistent with previous research on the North Carolina Early College program where it has been found that early college high schools have a narrower achievement gap (Kaniuka & Vickers, 2010; Kaniuka, 2012) and stronger performance in several academic areas including enhancing college readiness (Edmunds et al, 2010). Combined these findings point to a more promising future for children attending early college high schools as these school are predicted to attenuate several barriers facing minority and poor students in terms of college attendance. Researchers have found that minority and poor students fail to complete the necessary steps to apply to college and at a much lower rate than their white or non-poverty peers (Avery & Kane, 2004; Cabrera & La Nasa, 2001; Klasik, 2012). While the revised state accountability measures will have, all students take the ACT, students attending early college high schools appear to have the additional benefit of predicated higher performance.
The other school level variables were significantly related to student performance in a manner consistent with previous research (see Ma & Klinger, 2000). It was found that wealth and race had varying effects on student performance less for EOC but highly consistent with previous research with significant and profound estimated effects on student performance.
5.2 Suggestions for Future Research and Conclusion
One limitation of this study is the type of data that was available; data that included teacher level variables would add to the ability of researcher to parcel out the teacher effects, which when not accounted for fails to adequately represent the individual teachers and their unique influence on students. If teacher level data could be accessed, this study could be extended to the 3-level model where students would be nested in teachers (classrooms) and grouped in schools. This would allow for a more comprehensive, complex evaluation being possible by linking specific course performance to EOC/ACT scores and teacher variables and provide an opportunity to apply propensity score matching across students.
provide a clear picture of the success of the varying types of programs.
The results in this study and others seem to support the notion that as a high school reform, the early college model is quite effective in increasing student achievement and as defined in the context of North Carolina, it produces more college ready students. While the cost of maintaining the early college model is shared by the state and district, the bulk of the cost is borne by the state making this reform fiscally appealing. If post-secondary opportunities are to be improved for all high school students then further understanding of how districts influence achievement is needed and second, if the early college model is as effective as shown by the study, either continued expansion of the program is warranted or determining those salient programmatic processes and features that yield these outcomes need to be better understood and scale up conducted to provide these opportunities to more students.
6. References
ACT (2013). What are ACT’s college readiness benchmarks? Retrieved from http://www.act.org/research/policymakers/pdf/benchmarks.pdf
Allen, J., & Sconing, J. (2005). Using ACT Assessment scores to set benchmarks for college readiness. ACT Incorporated.
American Council on Education. (October 30, 2006). Students of color make dramatic gains in college enrollment but still trail whites in the rate at which they attend college. Retrieved from
http://www.acenet.edu/AM/Template.cfm?Section=Search&template=/CM/HTMLDisplay.cfm&Conten tID=21571
Avery, C., & Kane, T. (2004). Student perceptions of college opportunities: The Boston COACH program. In
College choices: The economics of where to go, when to go, and how to pay for it (pp. 355-391). Chicago. IL: University of Chicago Press. https://doi.org/10.7208/chicago/9780226355375.003.0009
Bell, S. H., Olsen, R. B., Orr, L. L., & Stuart, E. A. (2016). Estimates of external validity bias when impact evaluations select sites nonrandomly. Educational Evaluation and Policy Analysis, 38(2), 318-335 https://doi.org/10.3102/0162373715617549
Berger, A., Adelman, N., & Cole S. (2010). The early college high school initiative: An overview of five evaluation years. Peabody Journal of Education 85, 333–347.
https://doi.org/10.1080/0161956X.2010.491697
Cabrera, A., & La Nasa, S. (2001). On the path to college: Three critical tasks facing America’s disadvantaged.
Research in Higher Education, 42, 119-149. https://doi.org/10.1023/A:1026520002362
Caliendo, M., & Kopeinig, S. (2008). Some practical guidance for the implementation of propensity score matching. Journal of economic surveys, 22(1), 31-72. https://doi.org/10.1111/j.1467-6419.2007.00527.x Chapa, M. M., Kupczynski, L., Mundy, M.-A., & Gibson, A. M. (2016). An evaluation of early college high
school models and traditional high schools on early college readiness in English. School of Arts and Humanities. Paper 10. Retrieved from http://digitalcommons.apus.edu/facultySAH/10
DeBerard, M. S., Spielmans, G., & Julka, D. (2004). Predictors of academic achievement and retention among college freshmen: A longitudinal study. College student journal, 38(1), 66-80.
Early College High School Initiative. (2012). Schools. Retrieved from http://www.earlycolleges.org/schools.html Edmunds, J. A. (2016). Early college puts youth on a college track. Phi Delta Kappan, 97(5), 38-42.
https://doi.org/10.1177/0031721716629656
Edmunds, J. A., Willse, J., Arshavsky, N., & Dallas, A. (2013). Mandated engagement: The impact of early college high schools. Teachers College Record, 115(7), 1-31.
Edmunds, J., Bernstein, L., Glennie, E., Willse, J., Arshavsky, N., Unlu, F.... Dallas, A. (2010). Preparing students for college: The implementation and impact of the early college high school model. Peabody
Journal of Education, 85, 348–364. https://doi.org/10.1080/0161956X.2010.491702
Educational Effectiveness. https://doi.org/10.1080/19345747.2016.1191574
Field, K. (2011, September 23). Spellings panel spurred progress but failed to remake higher education.
Chronicle of Higher Education, 58(5), 8.
Garet, M., & Song, M. (2013). Early college, early success: Early college high school initiative impact study. American Institutes for Research.
Garet, M., Knudson, J., & Hoshen, G. (2014). Early college, continued success: Early college high school initiative impact study. American Institutes for Research.
Guo, S. Y., & Fraser, M. W. (2010). Propensity Score Analysis: Statistical Methods and Applications.
Psychometrika, 75(4), 775-777.
Guo, S., & Fraser, M. W. (2015). Propensity score analysis: Statistical methods and applications. Los Angeles: Sage.
Hall, A. L. (2013). Program implementation and student outcomes at four western North Carolina early college high schools: A study synopsis. Community College Journal of Research and Practice, 37(9), 677-690. https://doi.org/10.1080/10668926.2013.774893
Harmston, M., Pliska, A. M., Ziomek, R. L., & Hackmann, D. G. (2003). The relationship between schedule type and ACT assessment scores: A longitudinal study. ACT, Incorporated.
Haxton, C., Song, M., Zeiser, K., Berger, A., Turk-Bicakci, L., Garet, M. S., ... & Hoshen, G. (2016). Longitudinal findings from the early college high school initiative impact study. Educational Evaluation and Policy Analysis, 38(2), 410-430. https://doi.org/10.3102/0162373716642861
Hoffman, N., & Webb, M. (2009, June 11). Early-college high school: Modest experiment or national movement?
Education Week. Retrieved from http://www.edweek.org/ew/articles/2009/06/11/35hoffman.html
Jobs for the Future (2010). Policies paved the way: Early college innovation in North Carolina. Boston: Author. Jobs for the Future (2011). Life beyond early college: Strategies for success. Retrieved from
http://www.jff.org/publications/education/life-beyond-early-college-strategies-suc/1208 Jobs for the Future. (2002). Early college high schools: Core principles. Retrieved from
http://www.earlycolleges.org/Downloads/CorePrinciples.pdf Jobs for the Future. (2009). A portrait in numbers. Boston: Author.
Kaniuka, T. & Vickers, M. (2010). Lessons learned: How early college high schools offer a pathway for high school reform. NASSP Bulletin. https://doi.org/10.1177/0192636510384982
Kaniuka, T. (2010). Lessons learned: How early college high schools offer a pathway for high school reform.
NASSP Bulletin. https://doi.org/10.1177/0192636510384982
Kaniuka, T. (2012). Narrowing the achievement gap on a state-wide sale: Student success. International Journal of Research Studies in Education, 1(1), 115-126. https://doi.org/10.5861/ijrse.2012.v1i1.35
Klasik, D. (2012). The college application gauntlet: A systematic analysis of the steps to four-year college enrollment. Research in Higher Education, 53, 506-549. https://doi.org/10.1007/s11162-011-9242-3 Klasik, D. (2013). The ACT of enrolment: The college enrolment effects of state-required college entrance exam
testing. Educational Researcher, 42(3), 151-160. https://doi.org/10.3102/0013189X12474065 Lauen, D. (2016, November). Early colleges in North Carolina: Assessing lottery and non-lottery impacts. In
2016 Fall Conference: The Role of Research in Making Government More Effective. Appam.
Long, M. C., Conger, D., & Iatarola, P. (2012). Effects of high school course-taking on secondary and postsecondary success. American Educational Research Journal, 49(2), 285-322.
https://doi.org/10.3102/0002831211431952
Ma, X. & Klinger, D. (2000). Hierarchical linear modeling of student and school effects on academic achievement. Canadian Journal of Education, 25(1), 41-55. https://doi.org/10.2307/1585867
Noble, J. (1991). Predicting college grades from ACT Assessment scores and high school course work and grade
information. American College Testing Program.
Noble, J., & Sawyer, R. (2002). Predicting different levels of academic success in college using high school GPA
and ACT composite score. American College Testing program.
North Carolina Department of Public Instruction. (August 24, 2012). New school accountability model focuses on career and college readiness. Retrieved from
http://www.ncpublicschools.org/newsroom/news/2012-13/20120824-01 North Carolina New Schools Project. (2015). Early college high schools. Retrieved from
http://ncnewschools.org/earlycollege/
Raudenbush, S. W., & Bryk, A. S. (2002). Hierarchical linear models: Applications and data analysis methods.
(2nd edition). Thousand Oaks, CA: Sage.
Richards, J. M., & Lutz, S. W. (1968). Predicting student accomplishment in college from the ACT assessment.
Journal of Educational Measurement, 5(1), 17-29. https://doi.org/10.1111/j.1745-3984.1968.tb00599.x Sawyer, R. (1989). Validating the use of ACT Assessment scores and high school grades for remedial course
placement in college. American College Testing program.
Scott-Clayton, J. E. (2012). Do high-stakes placement exams predict college success? Community College Research Center, Columbia University.
Stuart, E. A., Olsen, R. B., Bell, S. H., & Orr, L. L. (2012). Estimates of external validity bias when impact evaluations select sites purposively. Society for Research on Educational Effectiveness. Retrieved from http://files.eric.ed.gov/fulltext/ED530559.pdf
United States Department of Education, (2006). A test of leadership: Charting the future of U.S. higher education. Washington, DC.
Unlu, F., Edmunds, J., Fesler, L., & Glennie, B. (2015). A preliminary assessment of the cost and benefit of the North Carolina's early college high school model and its impact on postsecondary enrollment and earned college credit. Society for Research on Educational Effectiveness. Retrieved from
http://files.eric.ed.gov/fulltext/ED562097.pdf
US News and World Report. (May 15, 2015). How U.S. News Calculated the 2015 Best High Schools Rankings.
US News and World Report. Retrieved from
http://www.usnews.com/education/best-high-schools/articles/how-us-news-calculated-the-rankings Wiley, A., Wyatt, J. N., & Camara, W. J. (2011). The development of a multidimensional college readiness index.